| Param | Original file | Final file |
|---|---|---|
| Filename | modeM0/AS1A04_026T04_9000002060_13948cztM0_level2.evt | modeM0/AS1A04_026T04_9000002060_13948cztM0_level2_quad_clean.evt |
| Size (bytes) | 748,195,200 | 163,984,320 |
| Size | 713.5 MB | 156.4 MB |
| Events in quadrant A | 4,195,352 | 1,104,407 |
| Events in quadrant B | 4,515,510 | 1,110,621 |
| Events in quadrant C | 4,270,594 | 1,110,068 |
| Events in quadrant D | 9,080,684 | 1,028,769 |
| Mode M9 | |||
|---|---|---|---|
| Quadrant | BADHDUFLAG | Total packets | Discarded packets |
| A | 0 | 18 | 0 |
| B | 0 | 18 | 0 |
| C | 0 | 18 | 0 |
| D | 0 | 18 | 0 |
| Mode SS | |||
|---|---|---|---|
| Quadrant | BADHDUFLAG | Total packets | Discarded packets |
| A | 0 | 180 | 0 |
| B | 0 | 180 | 0 |
| C | 0 | 180 | 0 |
| D | 0 | 180 | 0 |
| Mode M0 | |||
|---|---|---|---|
| Quadrant | BADHDUFLAG | Total packets | Discarded packets |
| A | 0 | 18251 | 3 |
| B | 0 | 19150 | 2 |
| C | 0 | 18319 | 2 |
| D | 0 | 32971 | 2 |
| Quadrant | Total seconds | Saturated seconds | Saturation percentage |
|---|---|---|---|
| A | 8832 | 116 | 1.313406% |
| B | 8832 | 106 | 1.200181% |
| C | 8832 | 76 | 0.860507% |
| D | 8832 | 809 | 9.159873% |
Noise dominated data is calculated using 1-second bins in cleaned event files. If a bin has >2000 counts, and if more than 50% of those come from <1% of pixels, then it is considered to be noise-dominated and hence unusable.
| Quadrant | # 1 sec bins | Bins with >0 counts | Bins with >2000 counts | High rate bins dominated by noise | Noise dominated (total time) | Noise dominated (detector-on time) | Marked lightcurve |
|---|---|---|---|---|---|---|---|
| A | 10648 | 8835 | 1 | 1 | 0.01% | 0.01% | 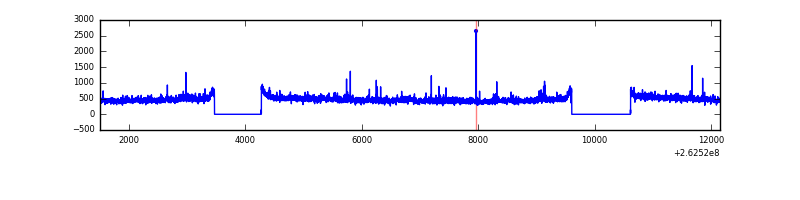 |
| B | 10648 | 8835 | 8 | 8 | 0.08% | 0.09% | 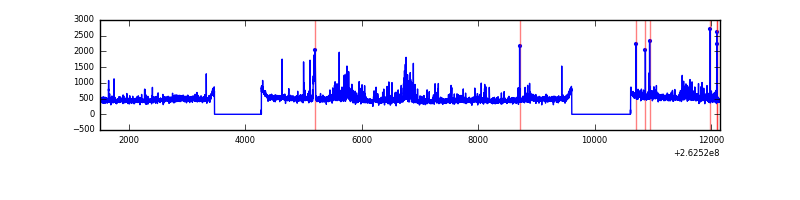 |
| C | 10648 | 8835 | 9 | 9 | 0.08% | 0.10% |  |
| D | 10648 | 8835 | 886 | 886 | 8.32% | 10.03% | 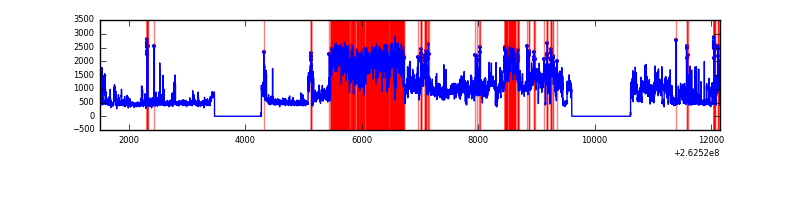 |
Top three noisy pixels from each quadrant. If the there are fewer than three noisy pixels in the level2.evt file, extra rows are filled as -1
| Pixel properties | Quadrant properties | ||||||
|---|---|---|---|---|---|---|---|
| Quadrant | DetID | PixID | Counts | Sigma | Mean | Median | Sigma |
| A | 1 | 162 | 48578 | 225.34 | 1044 | 1018 | 211.1 |
| A | 8 | 15 | 44087 | 204.06 | 1044 | 1018 | 211.1 |
| A | 15 | 157 | 22468 | 101.63 | 1044 | 1018 | 211.1 |
| B | 0 | 189 | 254989 | 1283.07 | 1040 | 1013 | 197.9 |
| B | 3 | 209 | 61113 | 303.62 | 1040 | 1013 | 197.9 |
| B | 3 | 64 | 28226 | 137.48 | 1040 | 1013 | 197.9 |
| C | 3 | 233 | 224963 | 956.21 | 1018 | 1022 | 234.2 |
| C | 0 | 207 | 45293 | 189.03 | 1018 | 1022 | 234.2 |
| C | 14 | 234 | 13369 | 52.72 | 1018 | 1022 | 234.2 |
| D | 13 | 122 | 4348297 | 16590.38 | 992 | 969 | 262.0 |
| D | 12 | 110 | 280199 | 1065.6 | 992 | 969 | 262.0 |
| D | 1 | 52 | 191948 | 728.82 | 992 | 969 | 262.0 |
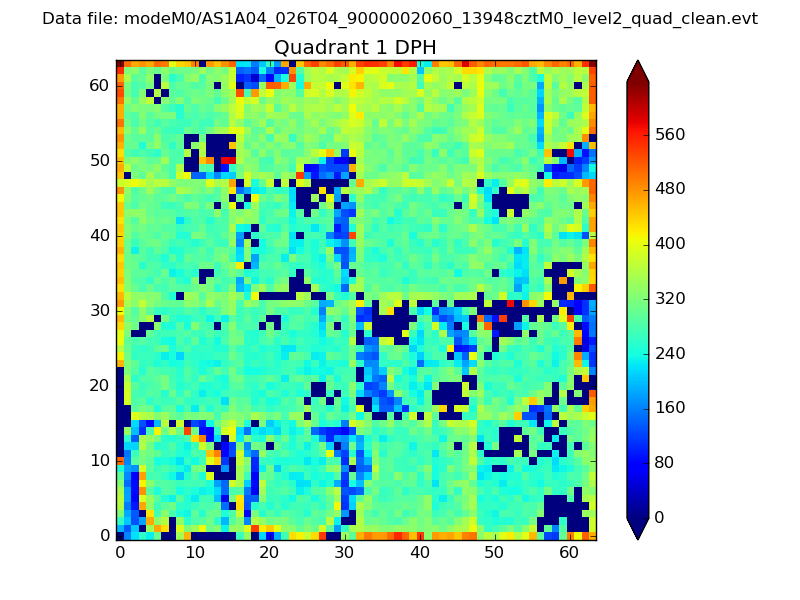
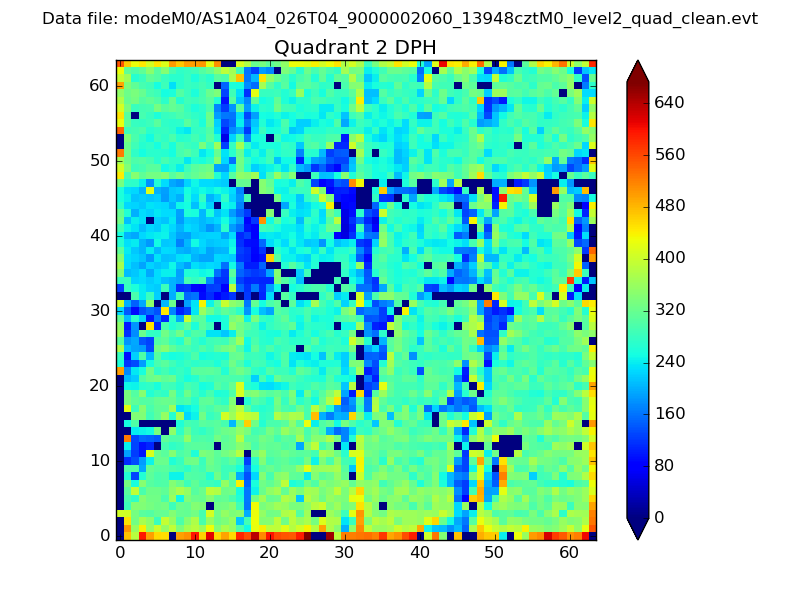
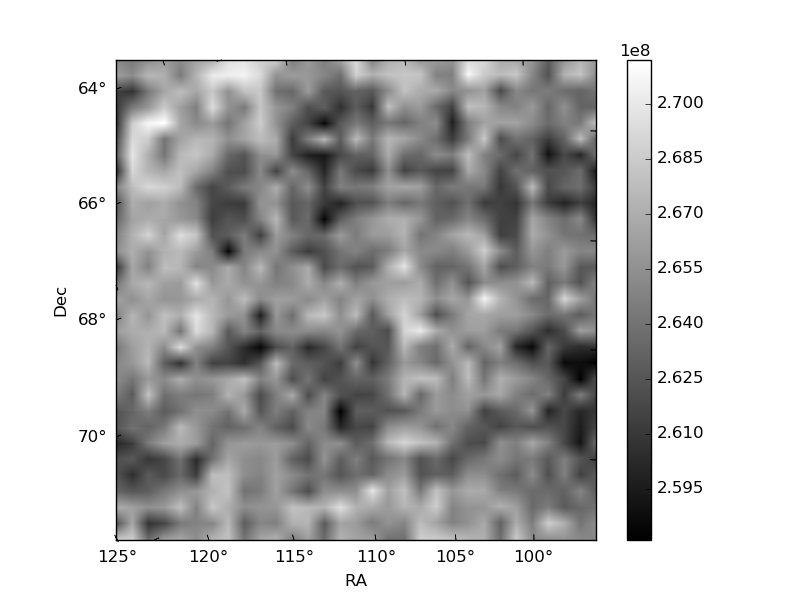
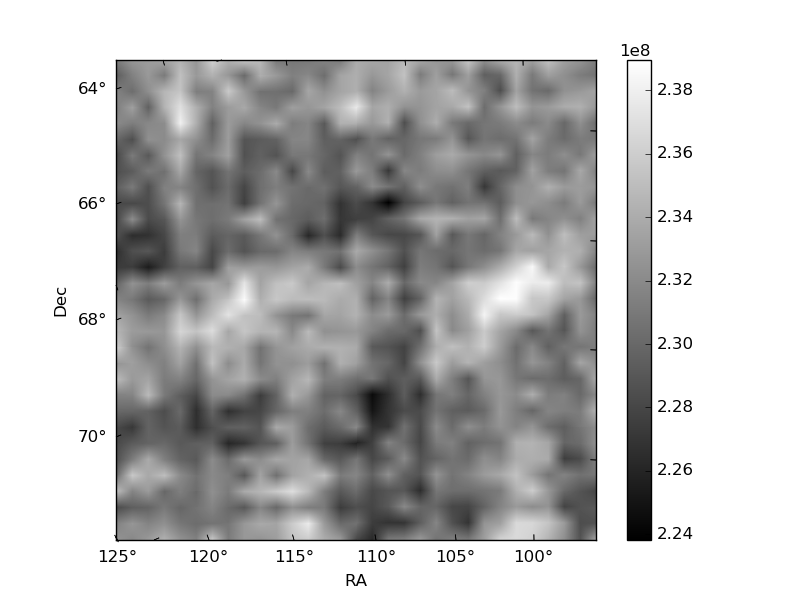
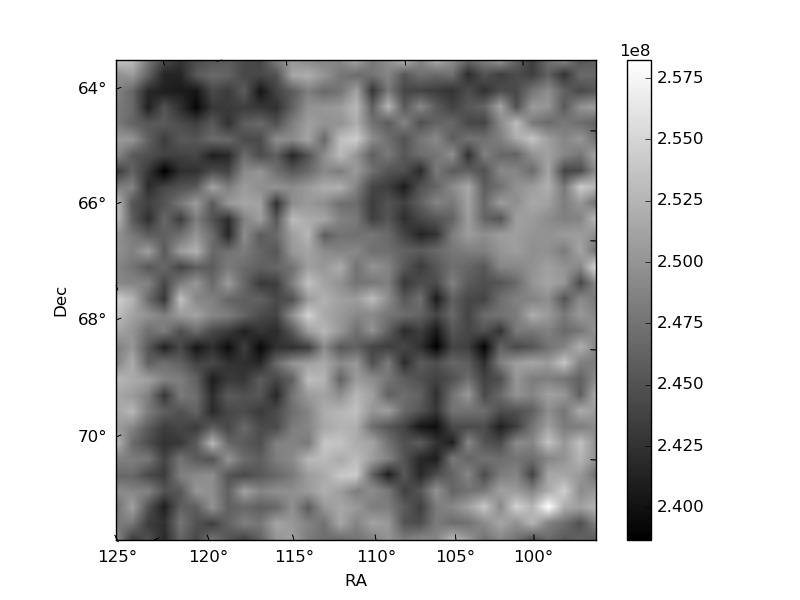
Histogram calculated using DETX and DETY for each event in the final _common_clean file
| Quadrant A |  |
 |
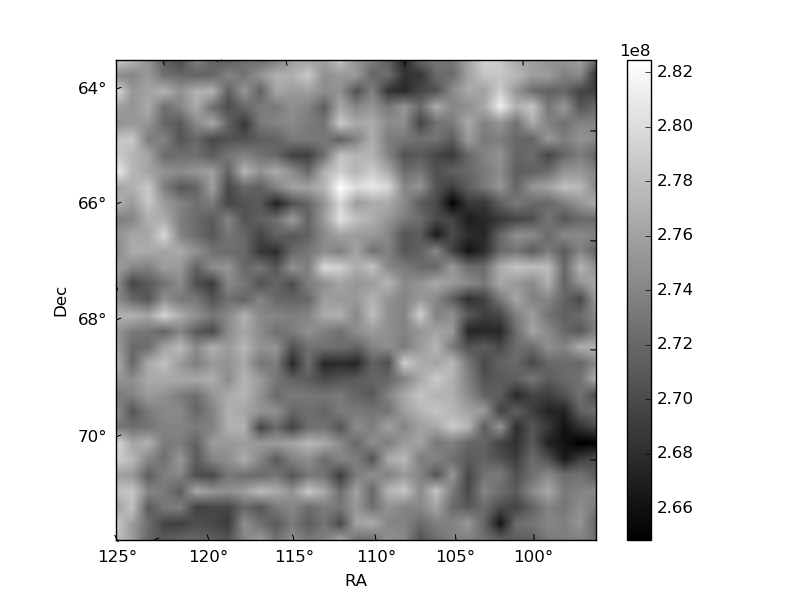
Quadrant B |
|---|---|---|---|
| Quadrant D | 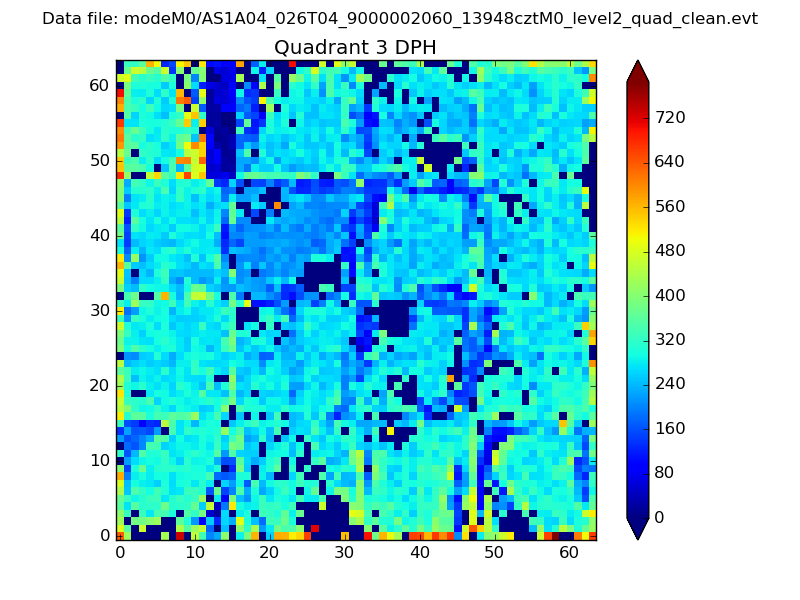 |
 |
Quadrant C |
| Plot type | Count rate plots | Images |
|---|---|---|
| Comparison with Poisson distribution Blue bars denote a histogram of data divided into 1 sec bins. Red curve is a Poisson curve with rate = median count rate of data. |
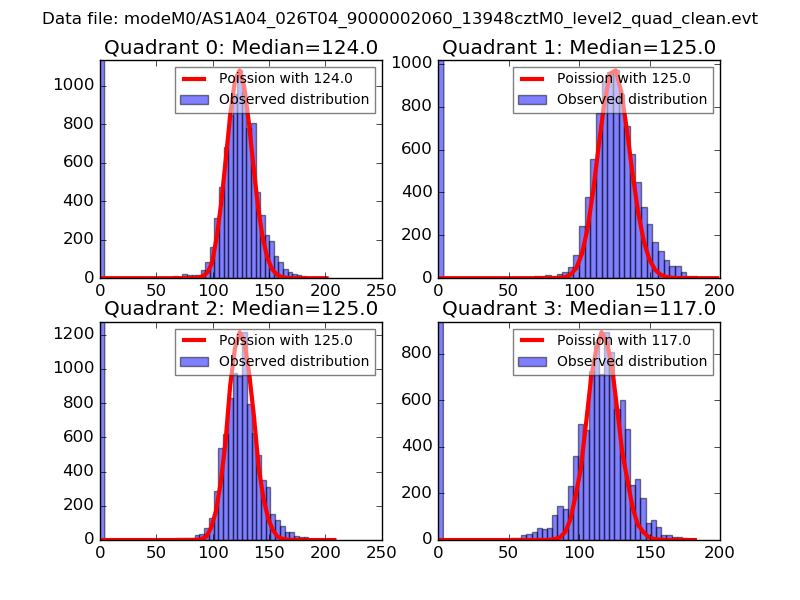 |
 |
| Quadrant-wise count rates Data is divided into 100 sec bins |
 |
|
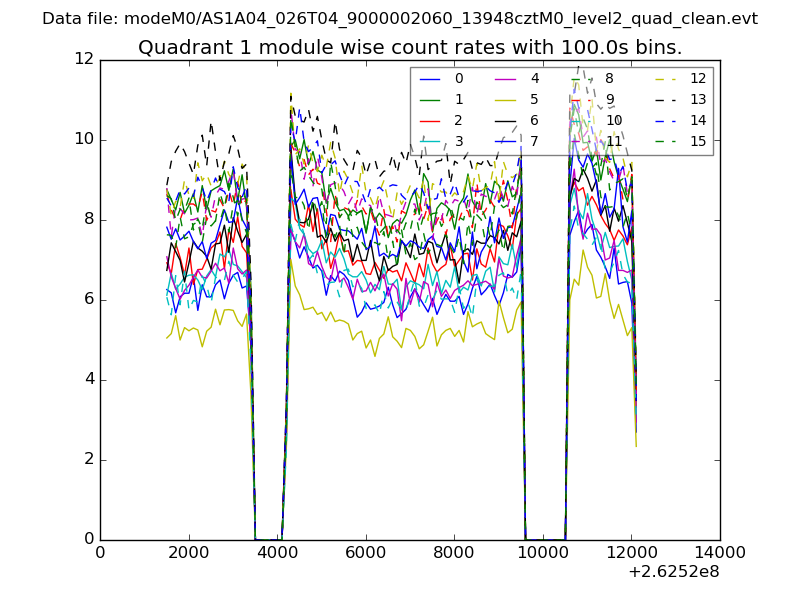
| Module-wise count rates for Quadrant A Data is divided into 100 sec bins |
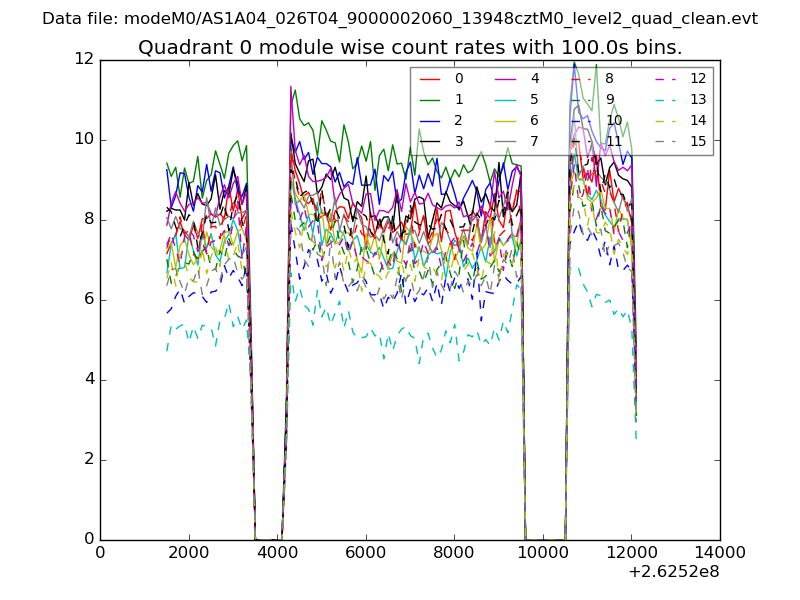 |
 |
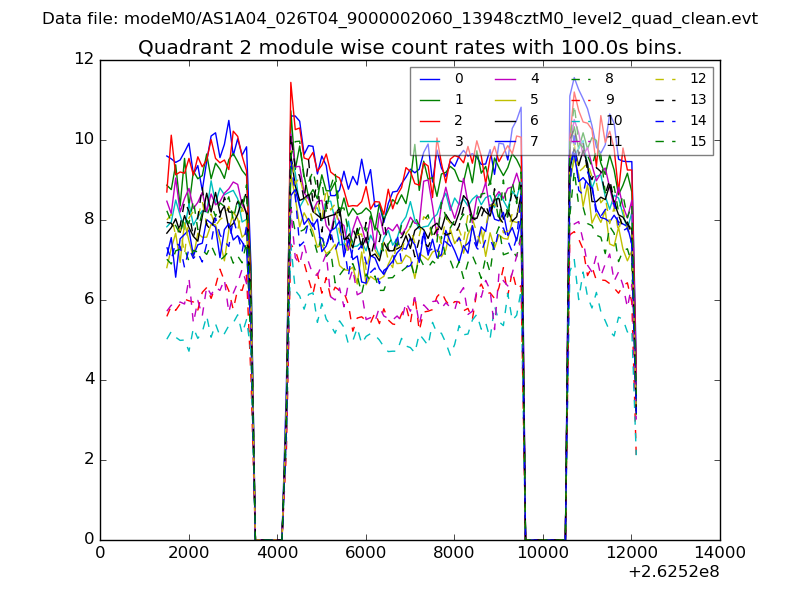
| Module-wise count rates for Quadrant B Data is divided into 100 sec bins |
 |
 |
| Module-wise count rates for Quadrant C Data is divided into 100 sec bins |
 |
 |
| Module-wise count rates for Quadrant D Data is divided into 100 sec bins |
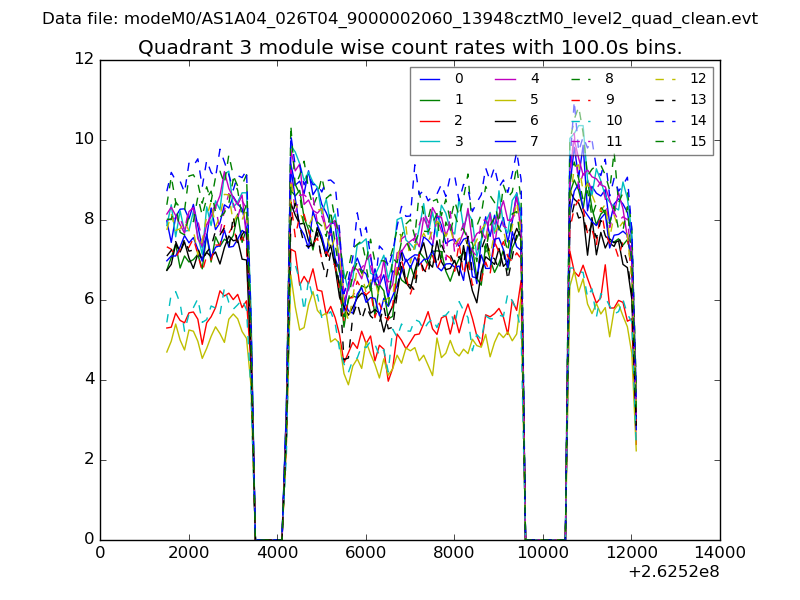 |
 |
| Parameter | Plot |
|---|---|
| CZT HV Monitor | 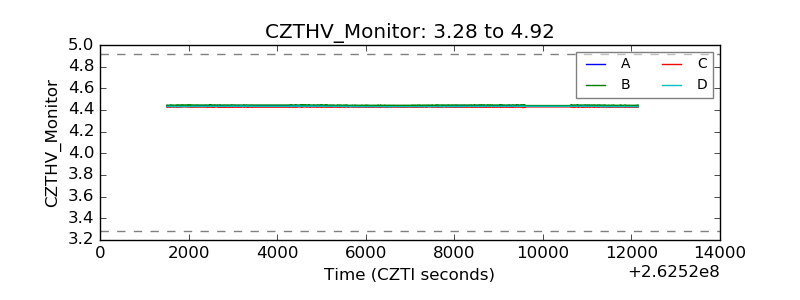 |
| D_VDD | 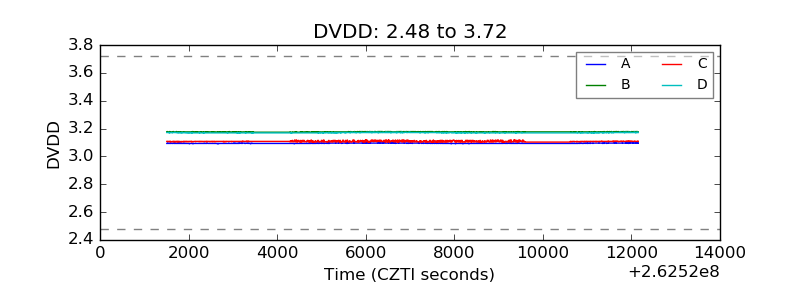 |
| Temperature 1 | 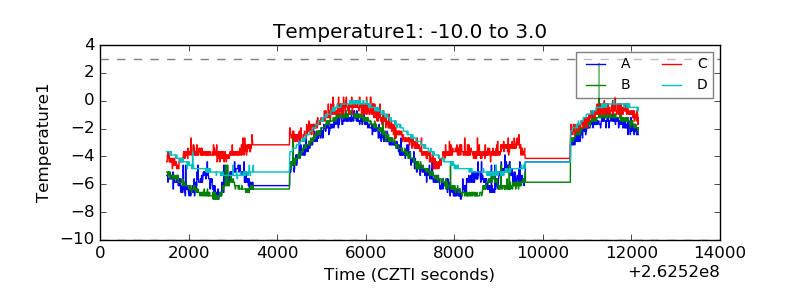 |
| Veto HV Monitor | 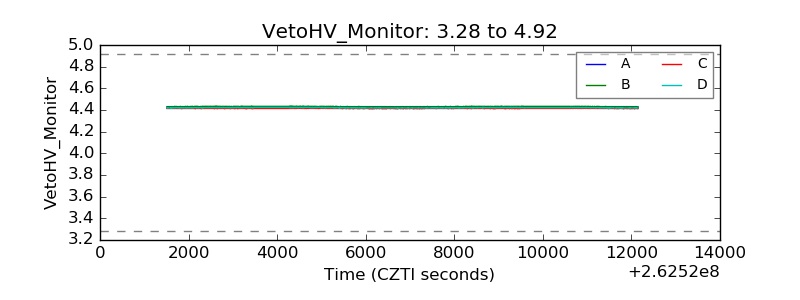 |
| Veto LLD | 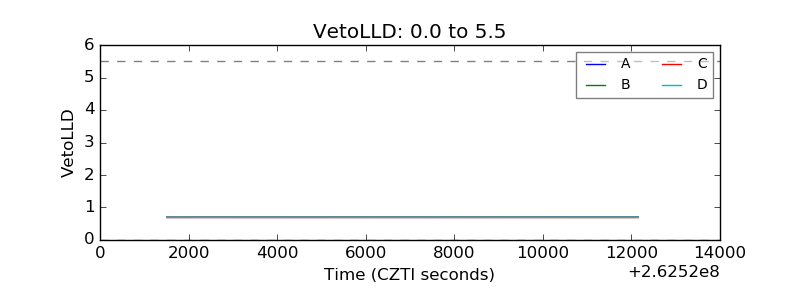 |
| Alpha Counter | 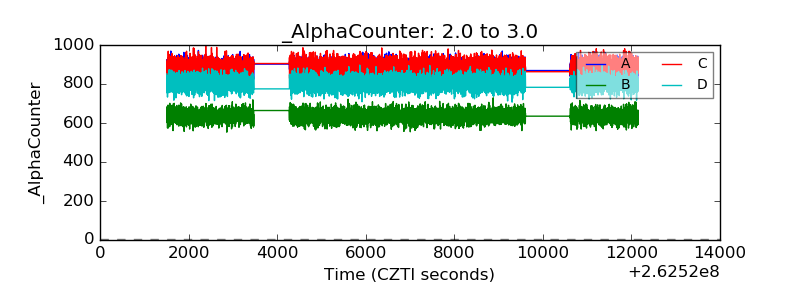 |
| _CPM_Rate | 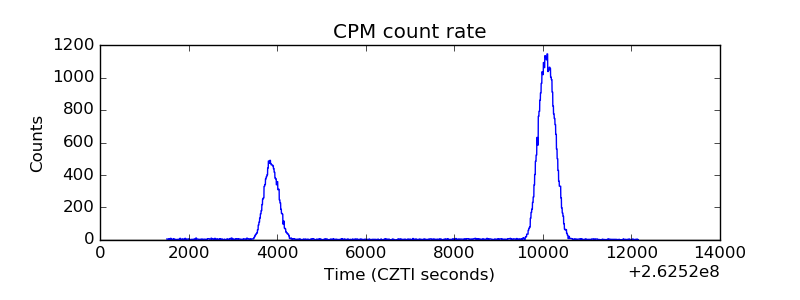 |
| CZT Counter | 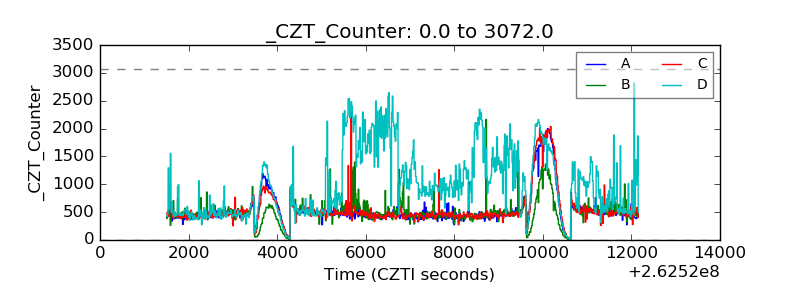 |
| +2.5 Volts monitor |  |
| +5 Volts monitor |  |
| _ROLL_ROT | 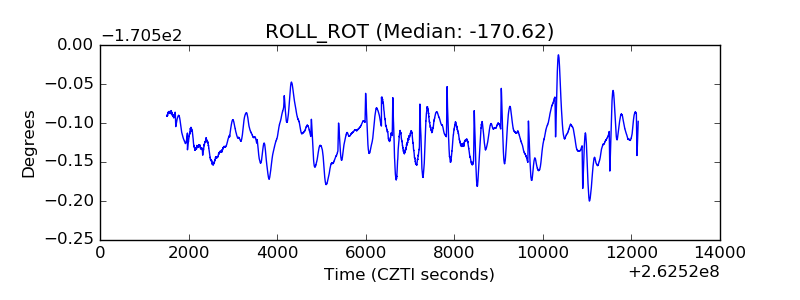 |
| _Roll_DEC | 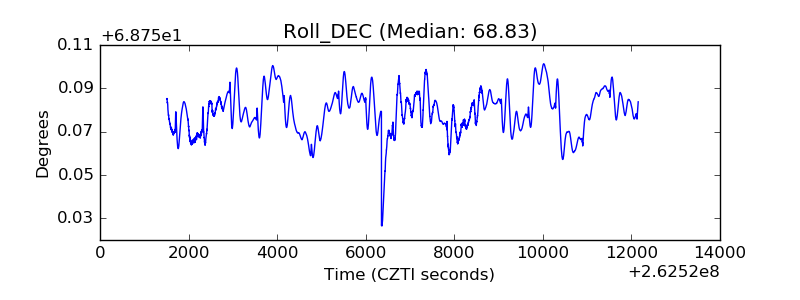 |
| _Roll_RA | 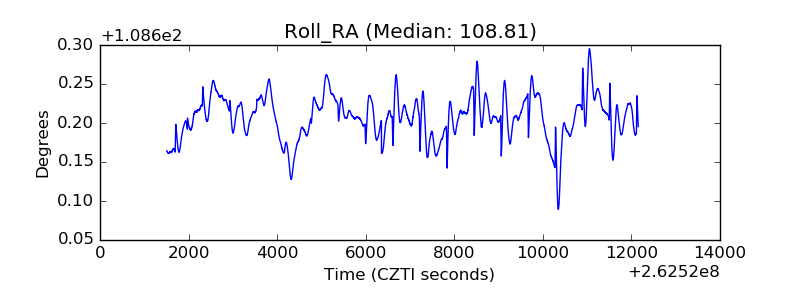 |
| Veto Counter | 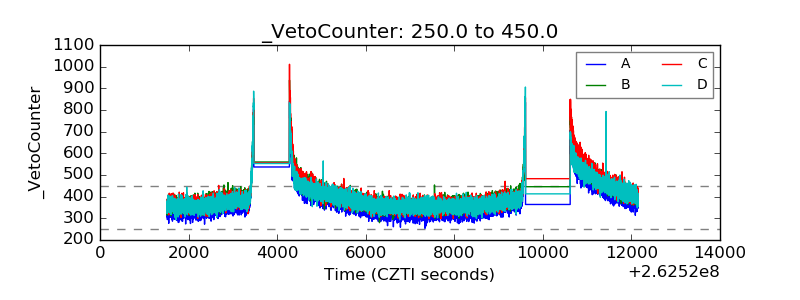 |