| Param | Original file | Final file |
|---|---|---|
| Filename | modeM0/AS1A04_026T04_9000002060_13951cztM0_level2.evt | modeM0/AS1A04_026T04_9000002060_13951cztM0_level2_quad_clean.evt |
| Size (bytes) | 194,736,960 | 47,784,960 |
| Size | 185.7 MB | 45.6 MB |
| Events in quadrant A | 1,167,569 | 322,902 |
| Events in quadrant B | 1,312,271 | 324,594 |
| Events in quadrant C | 1,156,245 | 325,518 |
| Events in quadrant D | 2,096,072 | 300,811 |
| Mode SS | |||
|---|---|---|---|
| Quadrant | BADHDUFLAG | Total packets | Discarded packets |
| A | 0 | 48 | 0 |
| B | 0 | 48 | 0 |
| C | 0 | 48 | 0 |
| D | 0 | 48 | 0 |
| Mode M0 | |||
|---|---|---|---|
| Quadrant | BADHDUFLAG | Total packets | Discarded packets |
| A | 0 | 5055 | 0 |
| B | 0 | 5538 | 0 |
| C | 0 | 4920 | 0 |
| D | 0 | 7810 | 0 |
| Quadrant | Total seconds | Saturated seconds | Saturation percentage |
|---|---|---|---|
| A | 2404 | 5 | 0.207987% |
| B | 2404 | 11 | 0.457571% |
| C | 2404 | 1 | 0.041597% |
| D | 2404 | 161 | 6.697171% |
Noise dominated data is calculated using 1-second bins in cleaned event files. If a bin has >2000 counts, and if more than 50% of those come from <1% of pixels, then it is considered to be noise-dominated and hence unusable.
| Quadrant | # 1 sec bins | Bins with >0 counts | Bins with >2000 counts | High rate bins dominated by noise | Noise dominated (total time) | Noise dominated (detector-on time) | Marked lightcurve |
|---|---|---|---|---|---|---|---|
| A | 2405 | 2405 | 3 | 3 | 0.12% | 0.12% |  |
| B | 2405 | 2405 | 16 | 16 | 0.67% | 0.67% | 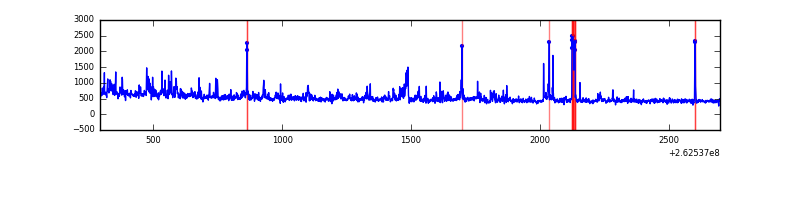 |
| C | 2405 | 2405 | 0 | 0 | 0.00% | 0.00% | 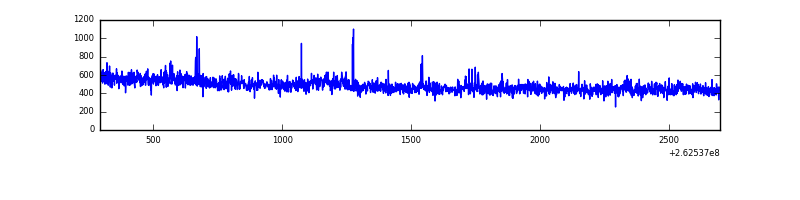 |
| D | 2405 | 2405 | 140 | 140 | 5.82% | 5.82% | 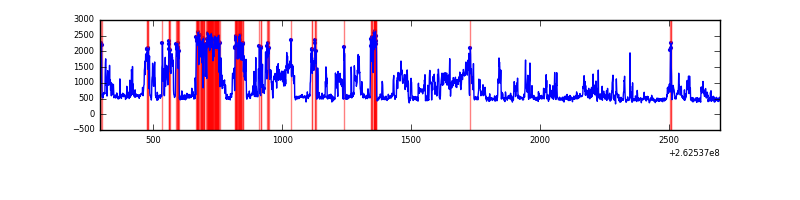 |
Top three noisy pixels from each quadrant. If the there are fewer than three noisy pixels in the level2.evt file, extra rows are filled as -1
| Pixel properties | Quadrant properties | ||||||
|---|---|---|---|---|---|---|---|
| Quadrant | DetID | PixID | Counts | Sigma | Mean | Median | Sigma |
| A | 12 | 96 | 34507 | 594.89 | 278 | 271 | 57.5 |
| A | 15 | 222 | 20575 | 352.8 | 278 | 271 | 57.5 |
| A | 1 | 162 | 17741 | 303.56 | 278 | 271 | 57.5 |
| B | 0 | 189 | 107338 | 2047.21 | 277 | 270 | 52.3 |
| B | 3 | 64 | 41443 | 787.26 | 277 | 270 | 52.3 |
| B | 0 | 219 | 25846 | 489.03 | 277 | 270 | 52.3 |
| C | 3 | 233 | 69634 | 1079.55 | 278 | 280 | 64.2 |
| C | 13 | 61 | 2028 | 27.21 | 278 | 280 | 64.2 |
| C | 0 | 207 | 1570 | 20.08 | 278 | 280 | 64.2 |
| D | 13 | 122 | 685680 | 10160.33 | 273 | 265 | 67.5 |
| D | 8 | 195 | 126472 | 1870.84 | 273 | 265 | 67.5 |
| D | 1 | 52 | 90541 | 1338.22 | 273 | 265 | 67.5 |
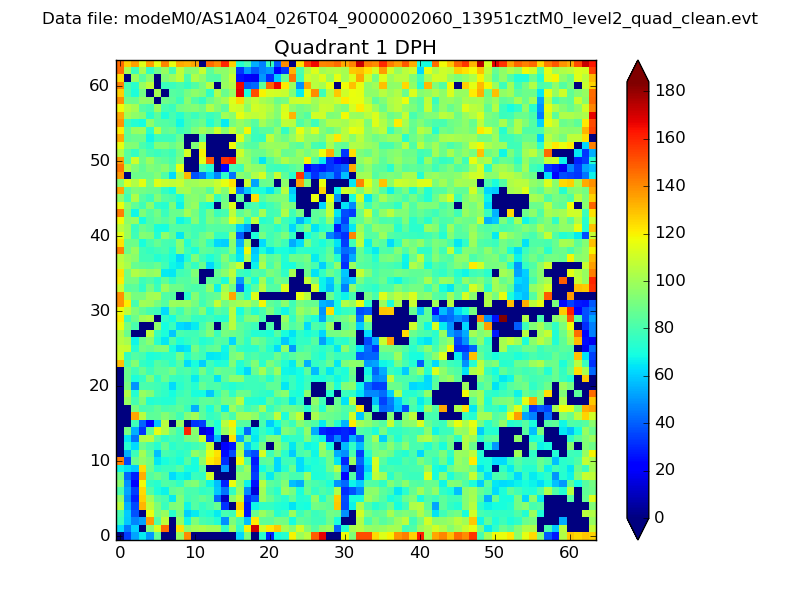
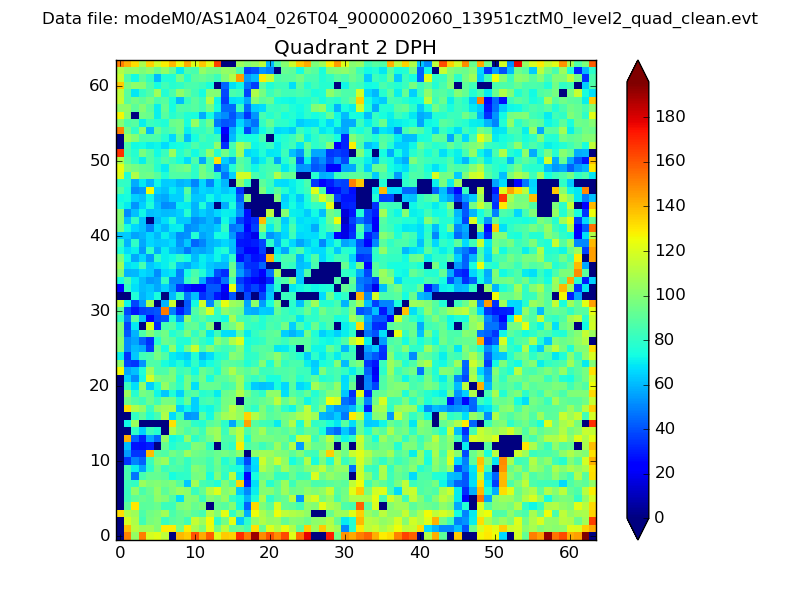
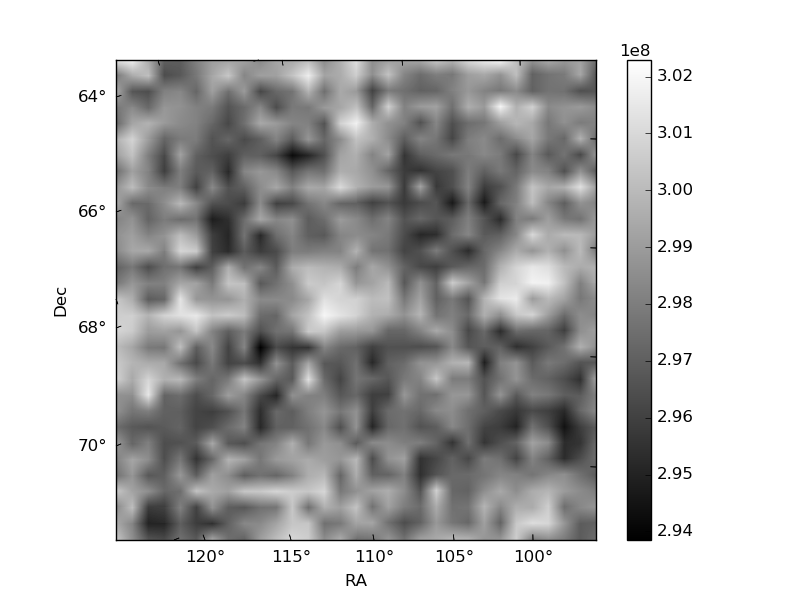
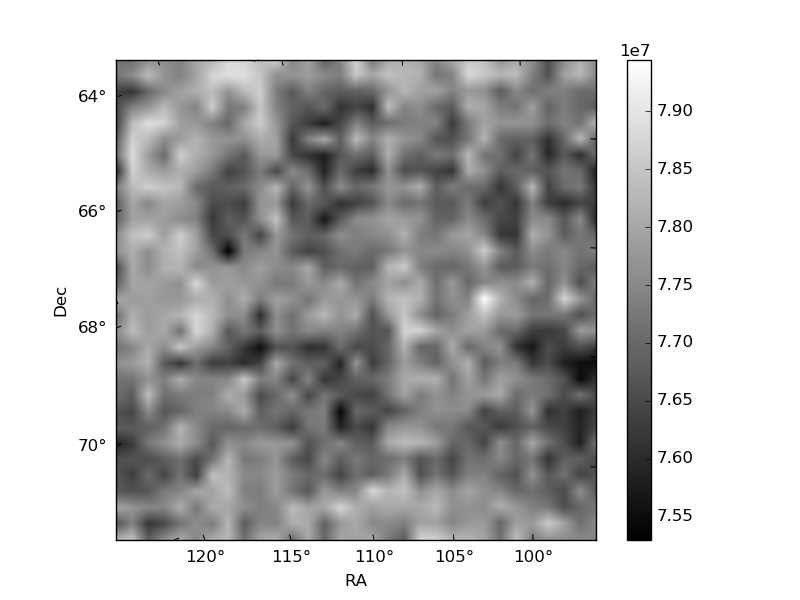
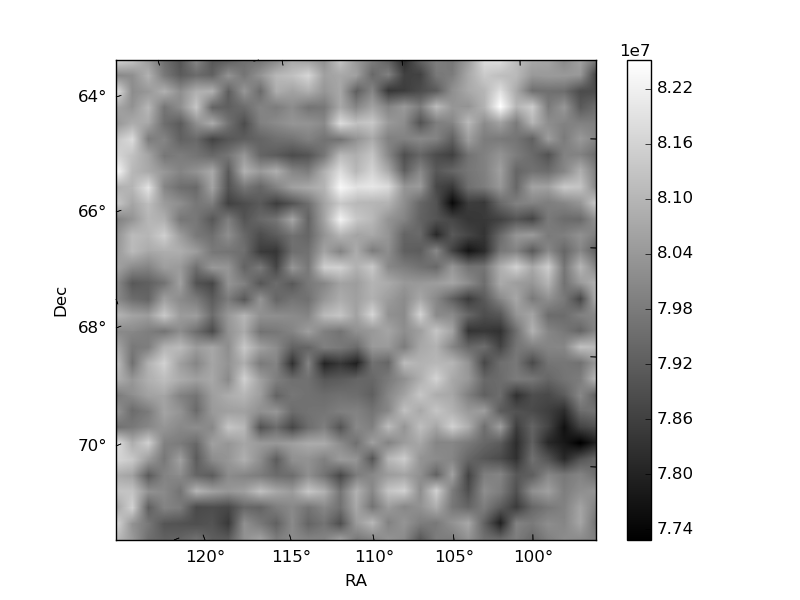
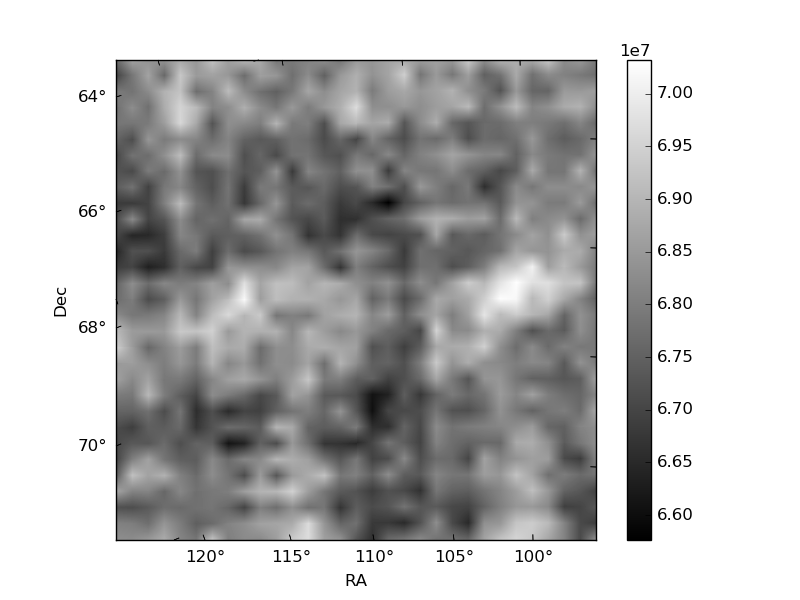
Histogram calculated using DETX and DETY for each event in the final _common_clean file
| Quadrant A | 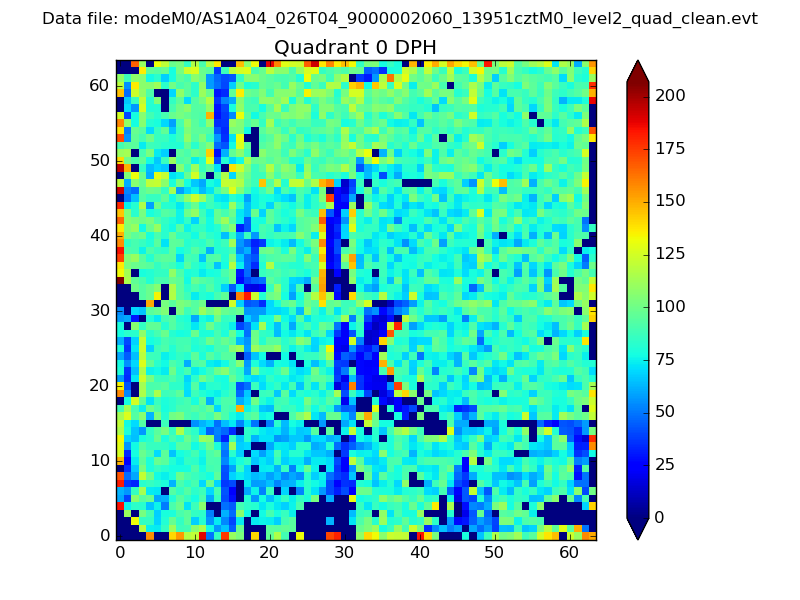 |
 |
Quadrant B |
|---|---|---|---|
| Quadrant D | 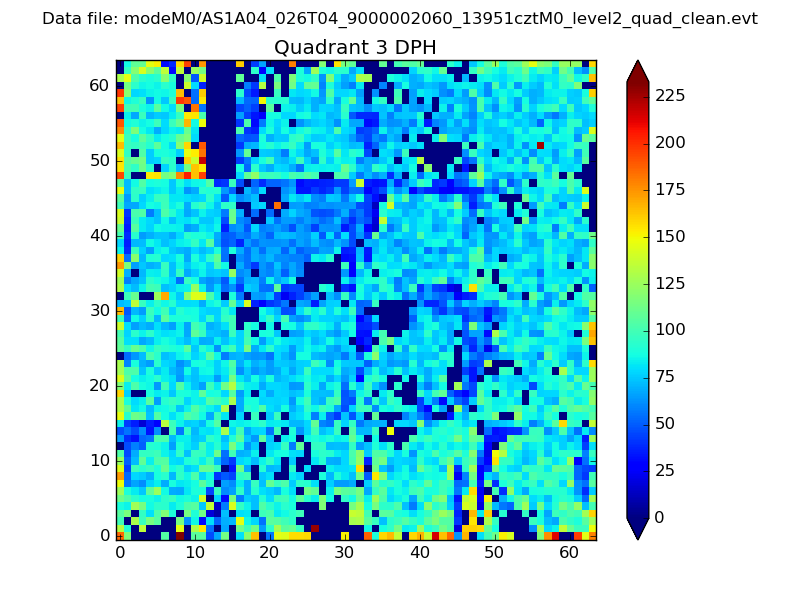 |
 |
Quadrant C |
| Plot type | Count rate plots | Images |
|---|---|---|
| Comparison with Poisson distribution Blue bars denote a histogram of data divided into 1 sec bins. Red curve is a Poisson curve with rate = median count rate of data. |
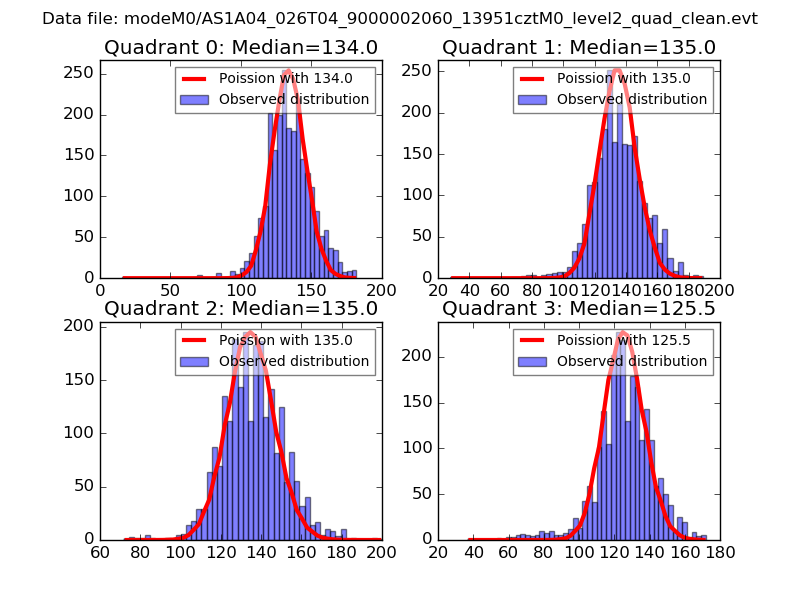 |
 |
| Quadrant-wise count rates Data is divided into 100 sec bins |
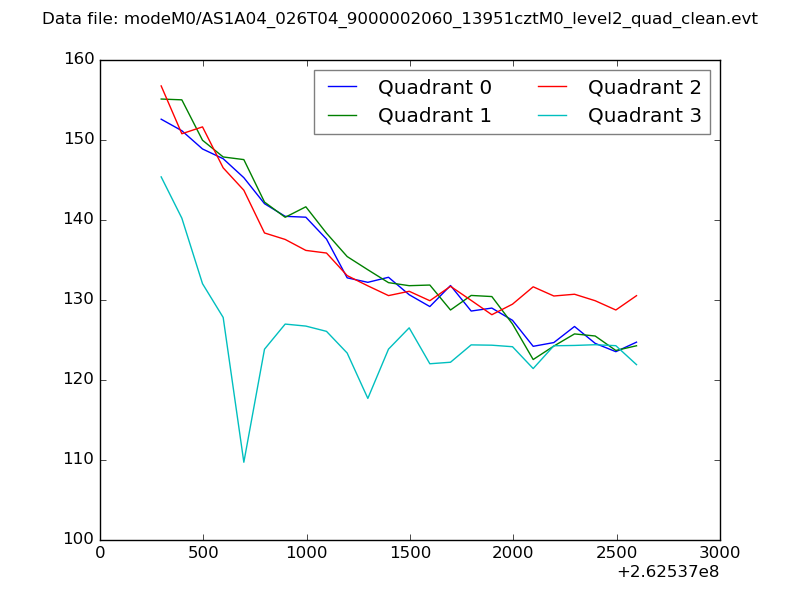 |
|
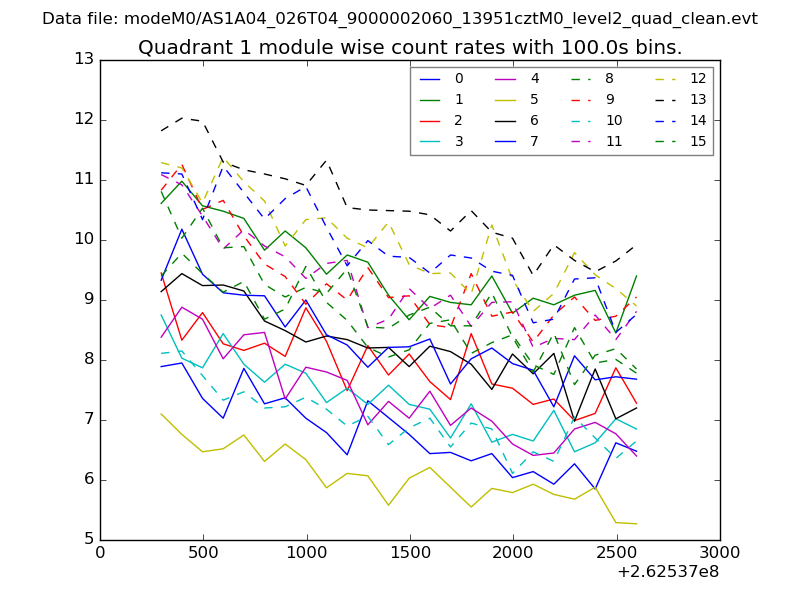
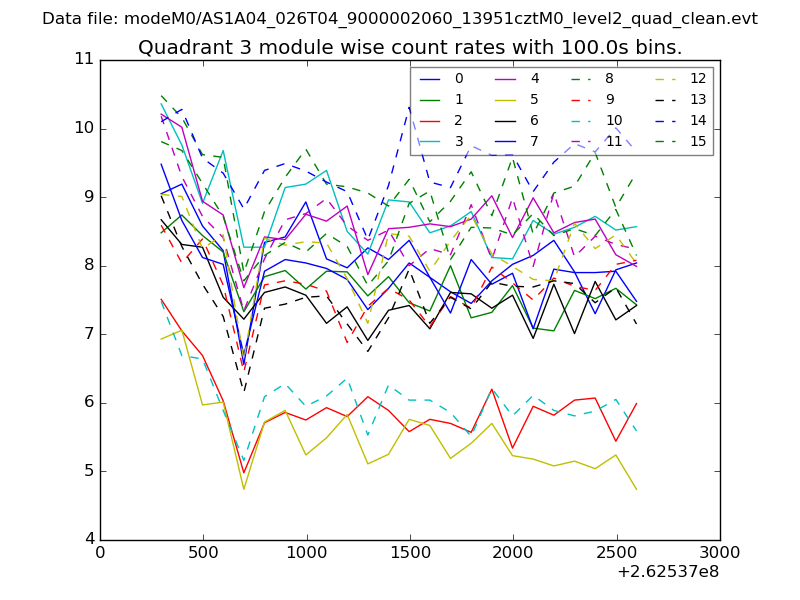
| Module-wise count rates for Quadrant A Data is divided into 100 sec bins |
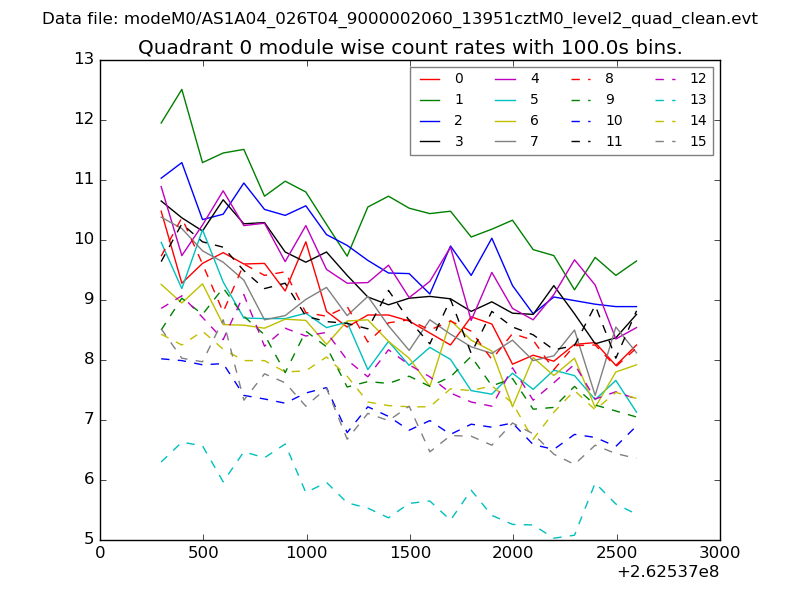 |
 |
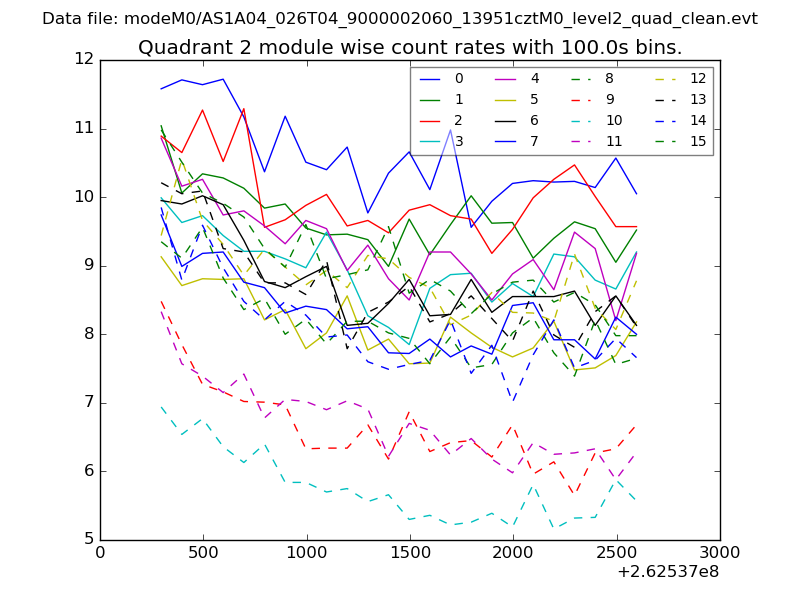
| Module-wise count rates for Quadrant B Data is divided into 100 sec bins |
 |
 |
| Module-wise count rates for Quadrant C Data is divided into 100 sec bins |
 |
 |
| Module-wise count rates for Quadrant D Data is divided into 100 sec bins |
 |
 |
| Parameter | Plot |
|---|---|
| CZT HV Monitor | 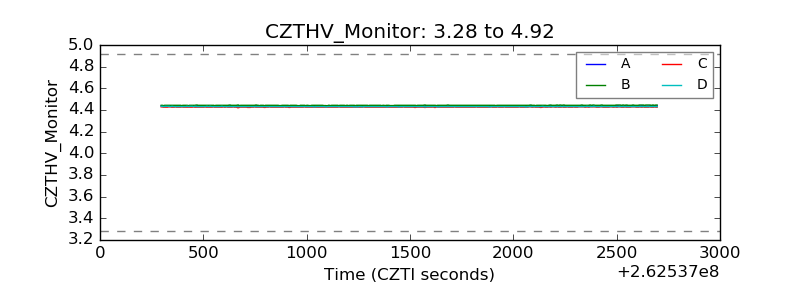 |
| D_VDD | 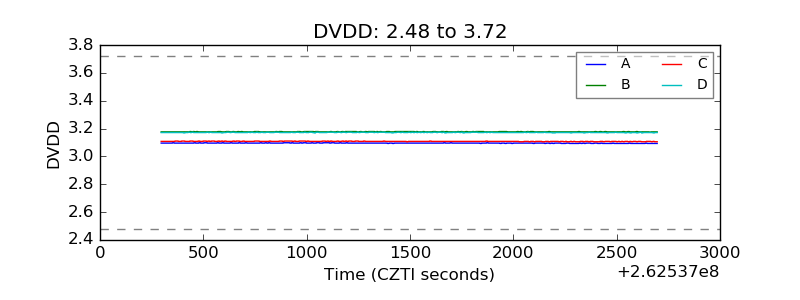 |
| Temperature 1 | 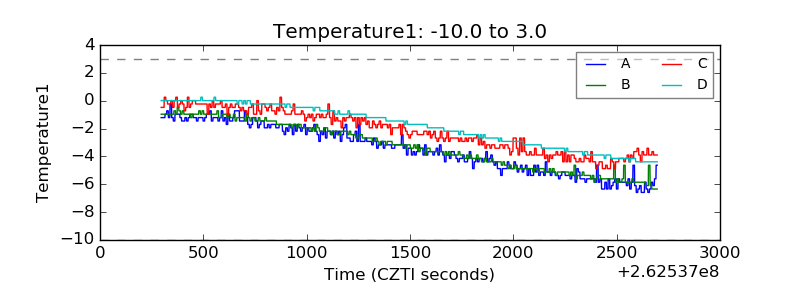 |
| Veto HV Monitor | 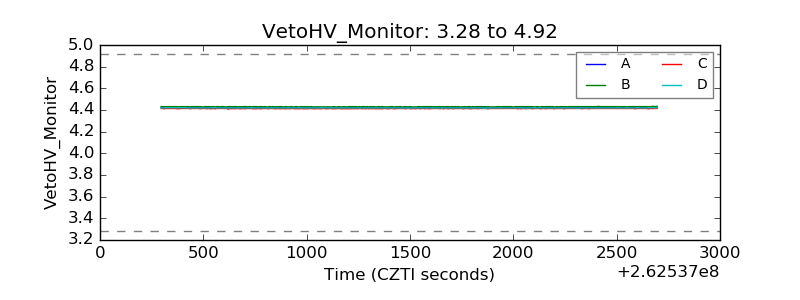 |
| Veto LLD | 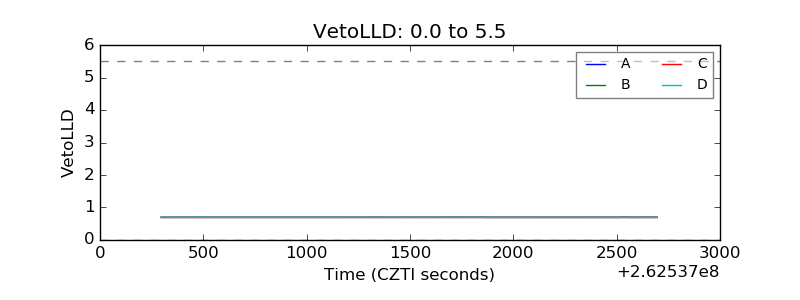 |
| Alpha Counter | 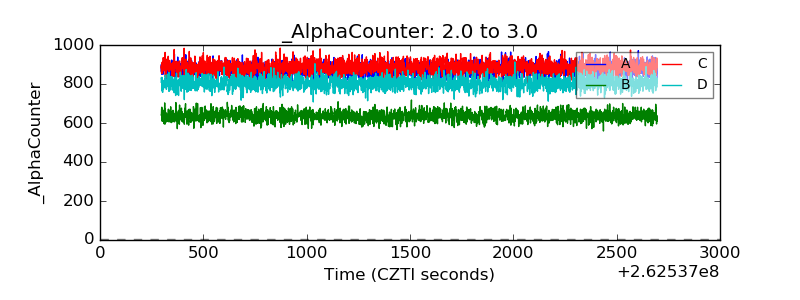 |
| _CPM_Rate | 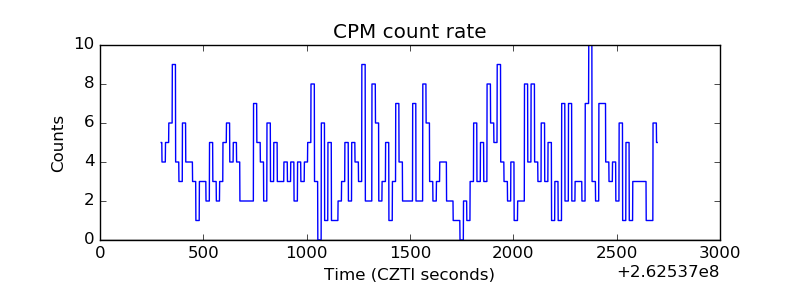 |
| CZT Counter | 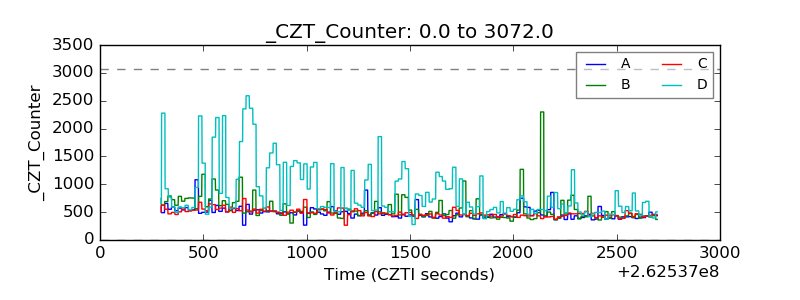 |
| +2.5 Volts monitor |  |
| +5 Volts monitor |  |
| _ROLL_ROT | 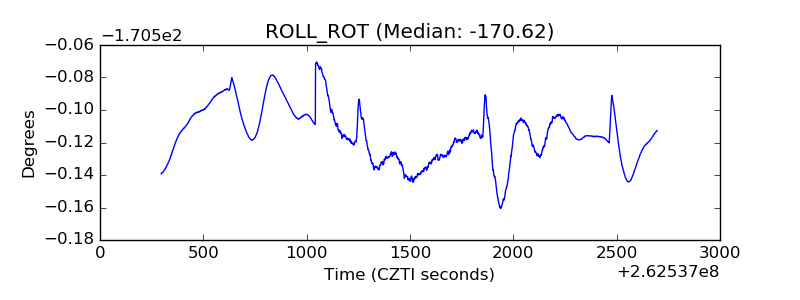 |
| _Roll_DEC | 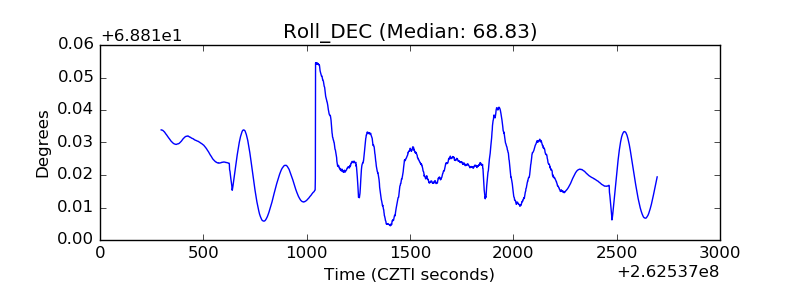 |
| _Roll_RA | 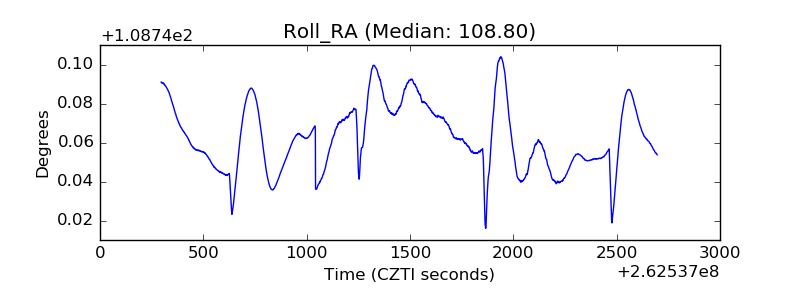 |
| Veto Counter | 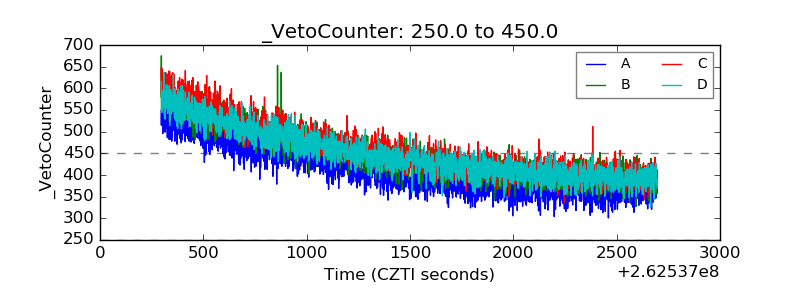 |