| Param | Original file | Final file |
|---|---|---|
| Filename | modeM0/AS1A04_225T01_9000002062cztM0_level2.fits | modeM0/AS1A04_225T01_9000002062cztM0_level2_quad_clean.evt |
| Size (bytes) | 1,004,938,560 | 1,081,465,920 |
| Size | 958.4 MB | 1.0 GB |
| Events in quadrant A | 6,118,224 | 6,648,717 |
| Events in quadrant B | 5,972,516 | 6,856,631 |
| Events in quadrant C | 6,063,938 | 6,389,253 |
| Events in quadrant D | 5,111,766 | 5,693,480 |
| Mode SS | |||
|---|---|---|---|
| Quadrant | BADHDUFLAG | Total packets | Discarded packets |
| A | 0 | 2130 | 0 |
| B | 0 | 2130 | 0 |
| C | 0 | 2130 | 0 |
| D | 0 | 2130 | 0 |
| Mode M0 | |||
|---|---|---|---|
| Quadrant | BADHDUFLAG | Total packets | Discarded packets |
| A | 0 | 227749 | 0 |
| B | 0 | 226561 | 0 |
| C | 0 | 217744 | 0 |
| D | 0 | 279693 | 0 |
| Mode M9 | |||
|---|---|---|---|
| Quadrant | BADHDUFLAG | Total packets | Discarded packets |
| A | 0 | 181 | 0 |
| B | 0 | 181 | 0 |
| C | 0 | 181 | 0 |
| D | 0 | 181 | 0 |
| Quadrant | Total seconds | Saturated seconds | Saturation percentage |
|---|---|---|---|
| A | 104554 | 2169 | 2.074526% |
| B | 104554 | 1845 | 1.764638% |
| C | 104554 | 948 | 0.906708% |
| D | 104554 | 3816 | 3.649789% |
Noise dominated data is calculated using 1-second bins in cleaned event files. If a bin has >2000 counts, and if more than 50% of those come from <1% of pixels, then it is considered to be noise-dominated and hence unusable.
| Quadrant | # 1 sec bins | Bins with >0 counts | Bins with >2000 counts | High rate bins dominated by noise | Noise dominated (total time) | Noise dominated (detector-on time) | Marked lightcurve |
|---|---|---|---|---|---|---|---|
| A | 122813 | 104544 | 0 | 0 | 0.00% | 0.00% |  |
| B | 122814 | 104550 | 0 | 0 | 0.00% | 0.00% |  |
| C | 122813 | 104552 | 0 | 0 | 0.00% | 0.00% | 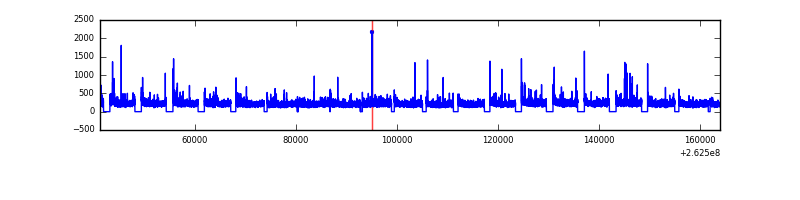 |
| D | 122813 | 104488 | 0 | 0 | 0.00% | 0.00% |  |
Top three noisy pixels from each quadrant. If the there are fewer than three noisy pixels in the level2.evt file, extra rows are filled as -1
| Pixel properties | Quadrant properties | ||||||
|---|---|---|---|---|---|---|---|
| Quadrant | DetID | PixID | Counts | Sigma | Mean | Median | Sigma |
| A | 0 | 29 | 5751 | 10.78 | 1594 | 1495 | 394.7 |
| A | 7 | 110 | 5113 | 9.17 | 1594 | 1495 | 394.7 |
| A | 9 | 19 | 4544 | 7.73 | 1594 | 1495 | 394.7 |
| B | 2 | 9 | 5135 | 11.81 | 1577 | 1506 | 307.4 |
| B | 3 | 17 | 3991 | 8.08 | 1577 | 1506 | 307.4 |
| B | 14 | 254 | 3965 | 8.0 | 1577 | 1506 | 307.4 |
| C | 1 | 80 | 4606 | 7.46 | 1603 | 1495 | 417.1 |
| C | 1 | 81 | 4596 | 7.43 | 1603 | 1495 | 417.1 |
| C | 12 | 241 | 4329 | 6.79 | 1603 | 1495 | 417.1 |
| D | 6 | 231 | 3700 | 6.08 | 1459 | 1326 | 390.2 |
| D | 6 | 67 | 3684 | 6.04 | 1459 | 1326 | 390.2 |
| D | 3 | 14 | 3678 | 6.03 | 1459 | 1326 | 390.2 |
Histogram calculated using DETX and DETY for each event in the final _common_clean file
| Quadrant A | 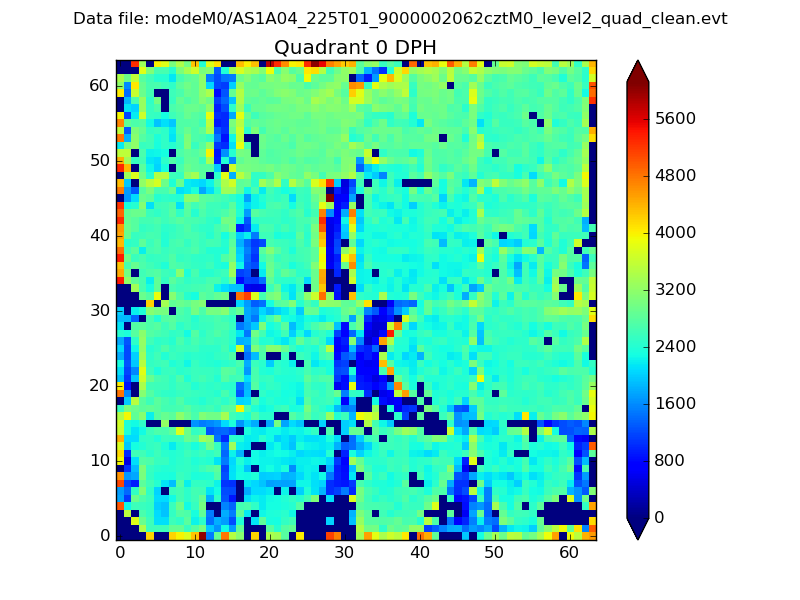 |
 |
Quadrant B |
|---|---|---|---|
| Quadrant D |  |
 |
Quadrant C |
| Plot type | Count rate plots | Images |
|---|---|---|
| Comparison with Poisson distribution Blue bars denote a histogram of data divided into 1 sec bins. Red curve is a Poisson curve with rate = median count rate of data. |
 |
 |
| Quadrant-wise count rates Data is divided into 100 sec bins |
 |
|
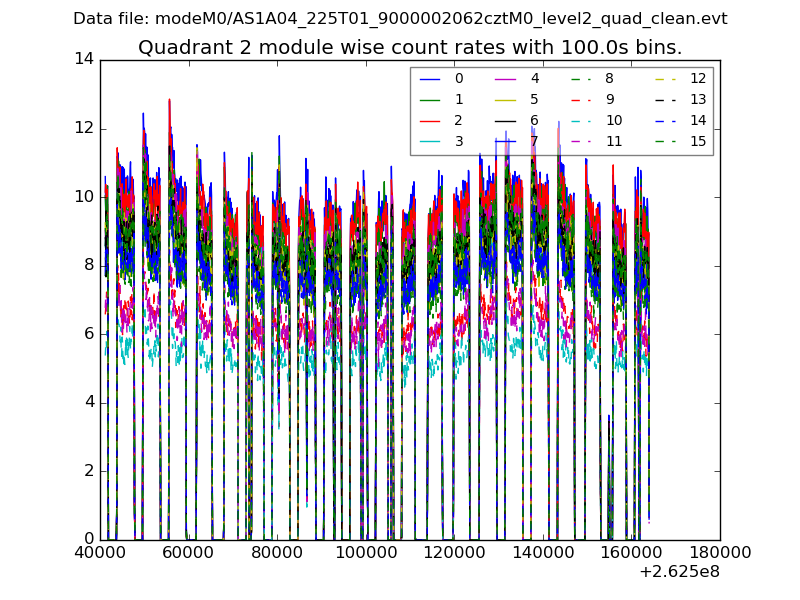
| Module-wise count rates for Quadrant A Data is divided into 100 sec bins |
 |
 |
| Module-wise count rates for Quadrant B Data is divided into 100 sec bins |
 |
 |
| Module-wise count rates for Quadrant C Data is divided into 100 sec bins |
 |
 |
| Module-wise count rates for Quadrant D Data is divided into 100 sec bins |
 |
 |
| Parameter | Plot |
|---|---|
| CZT HV Monitor |  |
| D_VDD | 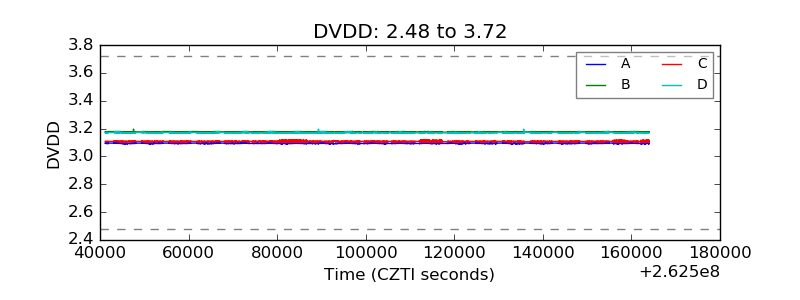 |
| Temperature 1 |  |
| Veto HV Monitor |  |
| Veto LLD |  |
| Alpha Counter | 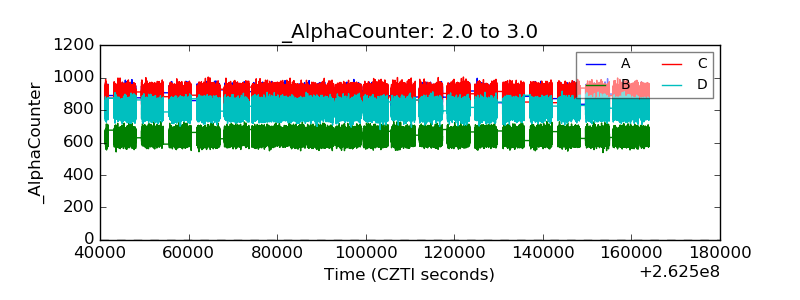 |
| _CPM_Rate |  |
| CZT Counter |  |
| +2.5 Volts monitor |  |
| +5 Volts monitor |  |
| _ROLL_ROT |  |
| _Roll_DEC | 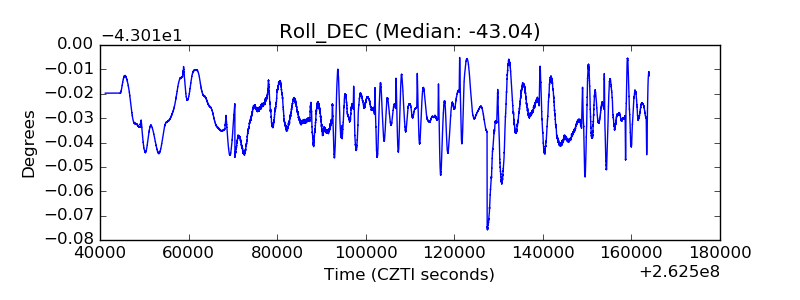 |
| _Roll_RA | 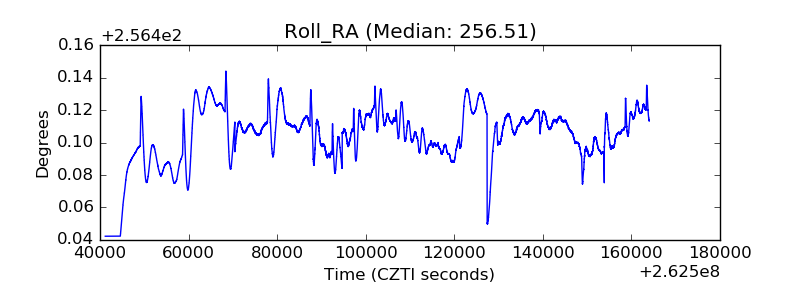 |
| Veto Counter |  |