| Param | Original file | Final file |
|---|---|---|
| Filename | modeM0/AS1A04_225T01_9000002062_13951cztM0_level2.evt | modeM0/AS1A04_225T01_9000002062_13951cztM0_level2_quad_clean.evt |
| Size (bytes) | 163,632,960 | 27,048,960 |
| Size | 156.1 MB | 25.8 MB |
| Events in quadrant A | 1,079,642 | 169,555 |
| Events in quadrant B | 1,160,521 | 175,355 |
| Events in quadrant C | 1,151,779 | 171,012 |
| Events in quadrant D | 1,430,249 | 161,900 |
| Mode SS | |||
|---|---|---|---|
| Quadrant | BADHDUFLAG | Total packets | Discarded packets |
| A | 0 | 40 | 0 |
| B | 0 | 40 | 0 |
| C | 0 | 40 | 0 |
| D | 0 | 40 | 0 |
| Mode M0 | |||
|---|---|---|---|
| Quadrant | BADHDUFLAG | Total packets | Discarded packets |
| A | 0 | 4427 | 2 |
| B | 0 | 4691 | 1 |
| C | 0 | 4750 | 1 |
| D | 0 | 5627 | 1 |
| Mode M9 | |||
|---|---|---|---|
| Quadrant | BADHDUFLAG | Total packets | Discarded packets |
| A | 0 | 13 | 0 |
| B | 0 | 13 | 0 |
| C | 0 | 13 | 0 |
| D | 0 | 13 | 0 |
| Quadrant | Total seconds | Saturated seconds | Saturation percentage |
|---|---|---|---|
| A | 1934 | 25 | 1.292658% |
| B | 1934 | 47 | 2.430196% |
| C | 1934 | 14 | 0.723888% |
| D | 1934 | 28 | 1.447777% |
Noise dominated data is calculated using 1-second bins in cleaned event files. If a bin has >2000 counts, and if more than 50% of those come from <1% of pixels, then it is considered to be noise-dominated and hence unusable.
| Quadrant | # 1 sec bins | Bins with >0 counts | Bins with >2000 counts | High rate bins dominated by noise | Noise dominated (total time) | Noise dominated (detector-on time) | Marked lightcurve |
|---|---|---|---|---|---|---|---|
| A | 3205 | 1936 | 1 | 1 | 0.03% | 0.05% | 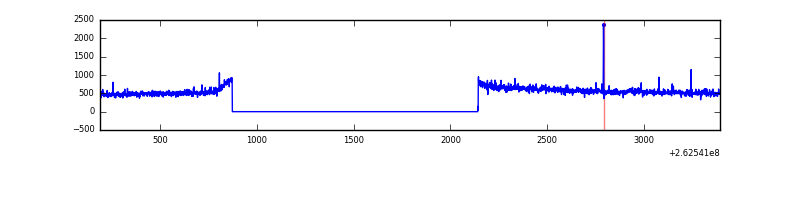 |
| B | 3205 | 1936 | 8 | 8 | 0.25% | 0.41% | 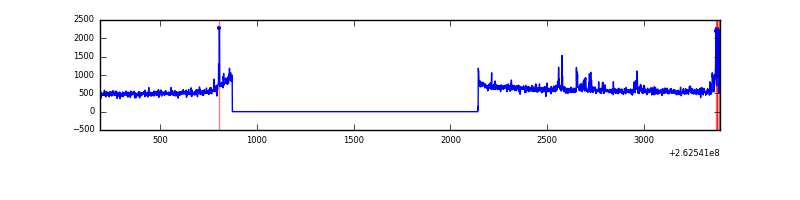 |
| C | 3205 | 1936 | 1 | 1 | 0.03% | 0.05% | 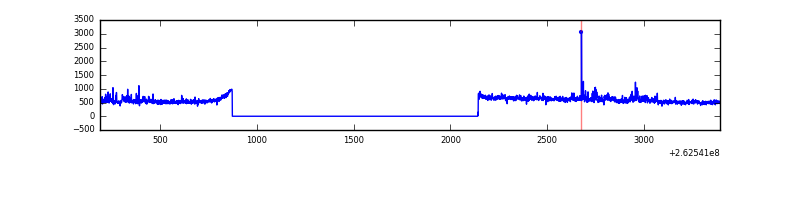 |
| D | 3205 | 1936 | 11 | 11 | 0.34% | 0.57% | 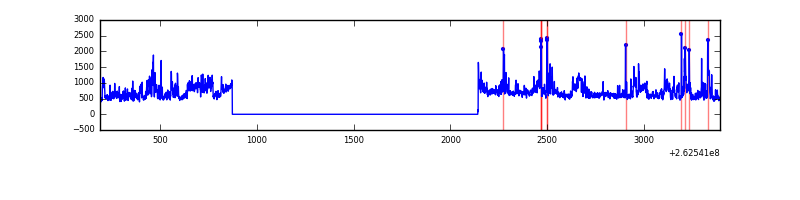 |
Top three noisy pixels from each quadrant. If the there are fewer than three noisy pixels in the level2.evt file, extra rows are filled as -1
| Pixel properties | Quadrant properties | ||||||
|---|---|---|---|---|---|---|---|
| Quadrant | DetID | PixID | Counts | Sigma | Mean | Median | Sigma |
| A | 1 | 162 | 9156 | 156.99 | 273 | 268 | 56.6 |
| A | 9 | 143 | 5040 | 84.29 | 273 | 268 | 56.6 |
| A | 1 | 178 | 3276 | 53.13 | 273 | 268 | 56.6 |
| B | 0 | 219 | 40060 | 754.94 | 274 | 269 | 52.7 |
| B | 0 | 190 | 12424 | 230.61 | 274 | 269 | 52.7 |
| B | 0 | 189 | 10223 | 188.85 | 274 | 269 | 52.7 |
| C | 3 | 233 | 126123 | 2048.66 | 262 | 264 | 61.4 |
| C | 13 | 61 | 1957 | 27.56 | 262 | 264 | 61.4 |
| C | 0 | 207 | 1237 | 15.84 | 262 | 264 | 61.4 |
| D | 13 | 122 | 163633 | 2373.67 | 259 | 253 | 68.8 |
| D | 1 | 52 | 97116 | 1407.27 | 259 | 253 | 68.8 |
| D | 8 | 195 | 70537 | 1021.12 | 259 | 253 | 68.8 |
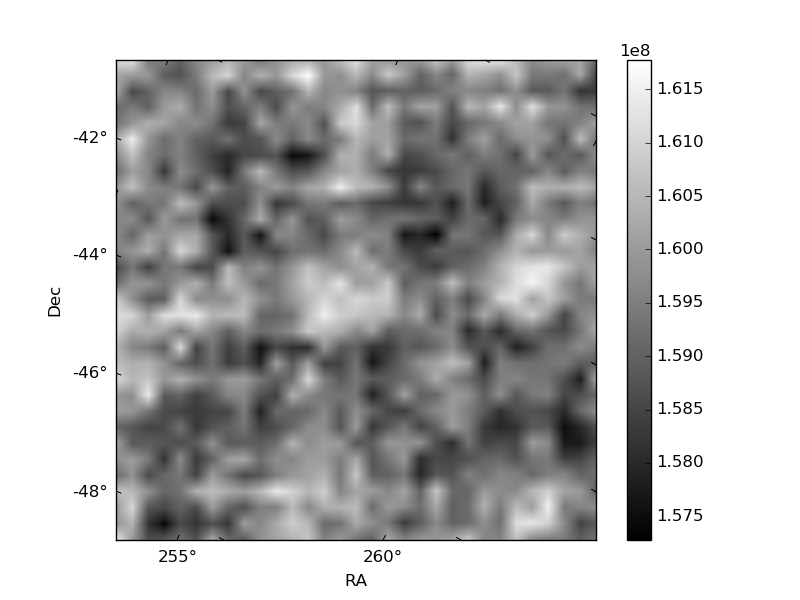
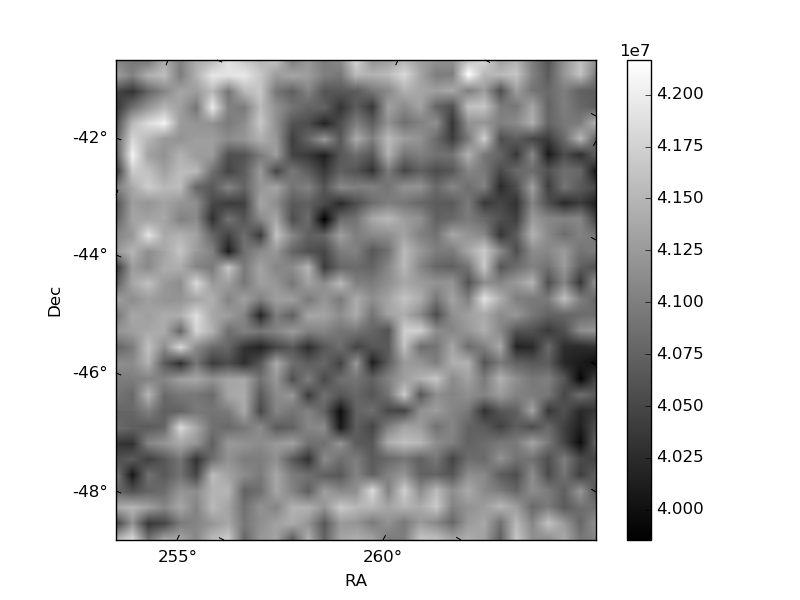
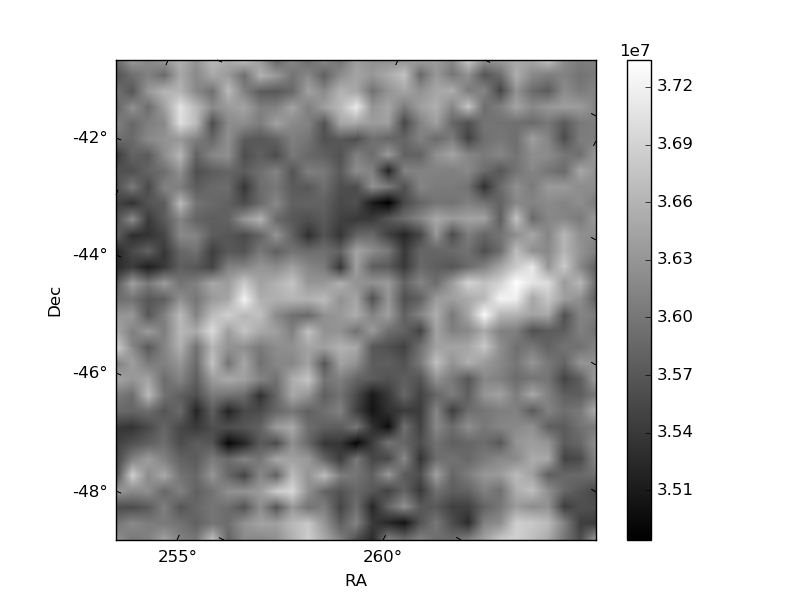
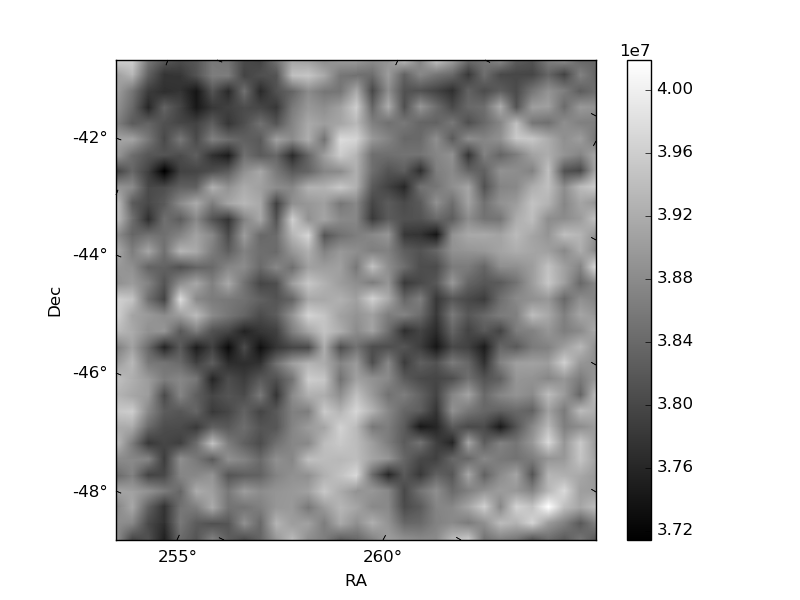
Histogram calculated using DETX and DETY for each event in the final _common_clean file
| Quadrant A | 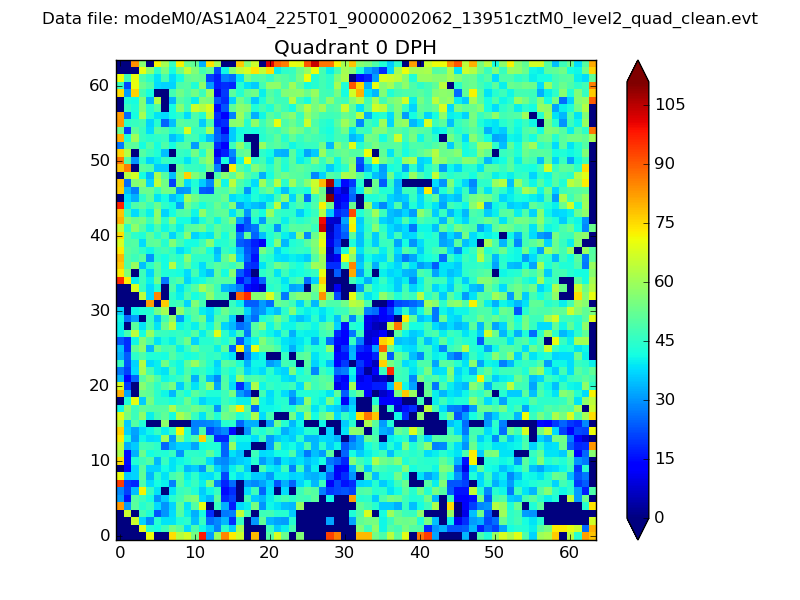 |
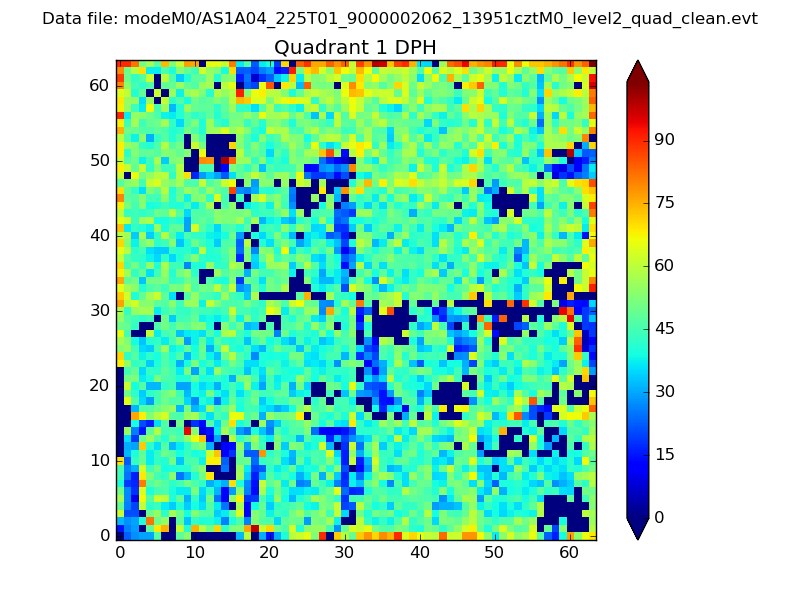 |
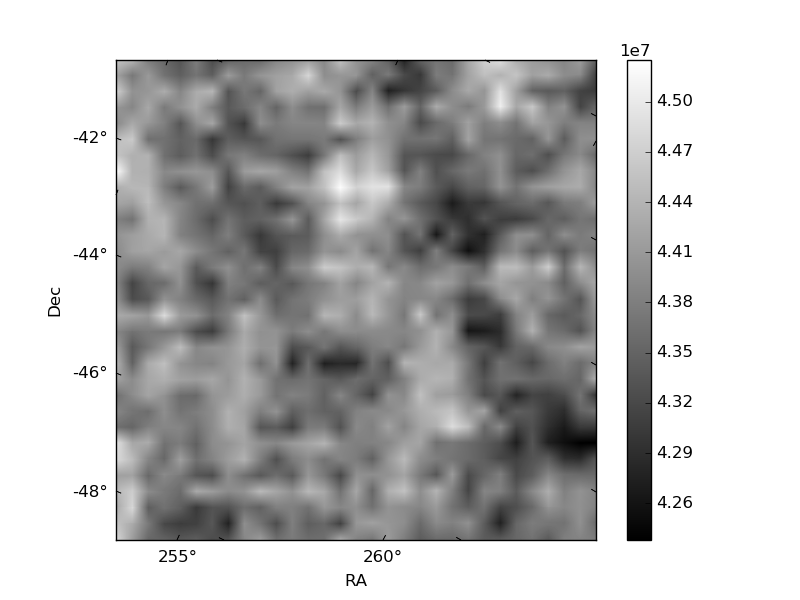
Quadrant B |
|---|---|---|---|
| Quadrant D | 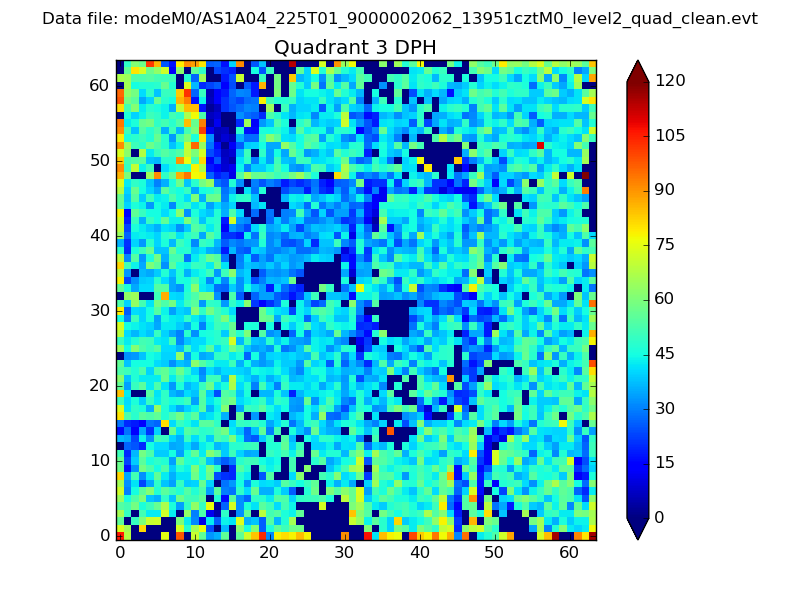 |
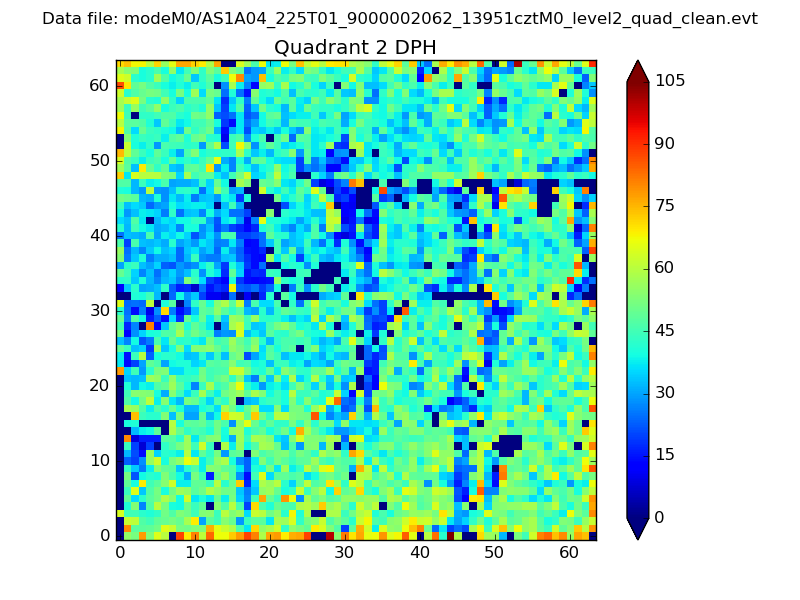 |
Quadrant C |
| Plot type | Count rate plots | Images |
|---|---|---|
| Comparison with Poisson distribution Blue bars denote a histogram of data divided into 1 sec bins. Red curve is a Poisson curve with rate = median count rate of data. |
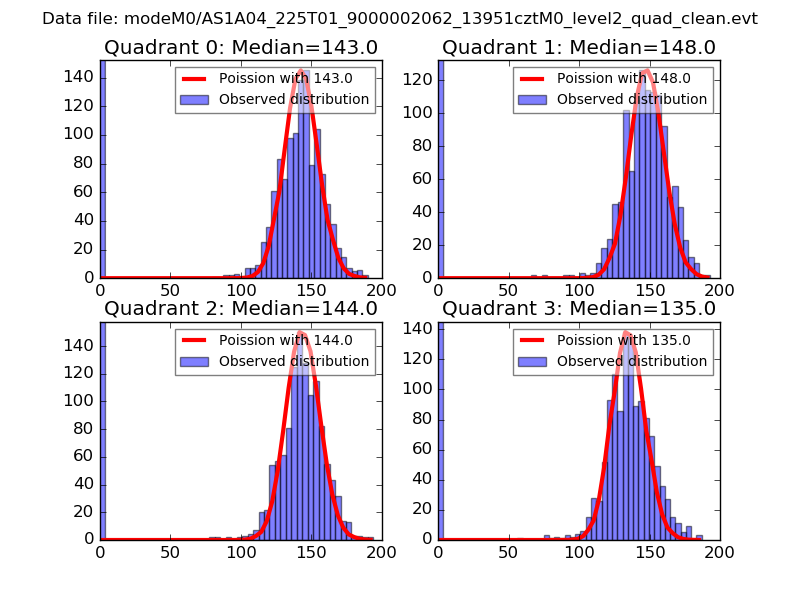 |
 |
| Quadrant-wise count rates Data is divided into 100 sec bins |
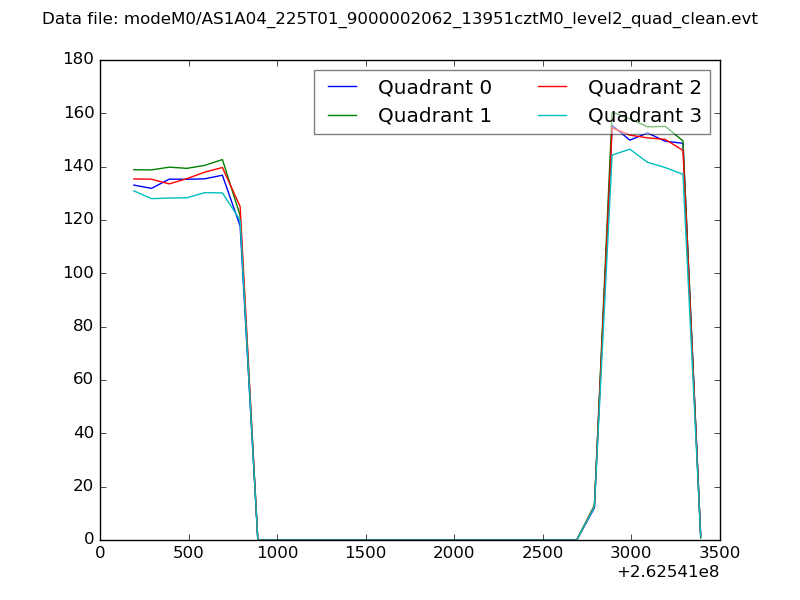 |
|
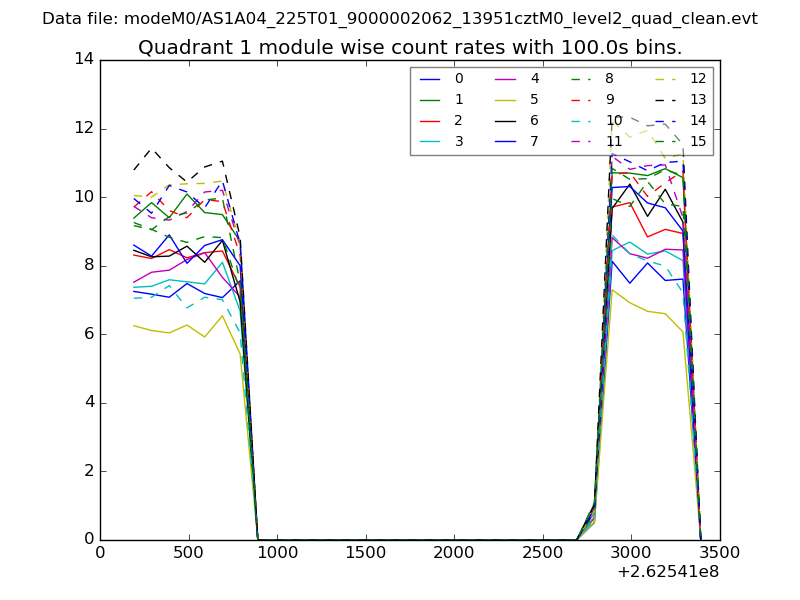
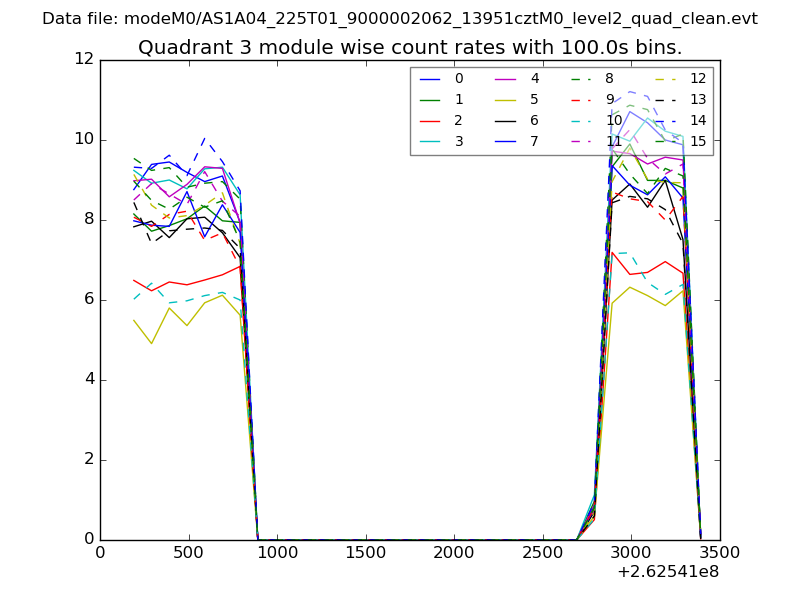
| Module-wise count rates for Quadrant A Data is divided into 100 sec bins |
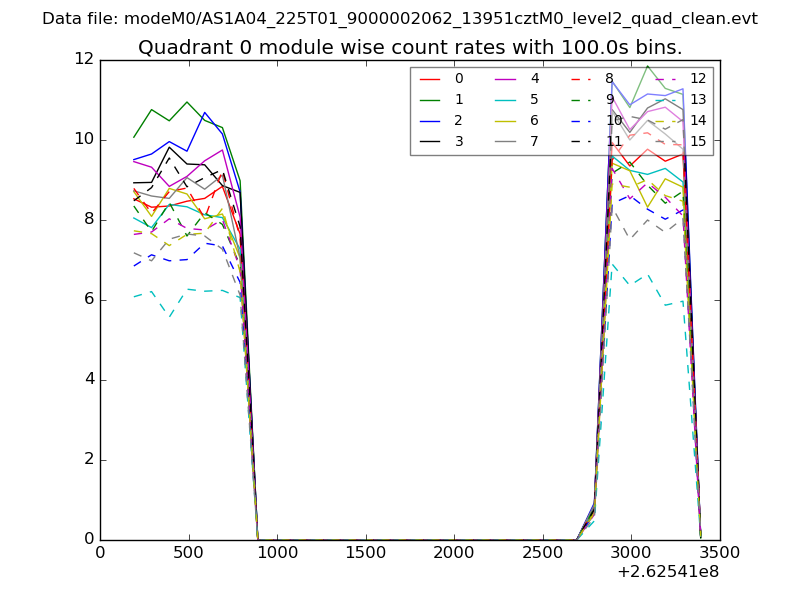 |
 |
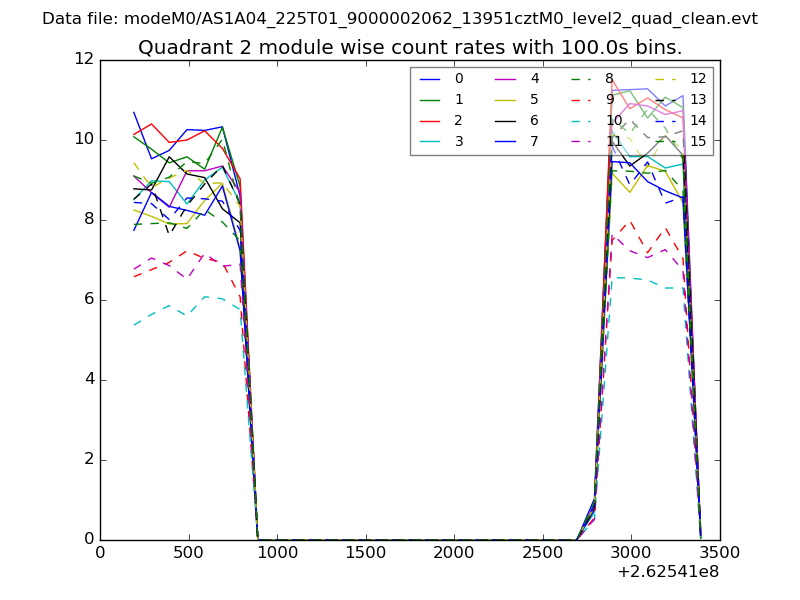
| Module-wise count rates for Quadrant B Data is divided into 100 sec bins |
 |
 |
| Module-wise count rates for Quadrant C Data is divided into 100 sec bins |
 |
 |
| Module-wise count rates for Quadrant D Data is divided into 100 sec bins |
 |
 |
| Parameter | Plot |
|---|---|
| CZT HV Monitor | 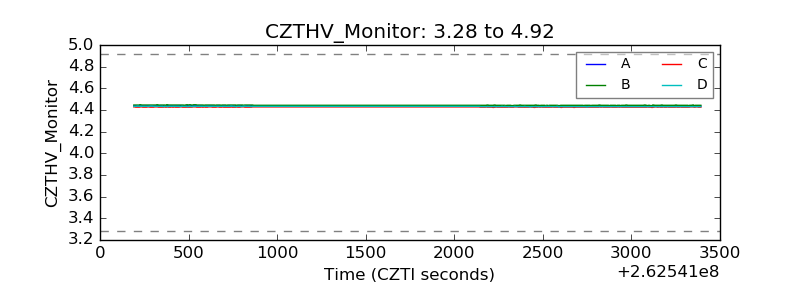 |
| D_VDD | 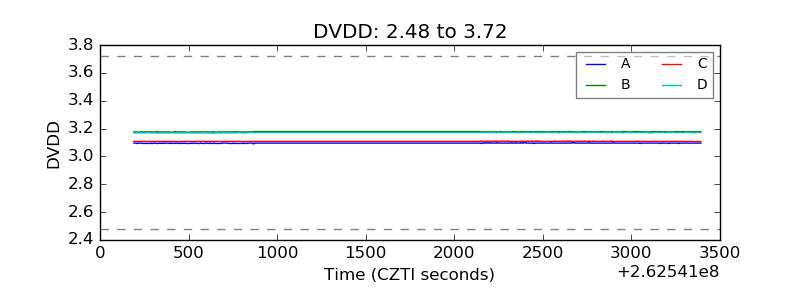 |
| Temperature 1 | 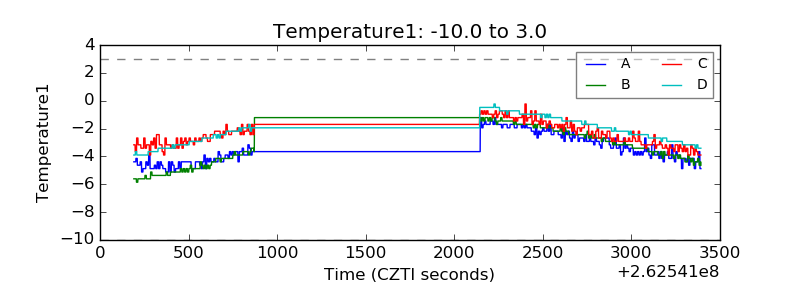 |
| Veto HV Monitor | 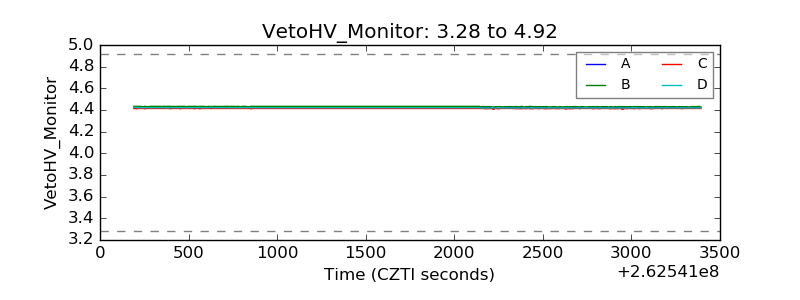 |
| Veto LLD | 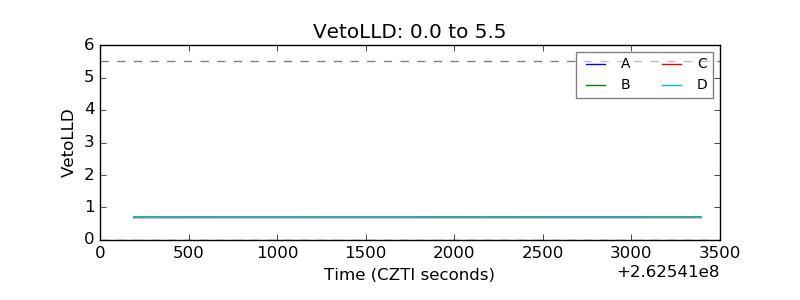 |
| Alpha Counter | 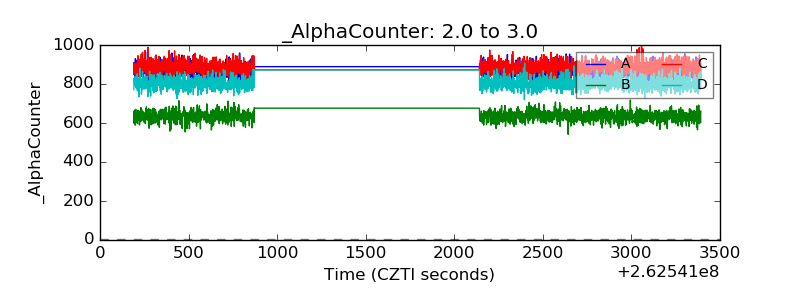 |
| _CPM_Rate | 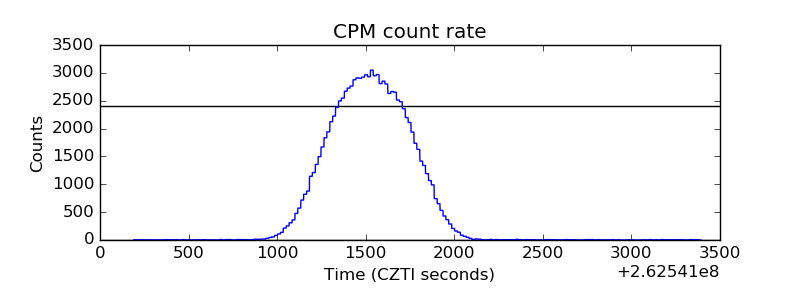 |
| CZT Counter | 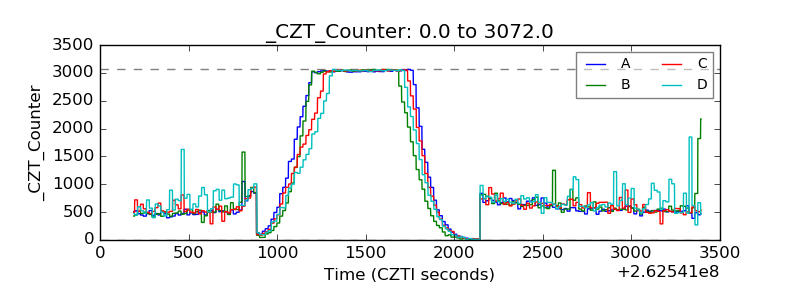 |
| +2.5 Volts monitor | 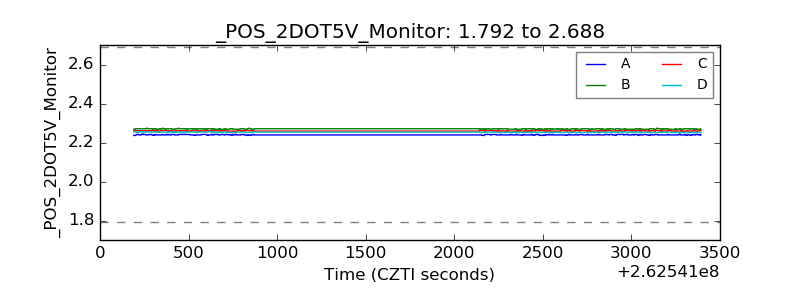 |
| +5 Volts monitor |  |
| _ROLL_ROT | 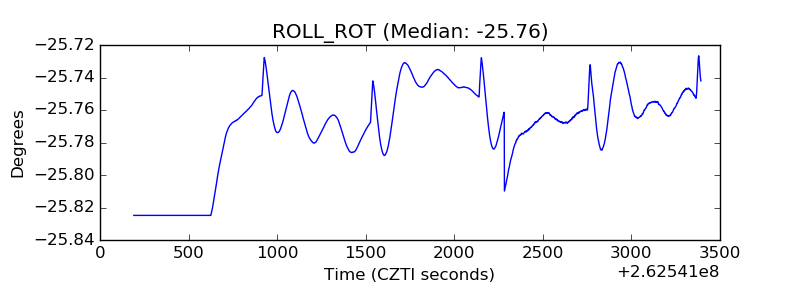 |
| _Roll_DEC | 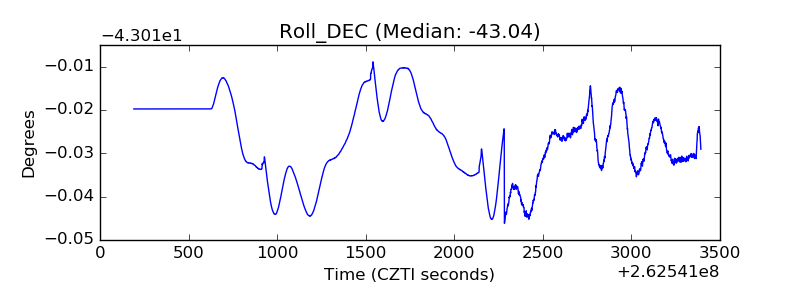 |
| _Roll_RA | 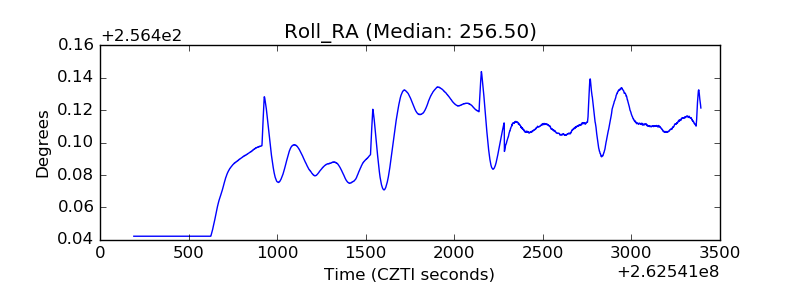 |
| Veto Counter | 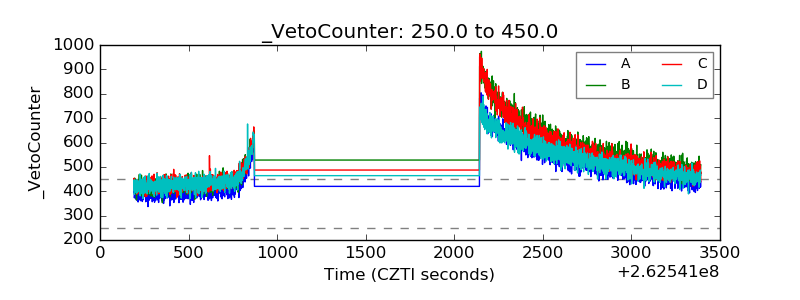 |