| Param | Original file | Final file |
|---|---|---|
| Filename | modeM0/AS1A04_225T01_9000002062_13954cztM0_level2.evt | modeM0/AS1A04_225T01_9000002062_13954cztM0_level2_quad_clean.evt |
| Size (bytes) | 541,653,120 | 114,955,200 |
| Size | 516.6 MB | 109.6 MB |
| Events in quadrant A | 3,470,309 | 746,871 |
| Events in quadrant B | 3,728,515 | 783,902 |
| Events in quadrant C | 3,627,146 | 755,403 |
| Events in quadrant D | 5,096,229 | 700,670 |
| Mode SS | |||
|---|---|---|---|
| Quadrant | BADHDUFLAG | Total packets | Discarded packets |
| A | 0 | 148 | 0 |
| B | 0 | 148 | 0 |
| C | 0 | 148 | 0 |
| D | 0 | 148 | 0 |
| Mode M0 | |||
|---|---|---|---|
| Quadrant | BADHDUFLAG | Total packets | Discarded packets |
| A | 0 | 14932 | 3 |
| B | 0 | 15627 | 2 |
| C | 0 | 15132 | 2 |
| D | 0 | 19874 | 2 |
| Mode M9 | |||
|---|---|---|---|
| Quadrant | BADHDUFLAG | Total packets | Discarded packets |
| A | 0 | 25 | 0 |
| B | 0 | 25 | 0 |
| C | 0 | 25 | 0 |
| D | 0 | 25 | 0 |
| Quadrant | Total seconds | Saturated seconds | Saturation percentage |
|---|---|---|---|
| A | 7098 | 93 | 1.310228% |
| B | 7098 | 130 | 1.831502% |
| C | 7098 | 41 | 0.577628% |
| D | 7098 | 190 | 2.676810% |
Noise dominated data is calculated using 1-second bins in cleaned event files. If a bin has >2000 counts, and if more than 50% of those come from <1% of pixels, then it is considered to be noise-dominated and hence unusable.
| Quadrant | # 1 sec bins | Bins with >0 counts | Bins with >2000 counts | High rate bins dominated by noise | Noise dominated (total time) | Noise dominated (detector-on time) | Marked lightcurve |
|---|---|---|---|---|---|---|---|
| A | 9694 | 7101 | 1 | 1 | 0.01% | 0.01% | 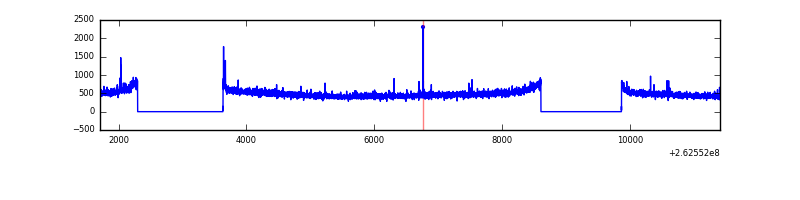 |
| B | 9694 | 7101 | 13 | 13 | 0.13% | 0.18% | 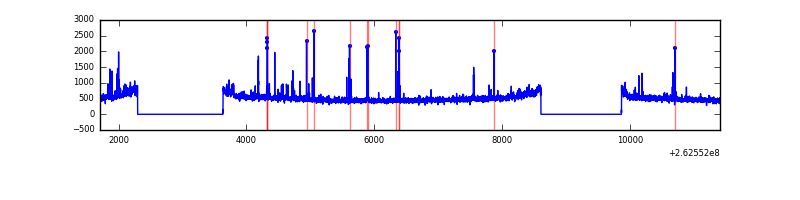 |
| C | 9694 | 7101 | 0 | 0 | 0.00% | 0.00% | 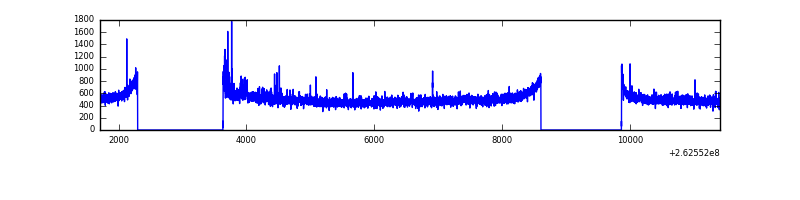 |
| D | 9694 | 7101 | 67 | 67 | 0.69% | 0.94% | 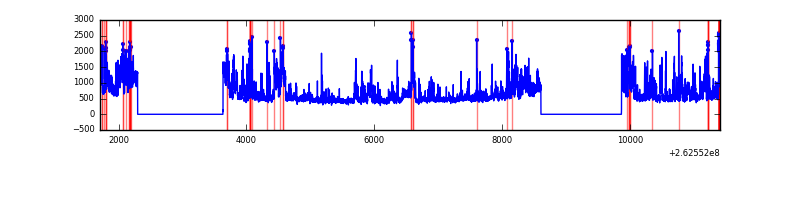 |
Top three noisy pixels from each quadrant. If the there are fewer than three noisy pixels in the level2.evt file, extra rows are filled as -1
| Pixel properties | Quadrant properties | ||||||
|---|---|---|---|---|---|---|---|
| Quadrant | DetID | PixID | Counts | Sigma | Mean | Median | Sigma |
| A | 1 | 162 | 24532 | 132.32 | 884 | 866 | 178.9 |
| A | 9 | 143 | 11866 | 61.5 | 884 | 866 | 178.9 |
| A | 1 | 178 | 8714 | 43.88 | 884 | 866 | 178.9 |
| B | 0 | 189 | 72847 | 429.62 | 901 | 879 | 167.5 |
| B | 3 | 64 | 37990 | 221.54 | 901 | 879 | 167.5 |
| B | 4 | 80 | 37491 | 218.56 | 901 | 879 | 167.5 |
| C | 3 | 233 | 214633 | 1071.11 | 874 | 880 | 199.6 |
| C | 13 | 61 | 6387 | 27.6 | 874 | 880 | 199.6 |
| C | 12 | 4 | 4294 | 17.11 | 874 | 880 | 199.6 |
| D | 13 | 122 | 724173 | 3317.87 | 848 | 830 | 218.0 |
| D | 12 | 110 | 373142 | 1707.74 | 848 | 830 | 218.0 |
| D | 1 | 52 | 294810 | 1348.44 | 848 | 830 | 218.0 |
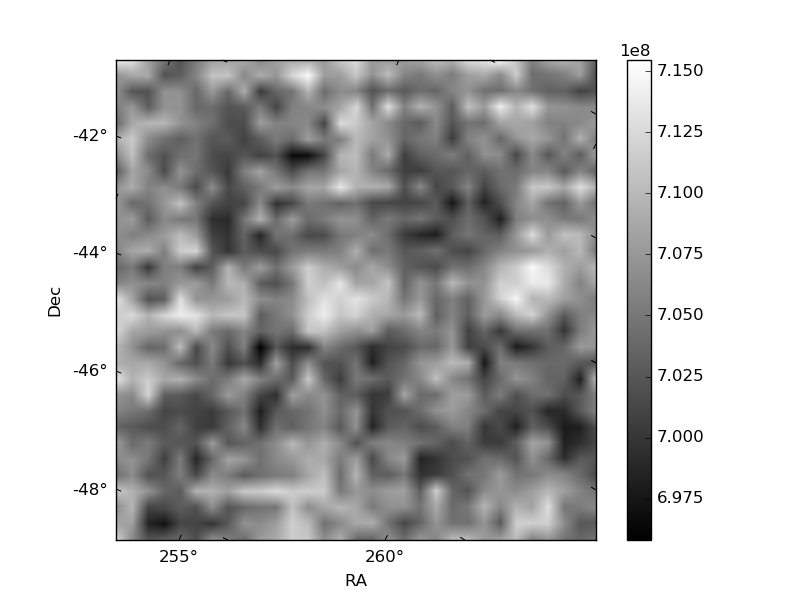
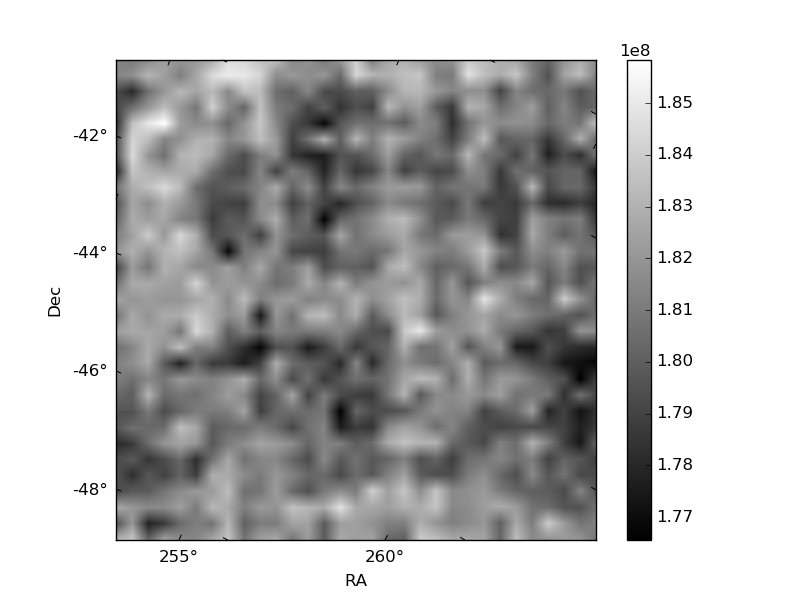
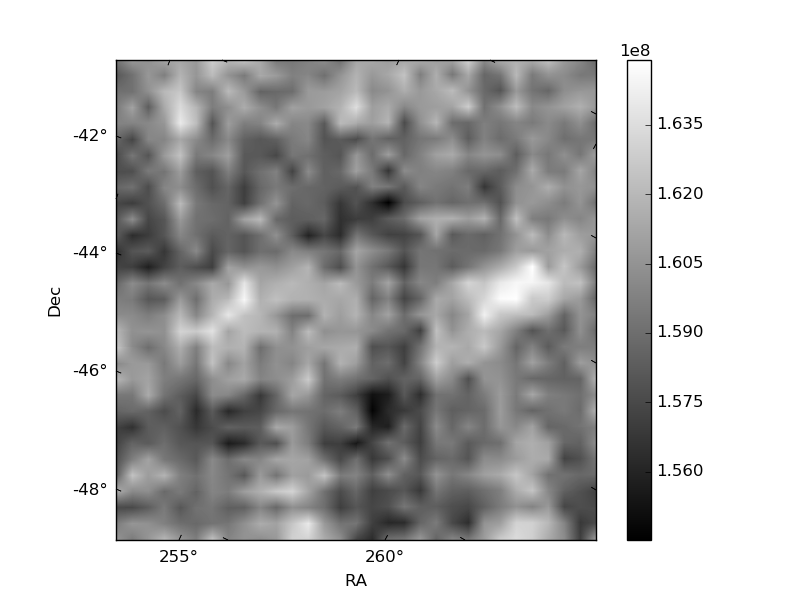
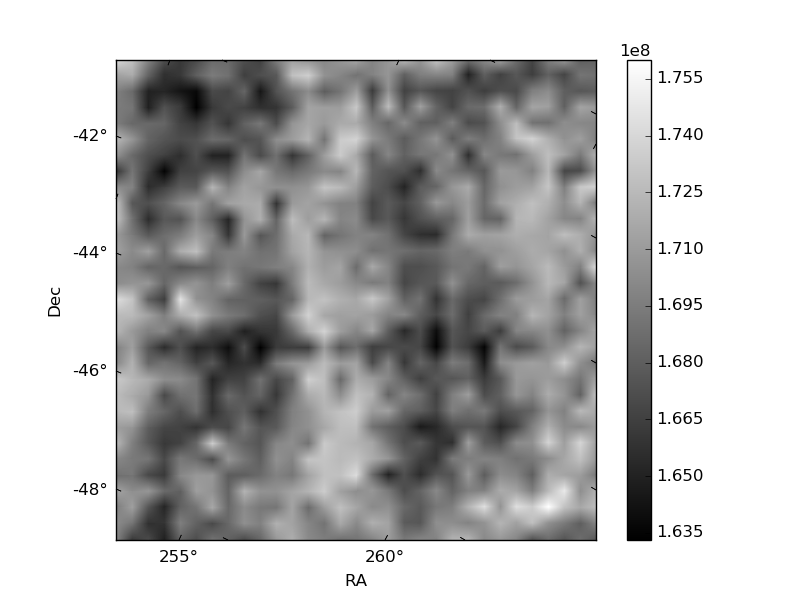
Histogram calculated using DETX and DETY for each event in the final _common_clean file
| Quadrant A | 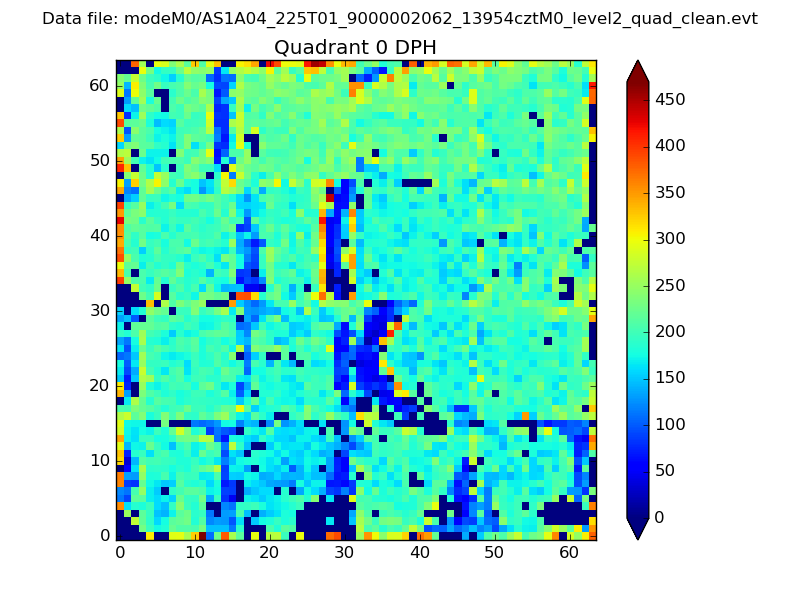 |
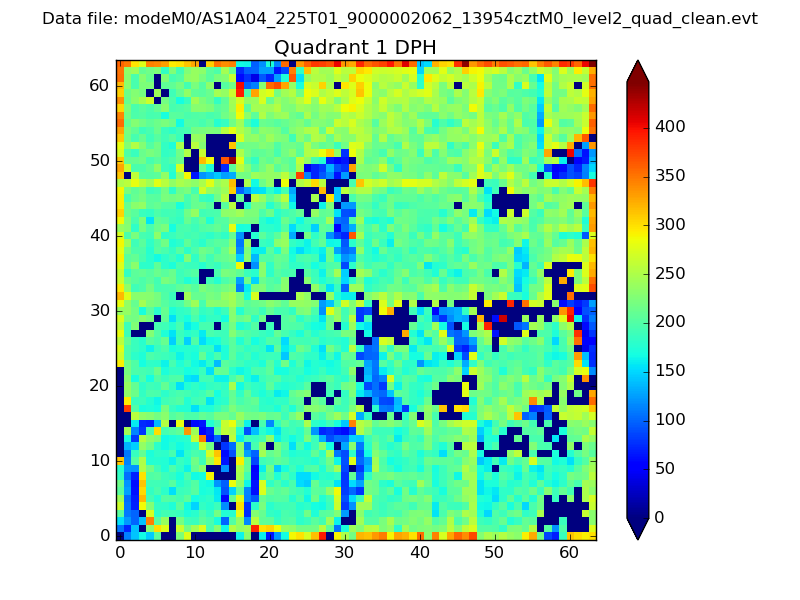 |
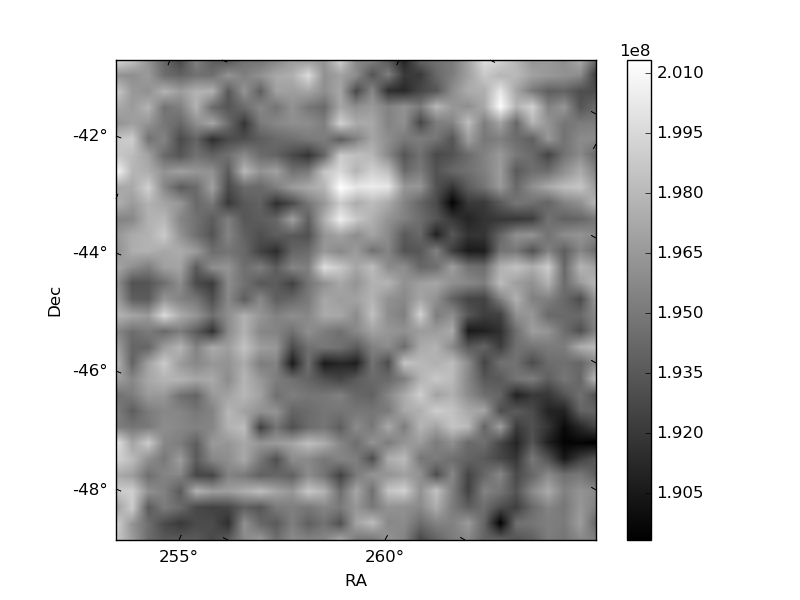
Quadrant B |
|---|---|---|---|
| Quadrant D | 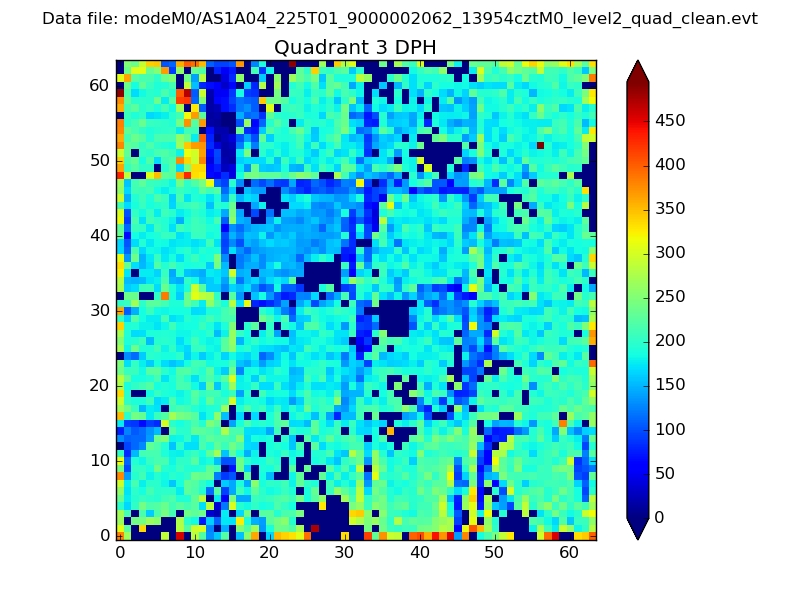 |
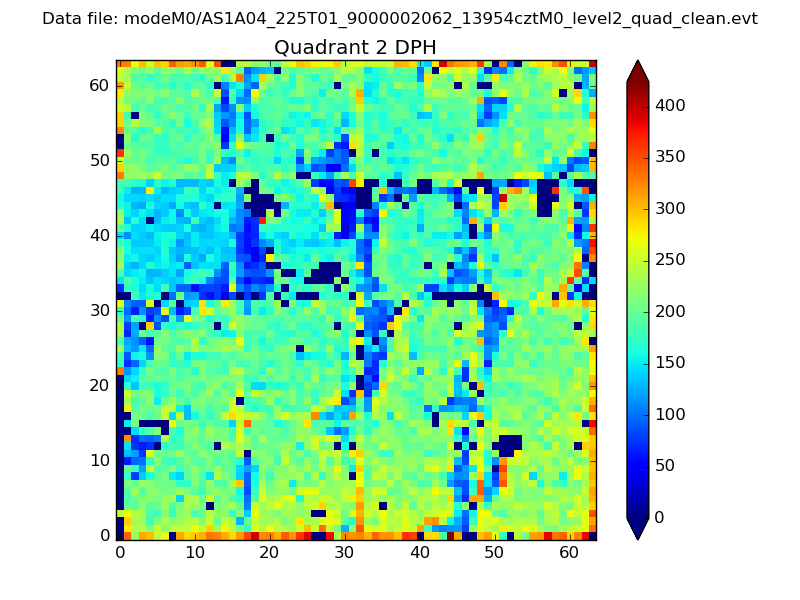 |
Quadrant C |
| Plot type | Count rate plots | Images |
|---|---|---|
| Comparison with Poisson distribution Blue bars denote a histogram of data divided into 1 sec bins. Red curve is a Poisson curve with rate = median count rate of data. |
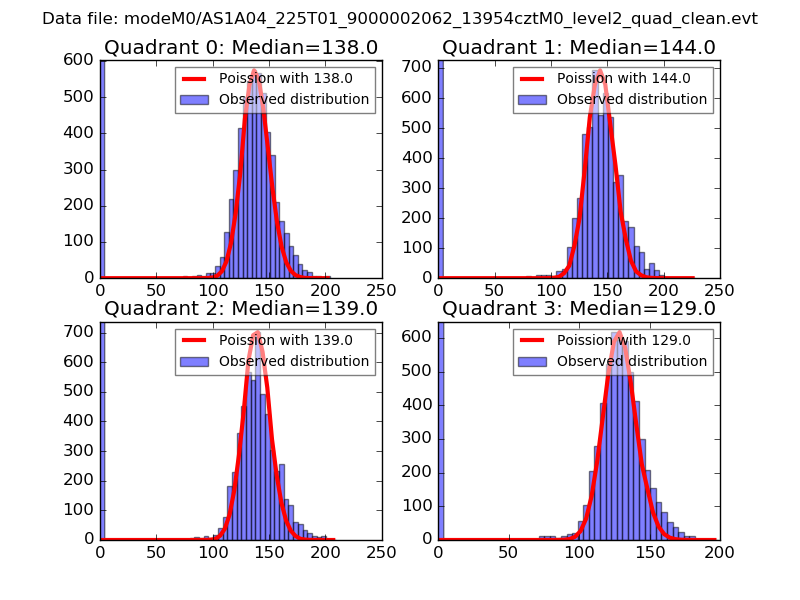 |
 |
| Quadrant-wise count rates Data is divided into 100 sec bins |
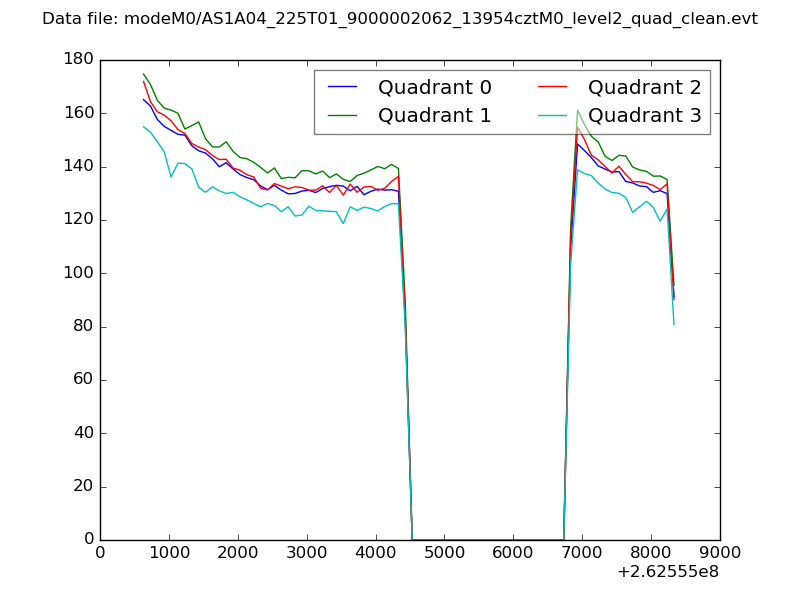 |
|
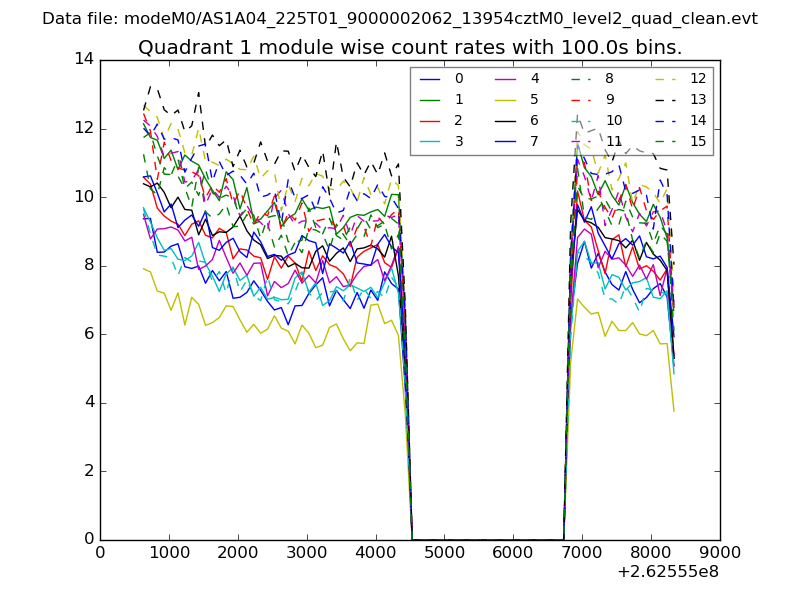
| Module-wise count rates for Quadrant A Data is divided into 100 sec bins |
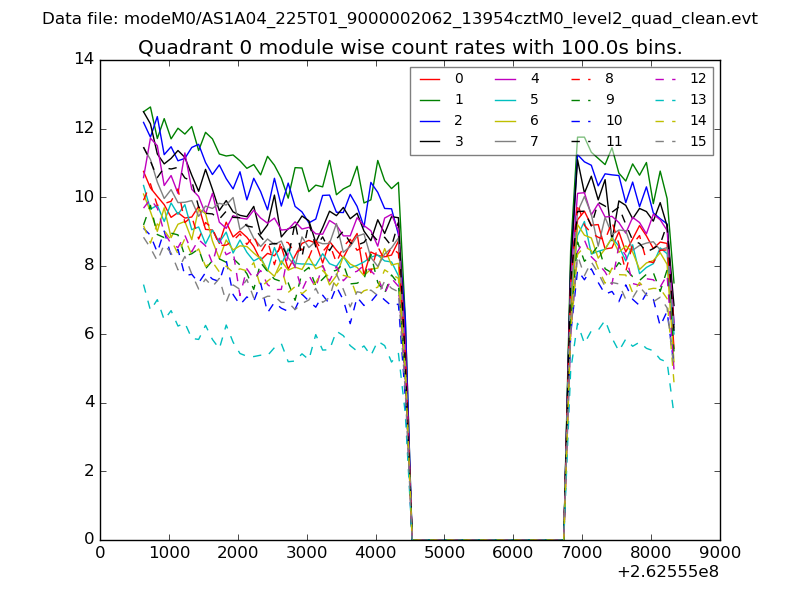 |
 |
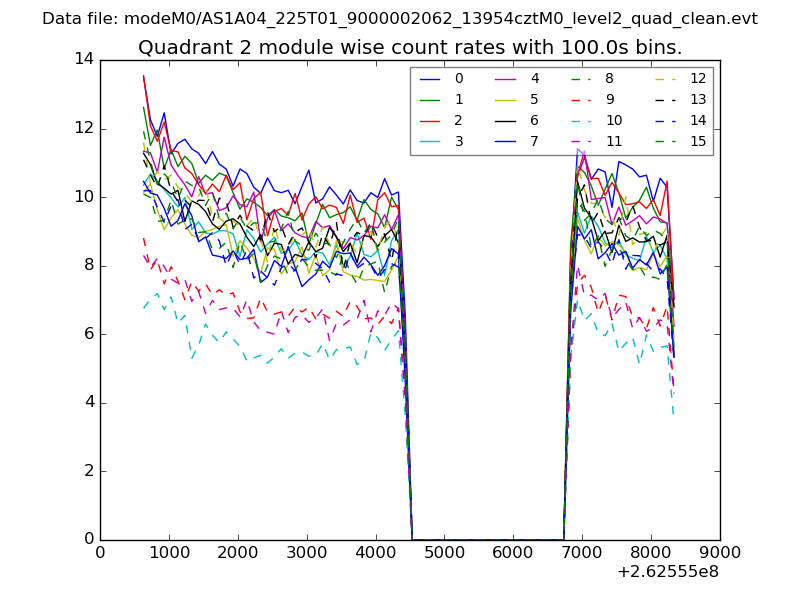
| Module-wise count rates for Quadrant B Data is divided into 100 sec bins |
 |
 |
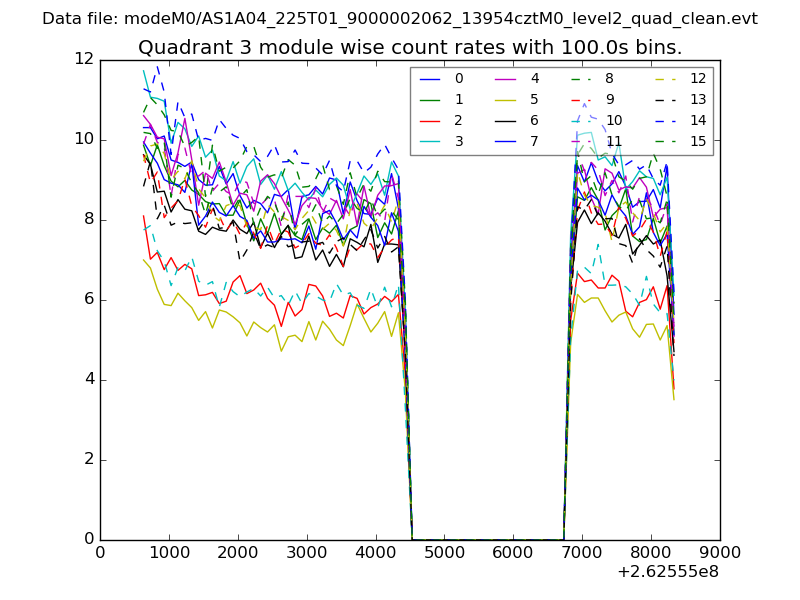
| Module-wise count rates for Quadrant C Data is divided into 100 sec bins |
 |
 |
| Module-wise count rates for Quadrant D Data is divided into 100 sec bins |
 |
 |
| Parameter | Plot |
|---|---|
| CZT HV Monitor | 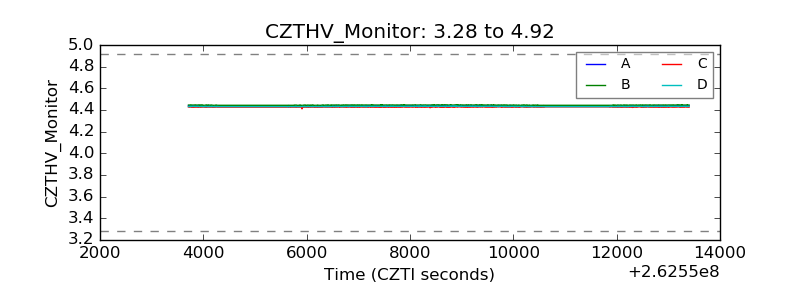 |
| D_VDD | 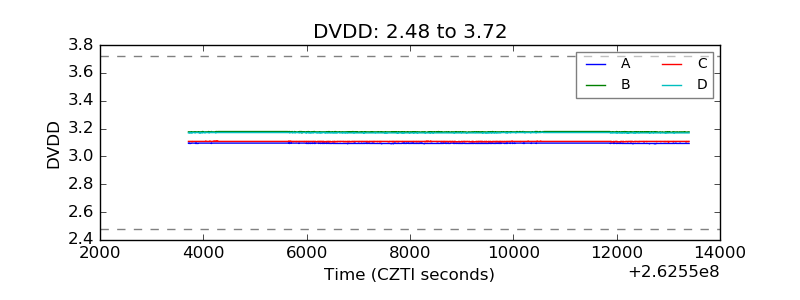 |
| Temperature 1 | 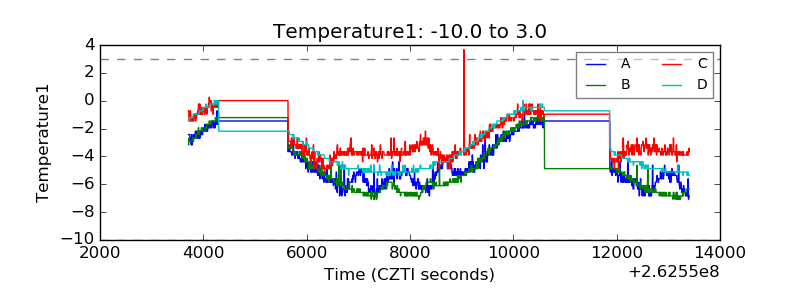 |
| Veto HV Monitor | 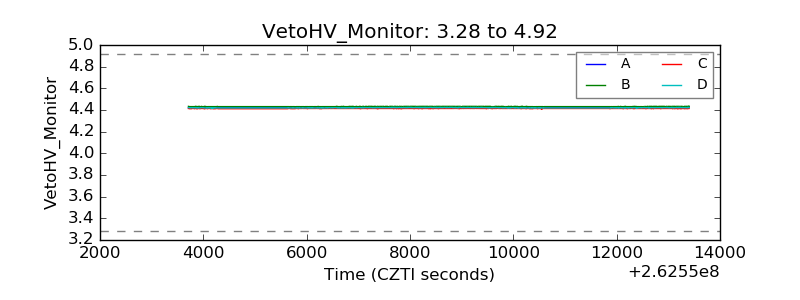 |
| Veto LLD | 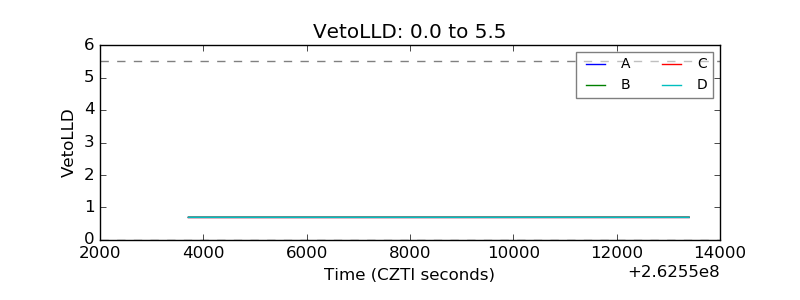 |
| Alpha Counter | 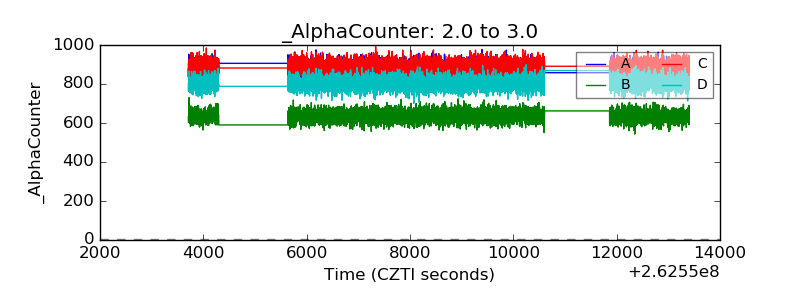 |
| _CPM_Rate | 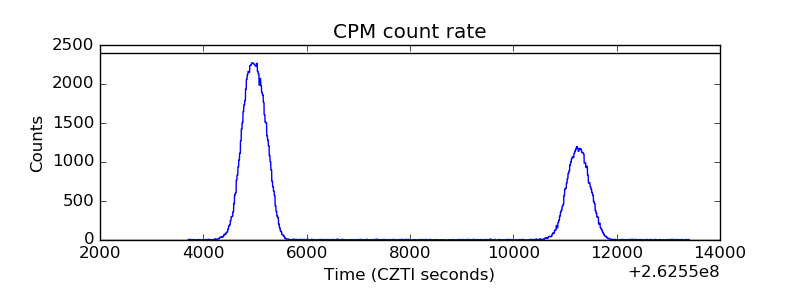 |
| CZT Counter | 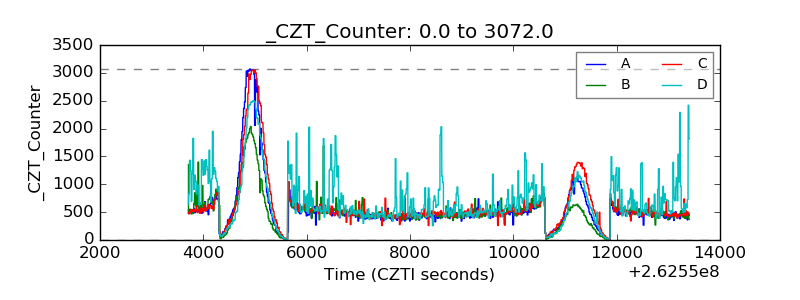 |
| +2.5 Volts monitor |  |
| +5 Volts monitor |  |
| _ROLL_ROT | 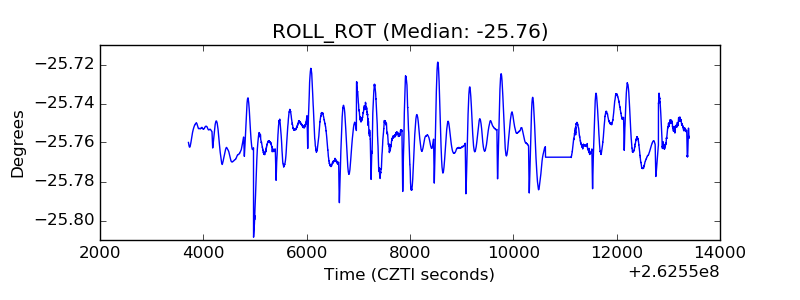 |
| _Roll_DEC | 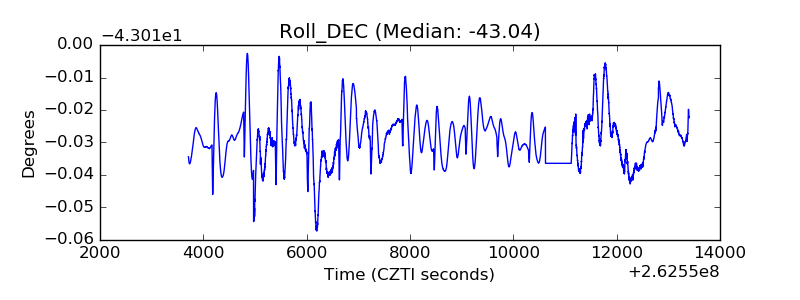 |
| _Roll_RA | 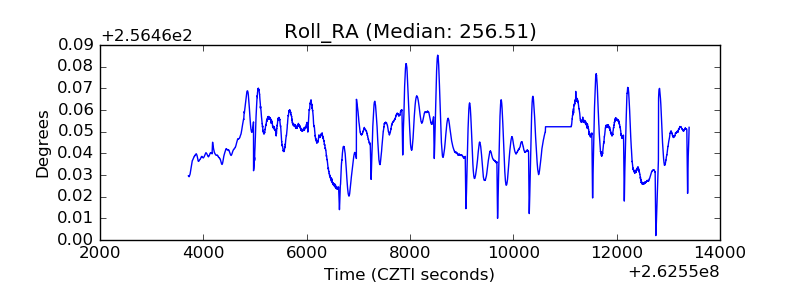 |
| Veto Counter | 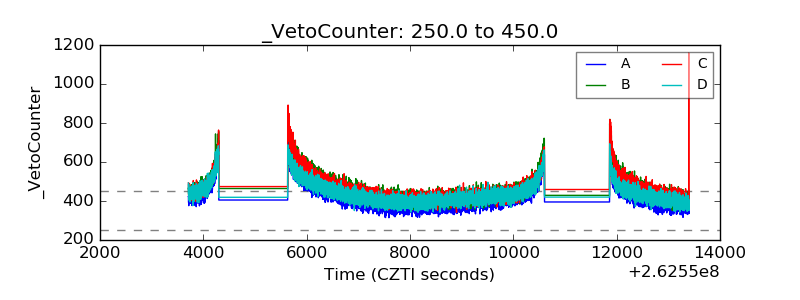 |