| Param | Original file | Final file |
|---|---|---|
| Filename | modeM0/AS1A04_225T01_9000002062_13955cztM0_level2.evt | modeM0/AS1A04_225T01_9000002062_13955cztM0_level2_quad_clean.evt |
| Size (bytes) | 473,544,000 | 96,678,720 |
| Size | 451.6 MB | 92.2 MB |
| Events in quadrant A | 3,057,947 | 618,151 |
| Events in quadrant B | 3,302,999 | 648,466 |
| Events in quadrant C | 3,191,834 | 628,956 |
| Events in quadrant D | 4,350,464 | 582,264 |
| Mode SS | |||
|---|---|---|---|
| Quadrant | BADHDUFLAG | Total packets | Discarded packets |
| A | 0 | 132 | 0 |
| B | 0 | 132 | 0 |
| C | 0 | 132 | 0 |
| D | 0 | 132 | 0 |
| Mode M0 | |||
|---|---|---|---|
| Quadrant | BADHDUFLAG | Total packets | Discarded packets |
| A | 0 | 13345 | 3 |
| B | 0 | 14015 | 2 |
| C | 0 | 13421 | 2 |
| D | 0 | 17233 | 2 |
| Mode M9 | |||
|---|---|---|---|
| Quadrant | BADHDUFLAG | Total packets | Discarded packets |
| A | 0 | 16 | 0 |
| B | 0 | 16 | 0 |
| C | 0 | 16 | 0 |
| D | 0 | 17 | 0 |
| Quadrant | Total seconds | Saturated seconds | Saturation percentage |
|---|---|---|---|
| A | 6449 | 29 | 0.449682% |
| B | 6449 | 76 | 1.178477% |
| C | 6449 | 20 | 0.310126% |
| D | 6449 | 93 | 1.442084% |
Noise dominated data is calculated using 1-second bins in cleaned event files. If a bin has >2000 counts, and if more than 50% of those come from <1% of pixels, then it is considered to be noise-dominated and hence unusable.
| Quadrant | # 1 sec bins | Bins with >0 counts | Bins with >2000 counts | High rate bins dominated by noise | Noise dominated (total time) | Noise dominated (detector-on time) | Marked lightcurve |
|---|---|---|---|---|---|---|---|
| A | 7470 | 6451 | 5 | 5 | 0.07% | 0.08% | 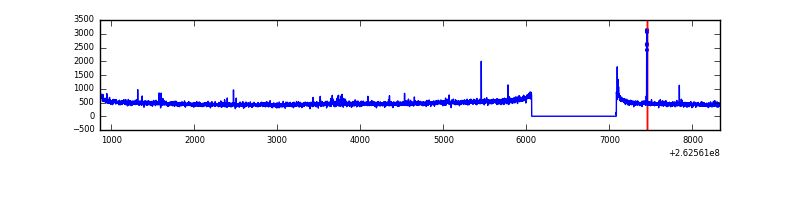 |
| B | 7470 | 6451 | 37 | 37 | 0.50% | 0.57% | 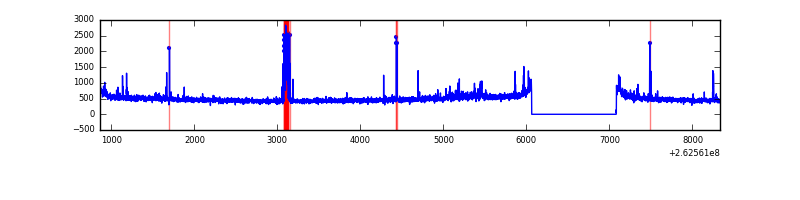 |
| C | 7470 | 6451 | 0 | 0 | 0.00% | 0.00% | 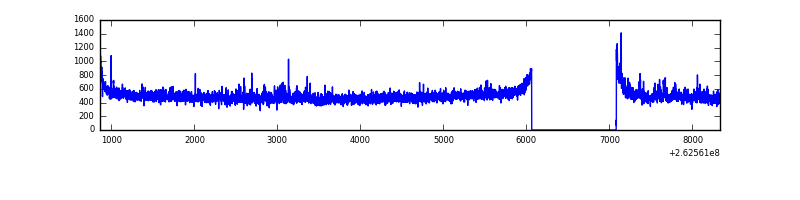 |
| D | 7470 | 6451 | 86 | 86 | 1.15% | 1.33% | 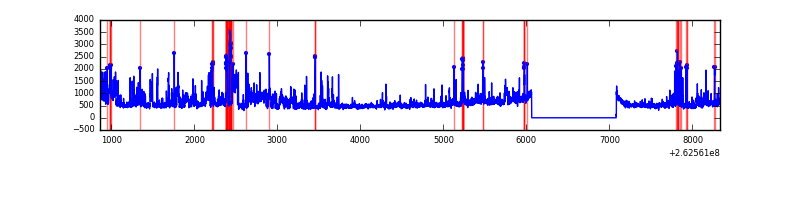 |
Top three noisy pixels from each quadrant. If the there are fewer than three noisy pixels in the level2.evt file, extra rows are filled as -1
| Pixel properties | Quadrant properties | ||||||
|---|---|---|---|---|---|---|---|
| Quadrant | DetID | PixID | Counts | Sigma | Mean | Median | Sigma |
| A | 1 | 162 | 20076 | 122.94 | 770 | 754 | 157.2 |
| A | 12 | 189 | 17455 | 106.26 | 770 | 754 | 157.2 |
| A | 15 | 69 | 17312 | 105.35 | 770 | 754 | 157.2 |
| B | 0 | 229 | 102470 | 689.74 | 783 | 763 | 147.5 |
| B | 0 | 189 | 37907 | 251.9 | 783 | 763 | 147.5 |
| B | 3 | 209 | 37317 | 247.9 | 783 | 763 | 147.5 |
| C | 3 | 233 | 212248 | 1197.19 | 764 | 768 | 176.6 |
| C | 13 | 61 | 5472 | 26.63 | 764 | 768 | 176.6 |
| C | 3 | 202 | 1793 | 5.8 | 764 | 768 | 176.6 |
| D | 13 | 122 | 817549 | 4165.54 | 741 | 726 | 196.1 |
| D | 1 | 52 | 227997 | 1159.01 | 741 | 726 | 196.1 |
| D | 8 | 195 | 173297 | 880.06 | 741 | 726 | 196.1 |
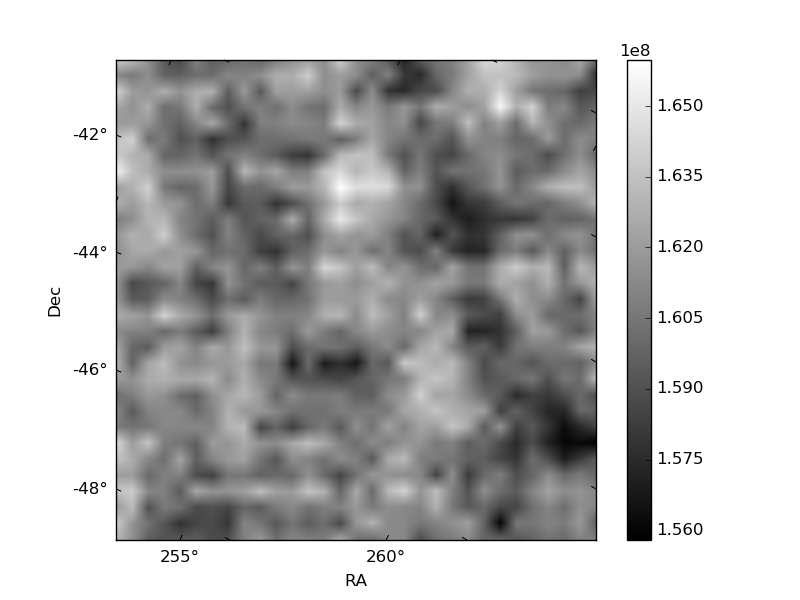
Histogram calculated using DETX and DETY for each event in the final _common_clean file
| Quadrant A |  |
 |
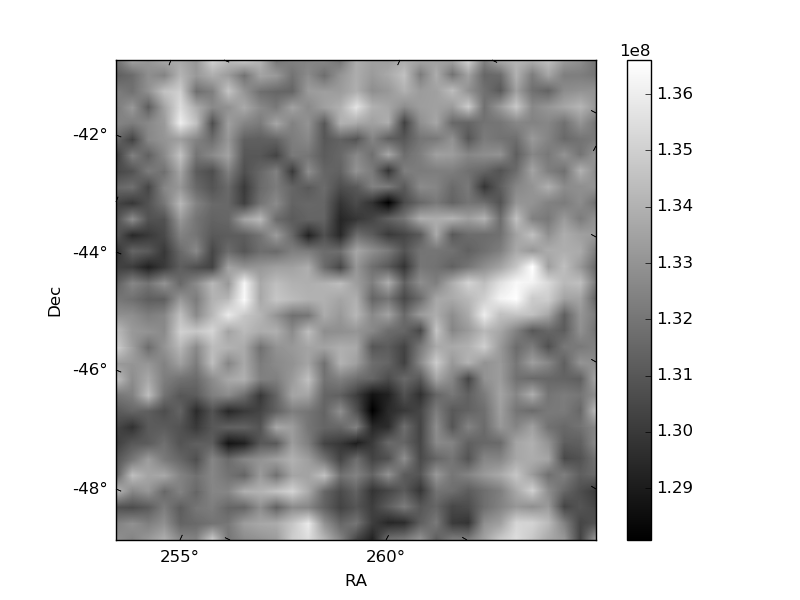
Quadrant B |
|---|---|---|---|
| Quadrant D | 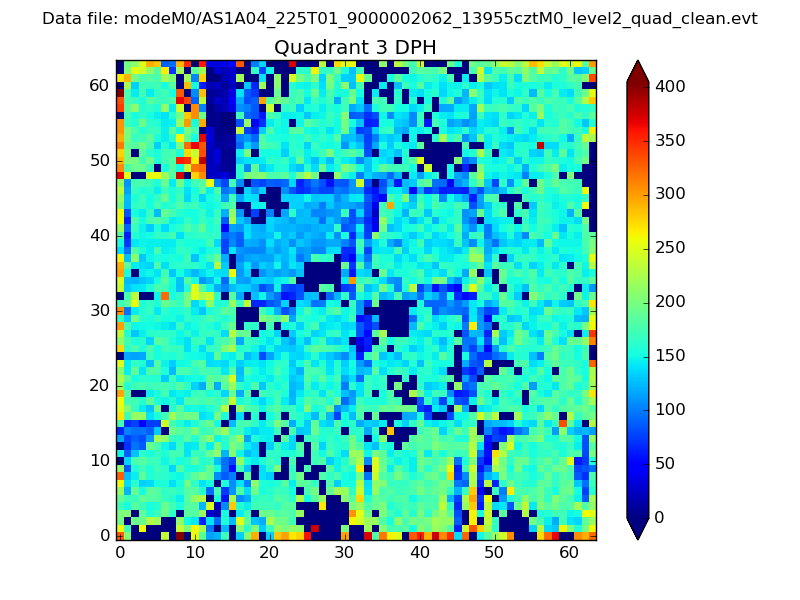 |
 |
Quadrant C |
| Plot type | Count rate plots | Images |
|---|---|---|
| Comparison with Poisson distribution Blue bars denote a histogram of data divided into 1 sec bins. Red curve is a Poisson curve with rate = median count rate of data. |
 |
 |
| Quadrant-wise count rates Data is divided into 100 sec bins |
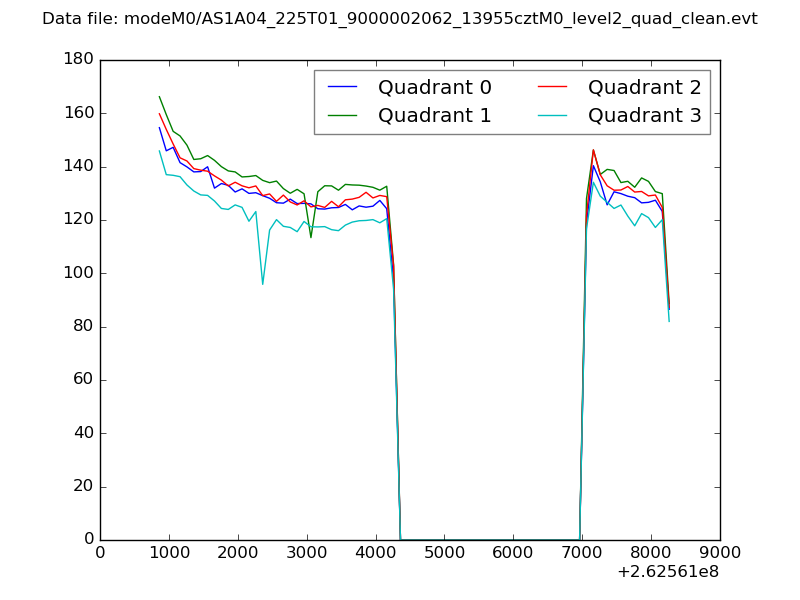 |
|
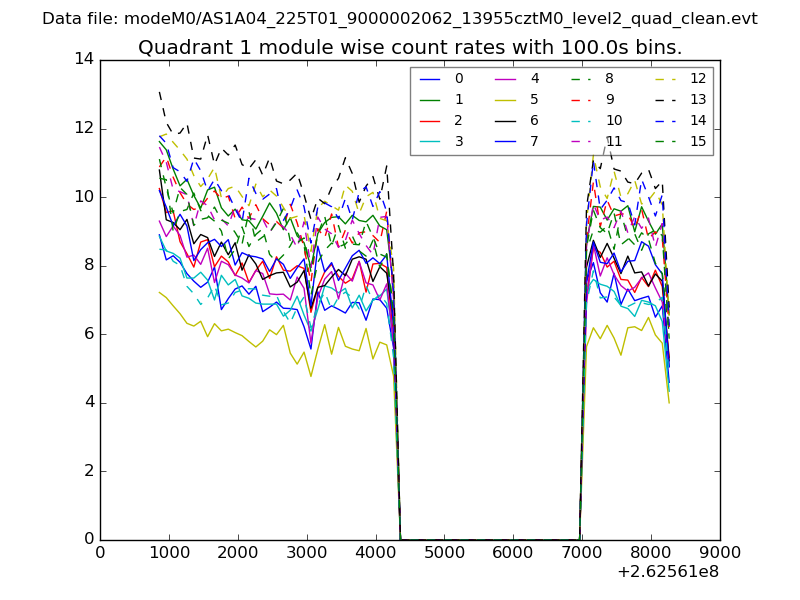
| Module-wise count rates for Quadrant A Data is divided into 100 sec bins |
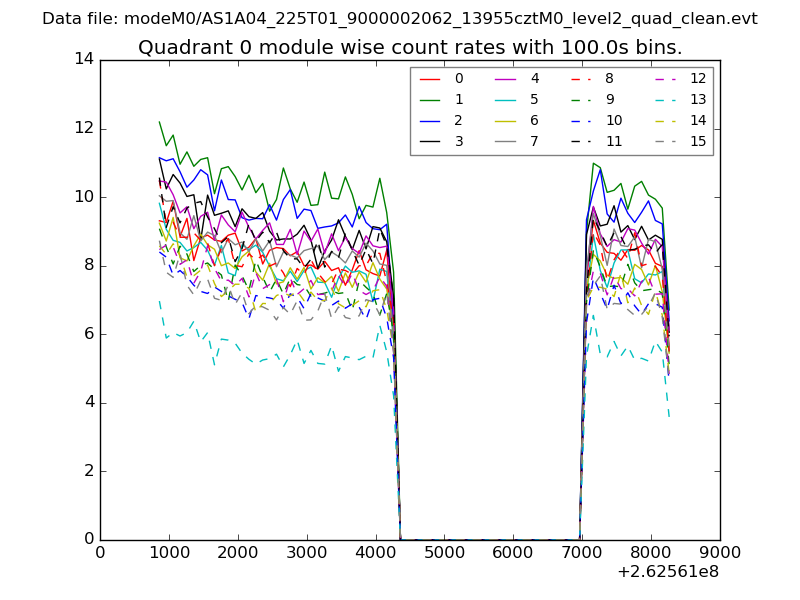 |
 |
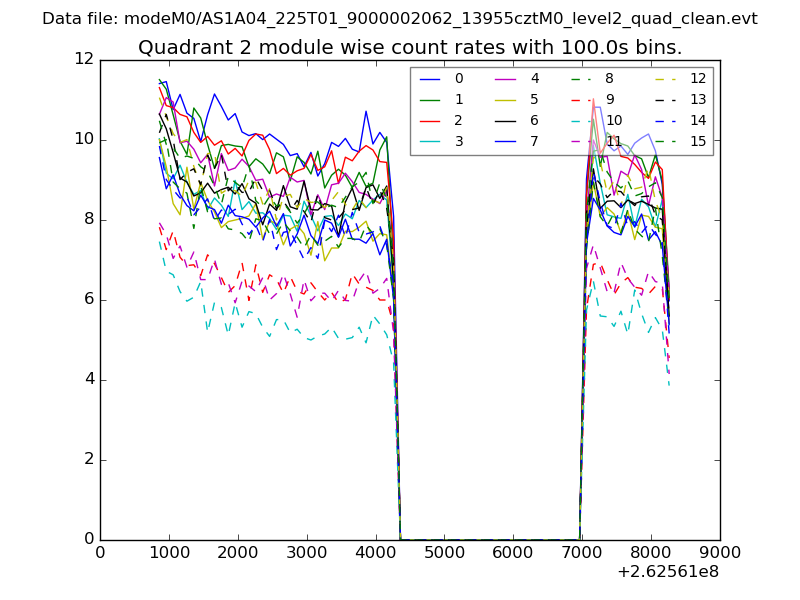
| Module-wise count rates for Quadrant B Data is divided into 100 sec bins |
 |
 |
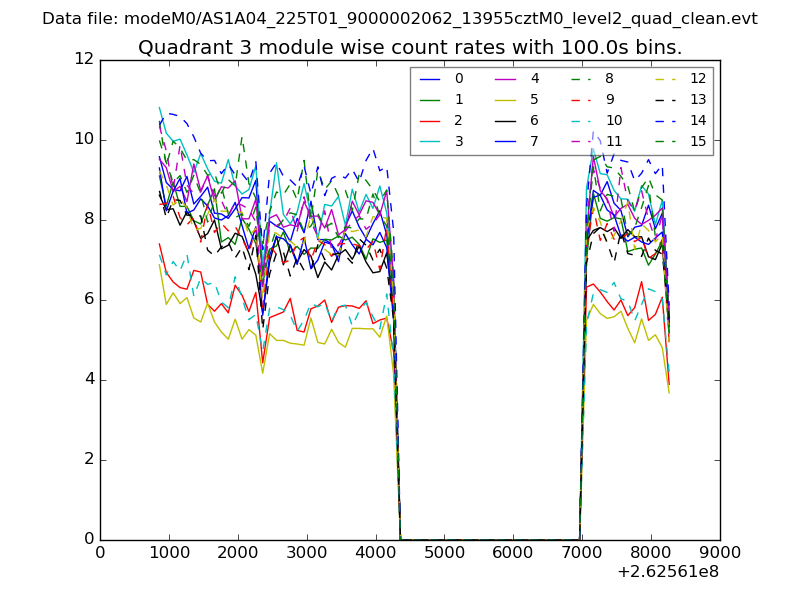
| Module-wise count rates for Quadrant C Data is divided into 100 sec bins |
 |
 |
| Module-wise count rates for Quadrant D Data is divided into 100 sec bins |
 |
 |
| Parameter | Plot |
|---|---|
| CZT HV Monitor | 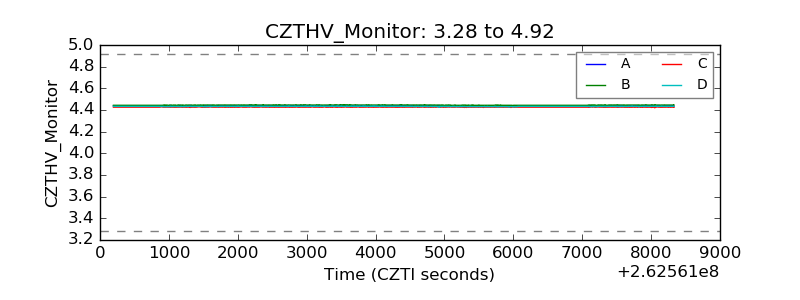 |
| D_VDD | 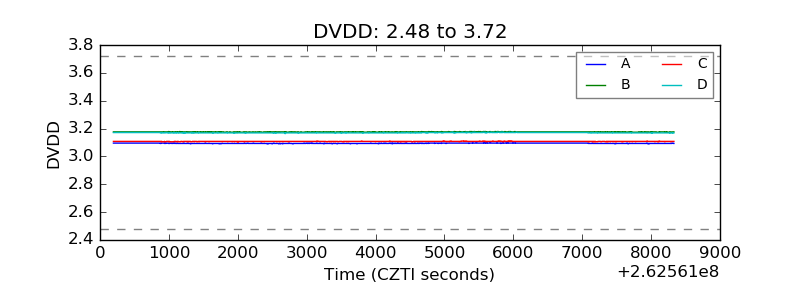 |
| Temperature 1 | 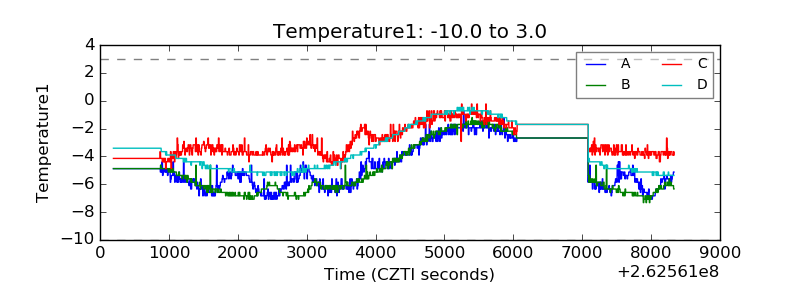 |
| Veto HV Monitor | 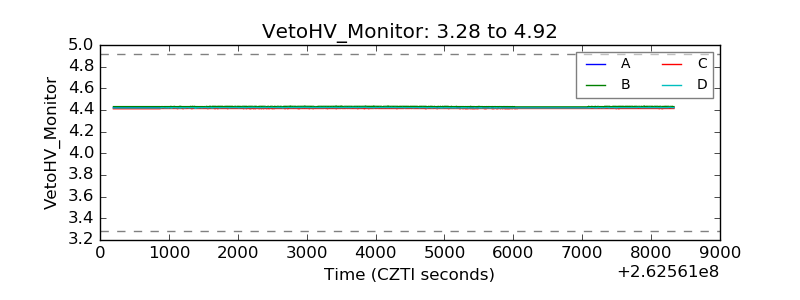 |
| Veto LLD | 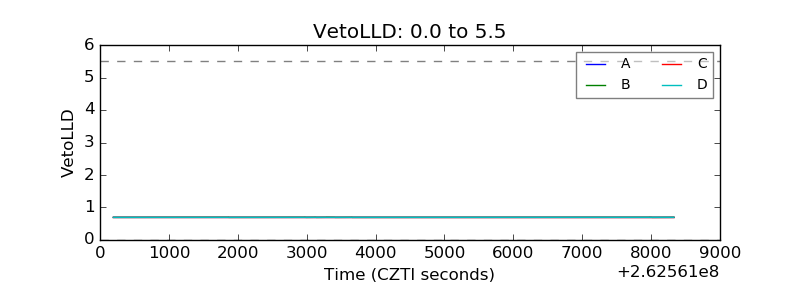 |
| Alpha Counter | 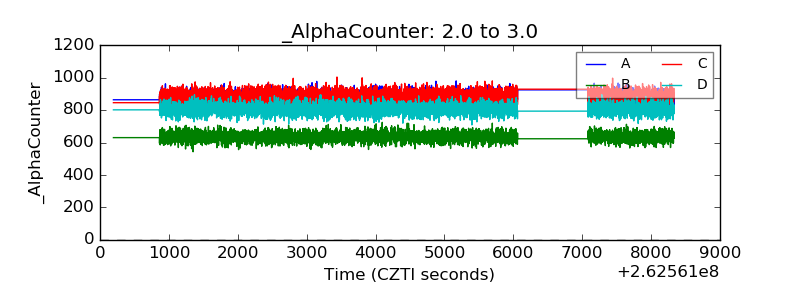 |
| _CPM_Rate | 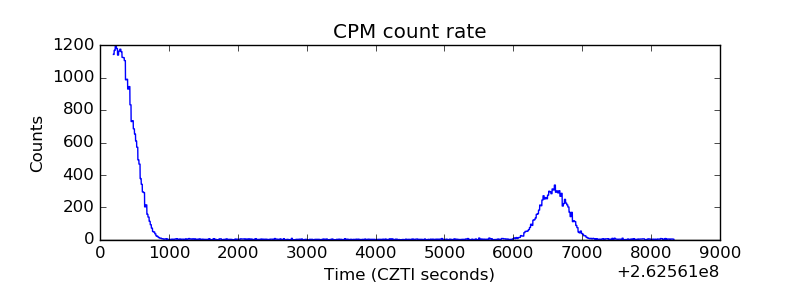 |
| CZT Counter |  |
| +2.5 Volts monitor |  |
| +5 Volts monitor | 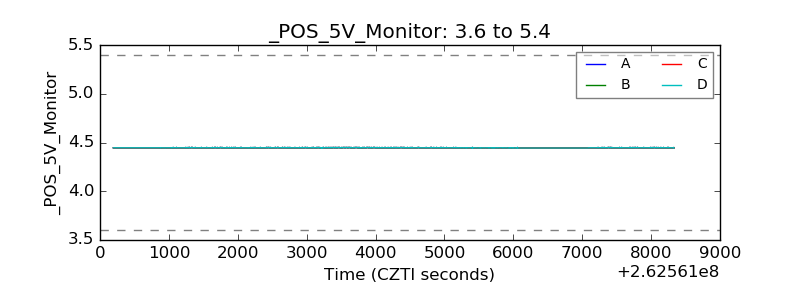 |
| _ROLL_ROT |  |
| _Roll_DEC | 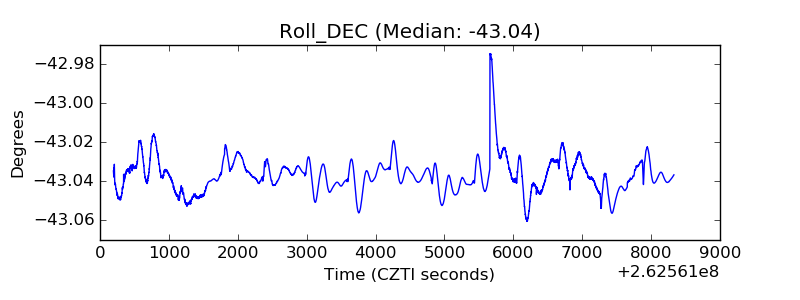 |
| _Roll_RA |  |
| Veto Counter | 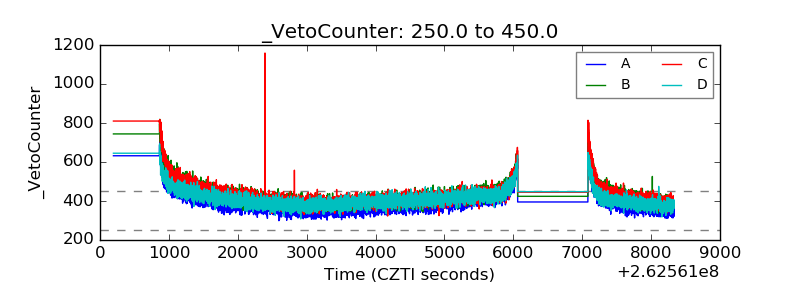 |