| Param | Original file | Final file |
|---|---|---|
| Filename | modeM0/AS1A04_225T01_9000002062_13956cztM0_level2.evt | modeM0/AS1A04_225T01_9000002062_13956cztM0_level2_quad_clean.evt |
| Size (bytes) | 661,127,040 | 108,815,040 |
| Size | 630.5 MB | 103.8 MB |
| Events in quadrant A | 3,831,281 | 687,944 |
| Events in quadrant B | 4,041,806 | 721,513 |
| Events in quadrant C | 3,936,254 | 697,897 |
| Events in quadrant D | 7,663,380 | 623,889 |
| Mode SS | |||
|---|---|---|---|
| Quadrant | BADHDUFLAG | Total packets | Discarded packets |
| A | 0 | 166 | 0 |
| B | 0 | 166 | 0 |
| C | 0 | 166 | 0 |
| D | 0 | 166 | 0 |
| Mode M0 | |||
|---|---|---|---|
| Quadrant | BADHDUFLAG | Total packets | Discarded packets |
| A | 0 | 16911 | 3 |
| B | 0 | 17336 | 2 |
| C | 0 | 16854 | 2 |
| D | 0 | 28419 | 2 |
| Mode M9 | |||
|---|---|---|---|
| Quadrant | BADHDUFLAG | Total packets | Discarded packets |
| A | 0 | 16 | 0 |
| B | 0 | 16 | 0 |
| C | 0 | 16 | 0 |
| D | 0 | 16 | 0 |
| Quadrant | Total seconds | Saturated seconds | Saturation percentage |
|---|---|---|---|
| A | 8116 | 46 | 0.566782% |
| B | 8116 | 97 | 1.195170% |
| C | 8116 | 50 | 0.616067% |
| D | 8116 | 875 | 10.781173% |
Noise dominated data is calculated using 1-second bins in cleaned event files. If a bin has >2000 counts, and if more than 50% of those come from <1% of pixels, then it is considered to be noise-dominated and hence unusable.
| Quadrant | # 1 sec bins | Bins with >0 counts | Bins with >2000 counts | High rate bins dominated by noise | Noise dominated (total time) | Noise dominated (detector-on time) | Marked lightcurve |
|---|---|---|---|---|---|---|---|
| A | 9737 | 8119 | 5 | 5 | 0.05% | 0.06% | 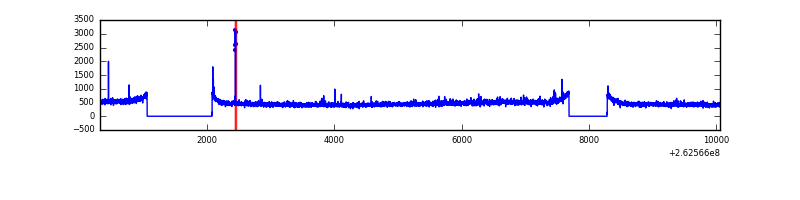 |
| B | 9737 | 8119 | 8 | 8 | 0.08% | 0.10% | 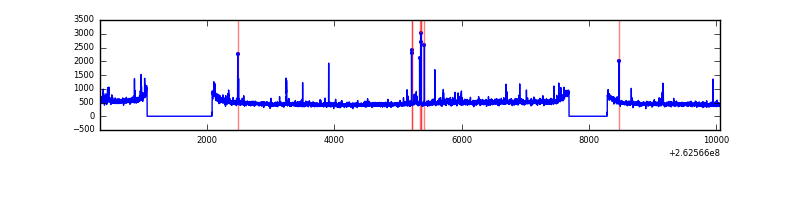 |
| C | 9737 | 8119 | 0 | 0 | 0.00% | 0.00% | 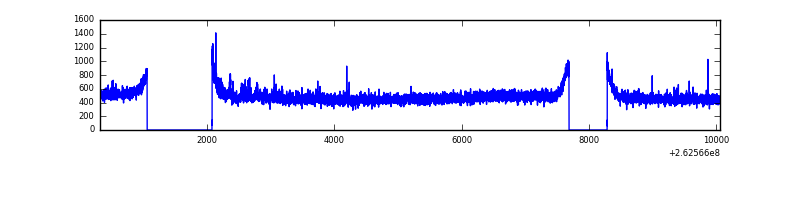 |
| D | 9737 | 8119 | 783 | 783 | 8.04% | 9.64% | 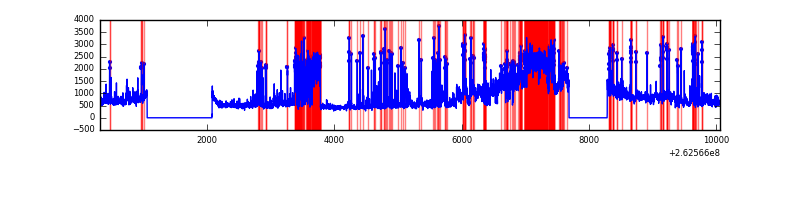 |
Top three noisy pixels from each quadrant. If the there are fewer than three noisy pixels in the level2.evt file, extra rows are filled as -1
| Pixel properties | Quadrant properties | ||||||
|---|---|---|---|---|---|---|---|
| Quadrant | DetID | PixID | Counts | Sigma | Mean | Median | Sigma |
| A | 1 | 162 | 25993 | 126.35 | 970 | 949 | 198.2 |
| A | 15 | 69 | 18721 | 89.66 | 970 | 949 | 198.2 |
| A | 15 | 222 | 13550 | 63.57 | 970 | 949 | 198.2 |
| B | 3 | 209 | 55762 | 294.04 | 985 | 957 | 186.4 |
| B | 0 | 189 | 41906 | 219.7 | 985 | 957 | 186.4 |
| B | 4 | 80 | 37151 | 194.19 | 985 | 957 | 186.4 |
| C | 3 | 233 | 185063 | 827.46 | 962 | 966 | 222.5 |
| C | 13 | 61 | 6949 | 26.89 | 962 | 966 | 222.5 |
| C | 3 | 202 | 2214 | 5.61 | 962 | 966 | 222.5 |
| D | 13 | 122 | 1650507 | 7499.22 | 908 | 887 | 220.0 |
| D | 10 | 157 | 1594771 | 7245.85 | 908 | 887 | 220.0 |
| D | 1 | 52 | 506935 | 2300.51 | 908 | 887 | 220.0 |
Histogram calculated using DETX and DETY for each event in the final _common_clean file
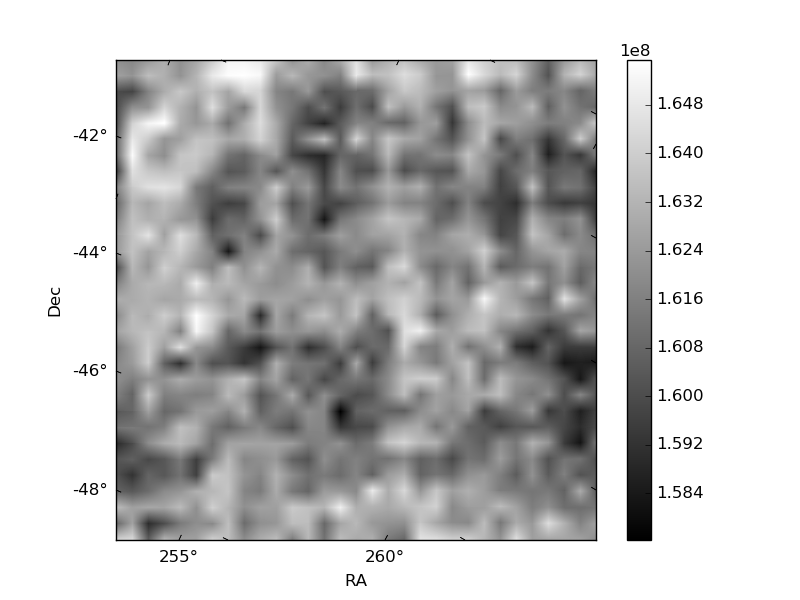
| Quadrant A | 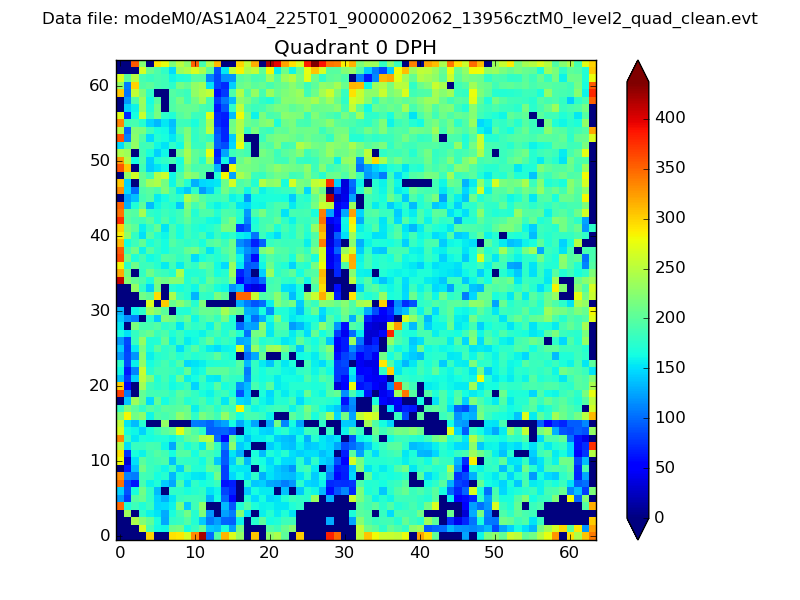 |
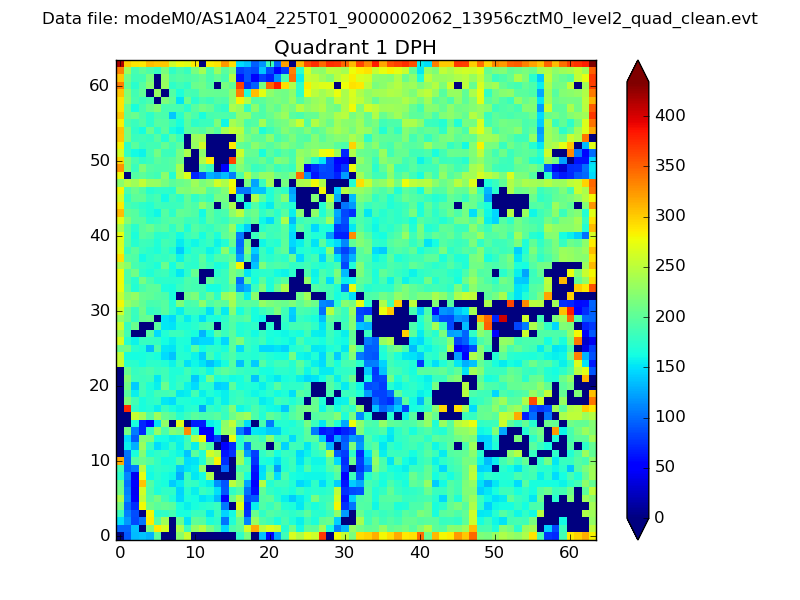 |
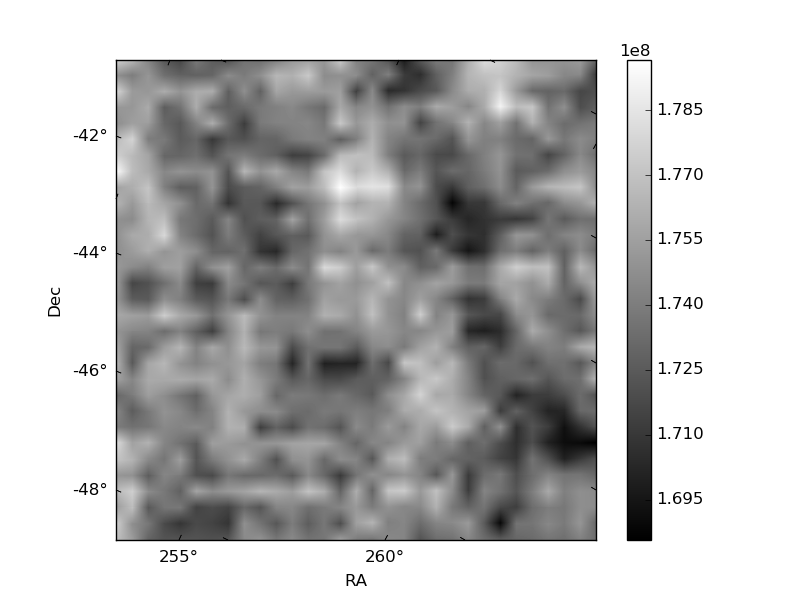
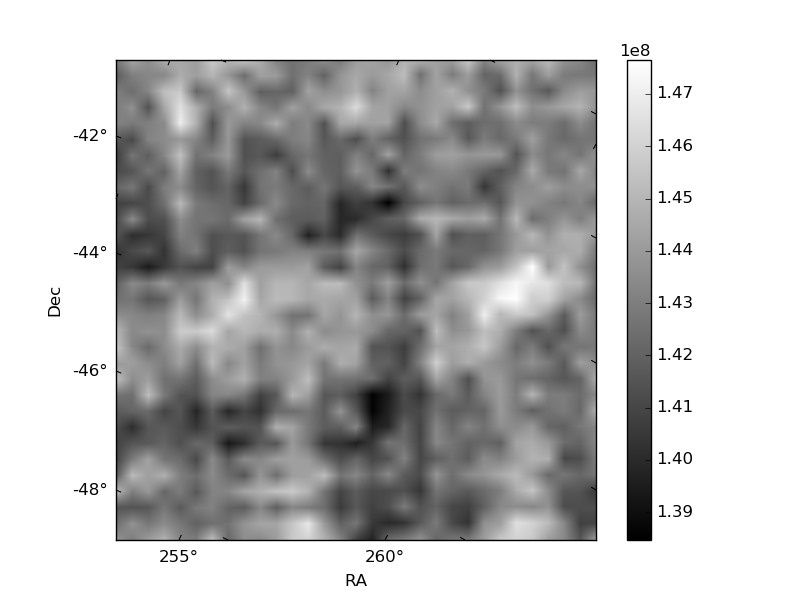
Quadrant B |
|---|---|---|---|
| Quadrant D | 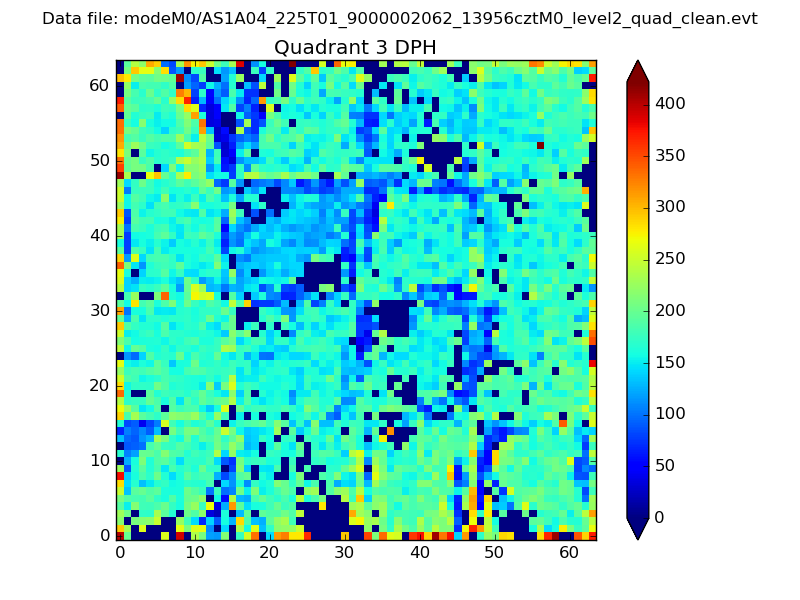 |
 |
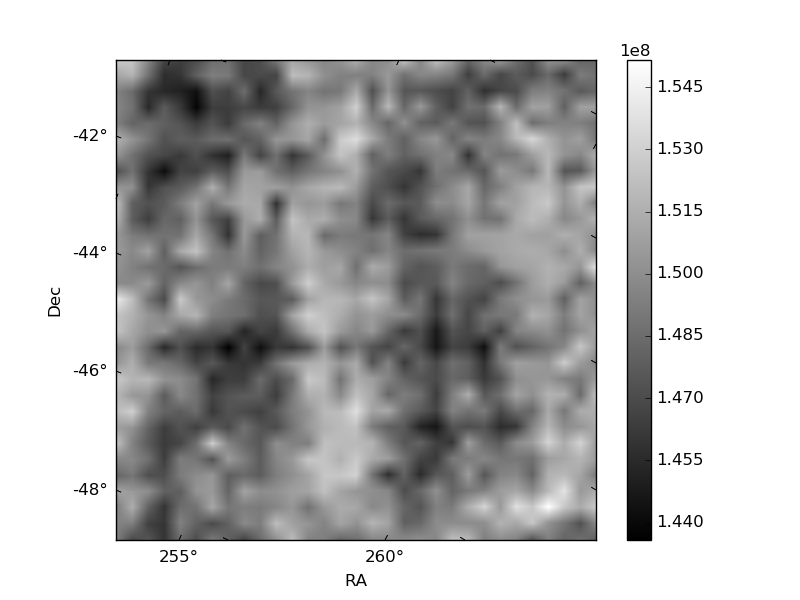
Quadrant C |
| Plot type | Count rate plots | Images |
|---|---|---|
| Comparison with Poisson distribution Blue bars denote a histogram of data divided into 1 sec bins. Red curve is a Poisson curve with rate = median count rate of data. |
 |
 |
| Quadrant-wise count rates Data is divided into 100 sec bins |
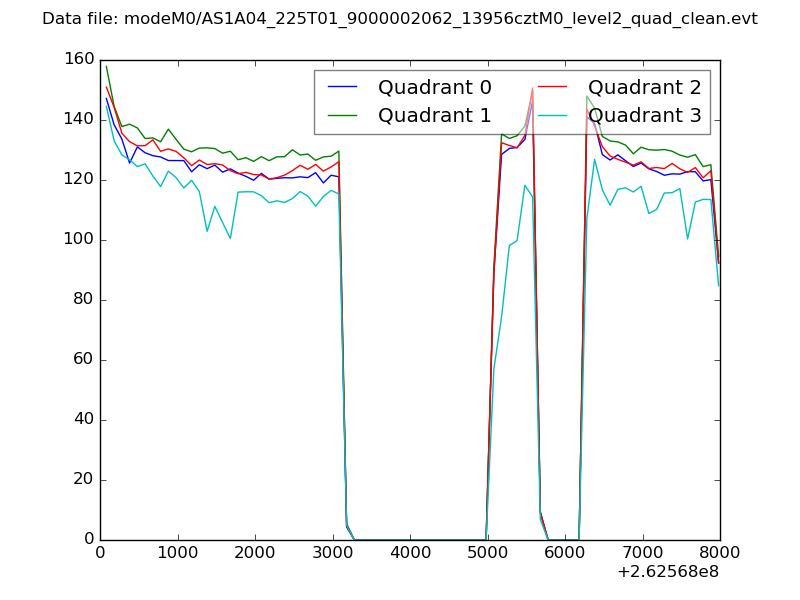 |
|
| Module-wise count rates for Quadrant A Data is divided into 100 sec bins |
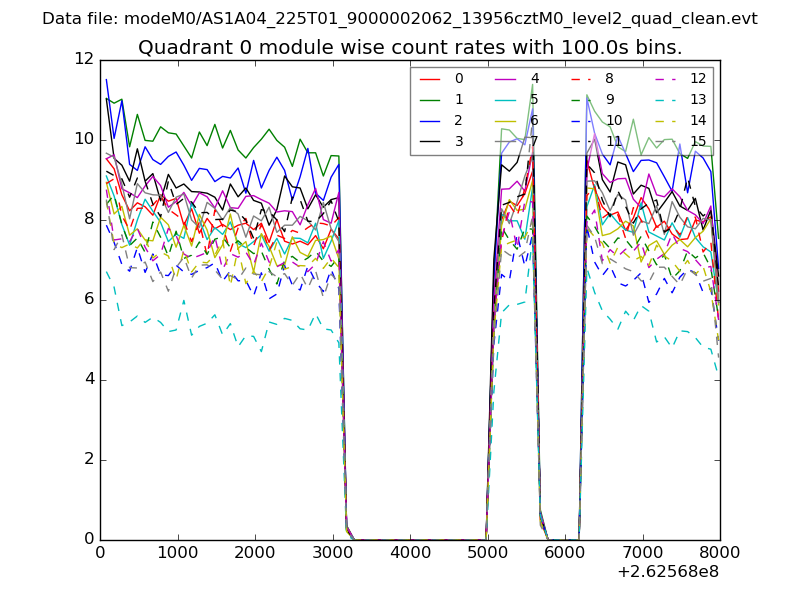 |
 |
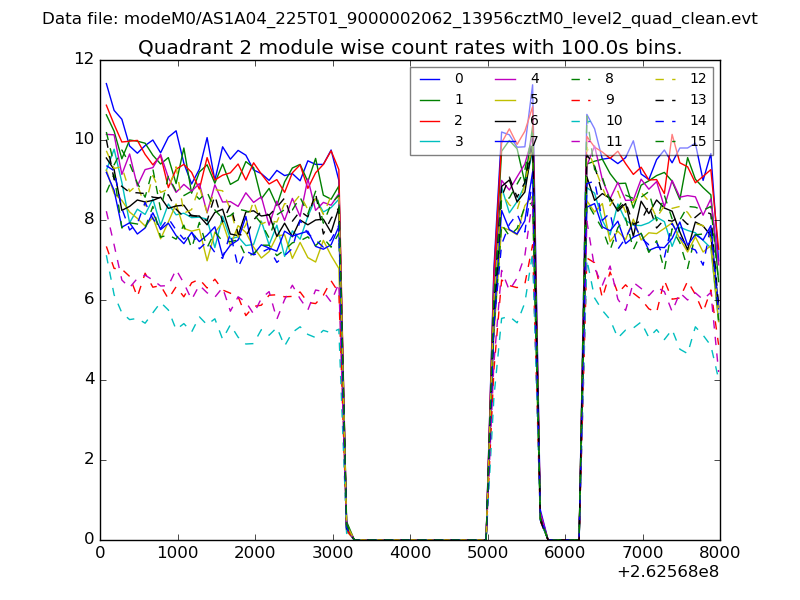
| Module-wise count rates for Quadrant B Data is divided into 100 sec bins |
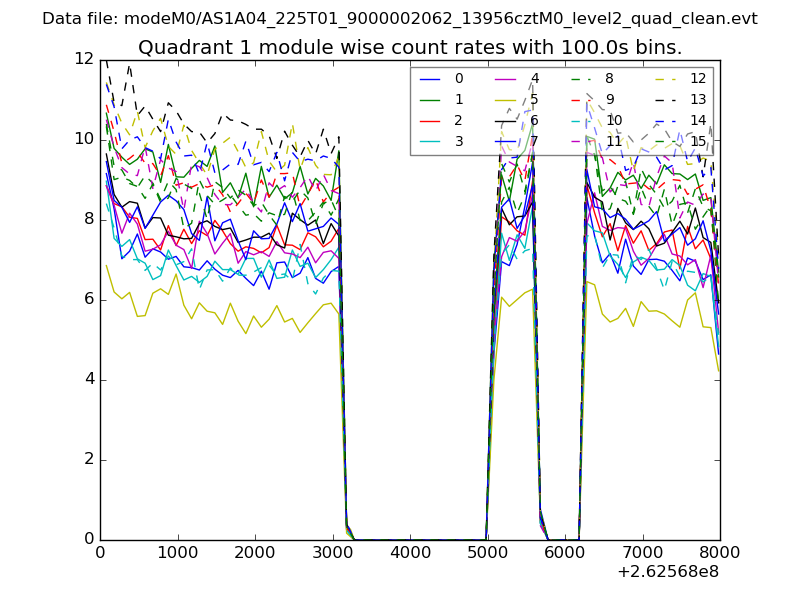 |
 |
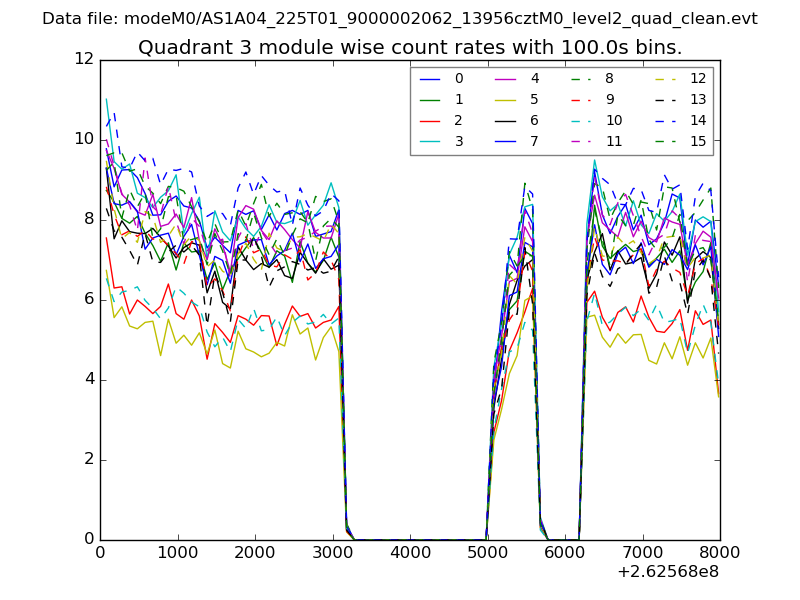
| Module-wise count rates for Quadrant C Data is divided into 100 sec bins |
 |
 |
| Module-wise count rates for Quadrant D Data is divided into 100 sec bins |
 |
 |
| Parameter | Plot |
|---|---|
| CZT HV Monitor | 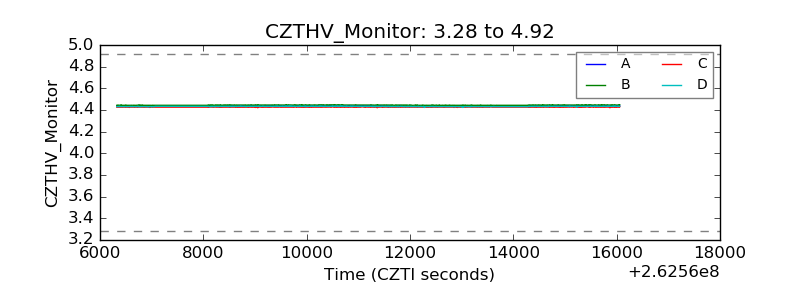 |
| D_VDD | 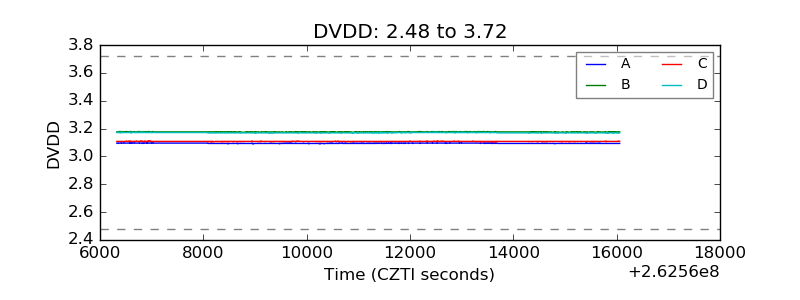 |
| Temperature 1 | 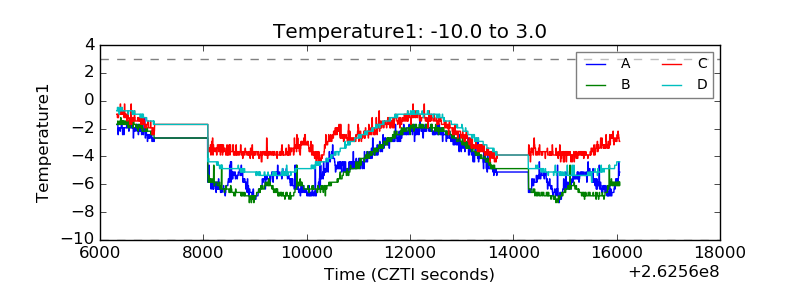 |
| Veto HV Monitor | 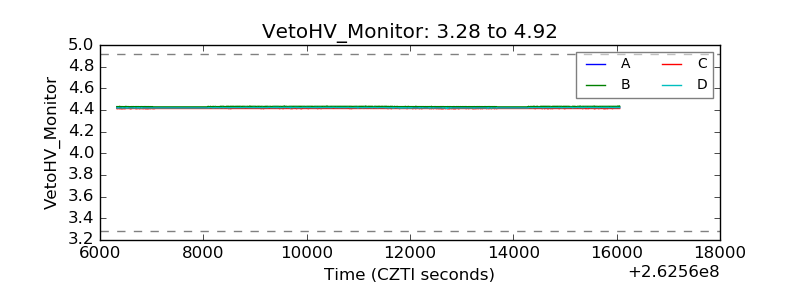 |
| Veto LLD | 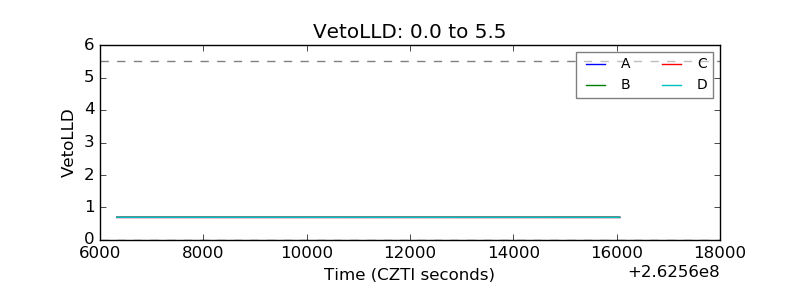 |
| Alpha Counter | 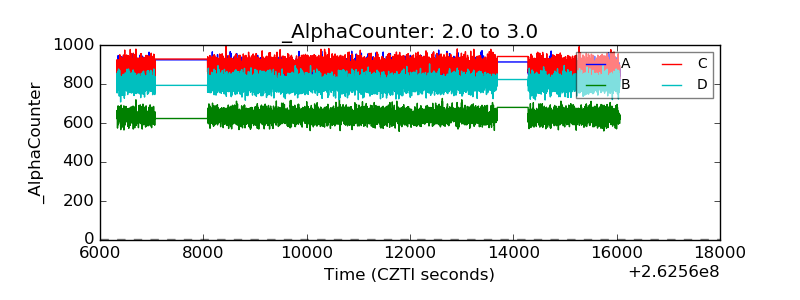 |
| _CPM_Rate | 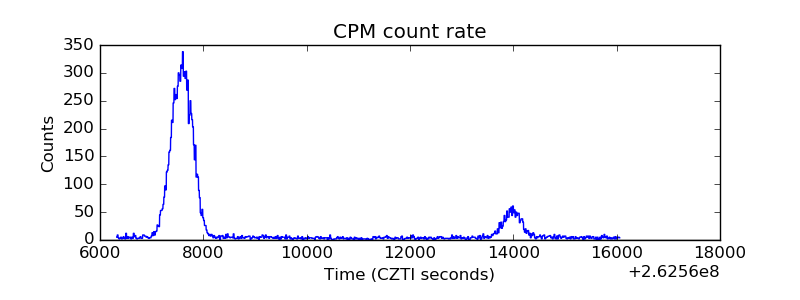 |
| CZT Counter |  |
| +2.5 Volts monitor |  |
| +5 Volts monitor |  |
| _ROLL_ROT |  |
| _Roll_DEC | 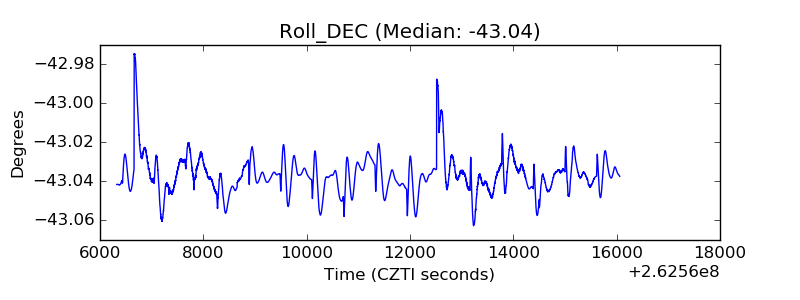 |
| _Roll_RA |  |
| Veto Counter |  |