| Param | Original file | Final file |
|---|---|---|
| Filename | modeM0/AS1A04_225T01_9000002062_13957cztM0_level2.evt | modeM0/AS1A04_225T01_9000002062_13957cztM0_level2_quad_clean.evt |
| Size (bytes) | 559,802,880 | 105,281,280 |
| Size | 533.9 MB | 100.4 MB |
| Events in quadrant A | 3,386,084 | 673,871 |
| Events in quadrant B | 3,608,022 | 699,522 |
| Events in quadrant C | 3,439,857 | 678,893 |
| Events in quadrant D | 6,022,830 | 625,914 |
| Mode SS | |||
|---|---|---|---|
| Quadrant | BADHDUFLAG | Total packets | Discarded packets |
| A | 0 | 150 | 0 |
| B | 0 | 150 | 0 |
| C | 0 | 150 | 0 |
| D | 0 | 150 | 0 |
| Mode M0 | |||
|---|---|---|---|
| Quadrant | BADHDUFLAG | Total packets | Discarded packets |
| A | 0 | 15189 | 3 |
| B | 0 | 15625 | 2 |
| C | 0 | 15046 | 2 |
| D | 0 | 23117 | 2 |
| Mode M9 | |||
|---|---|---|---|
| Quadrant | BADHDUFLAG | Total packets | Discarded packets |
| A | 0 | 1 | 0 |
| B | 0 | 1 | 0 |
| C | 0 | 1 | 0 |
| D | 0 | 1 | 0 |
| Quadrant | Total seconds | Saturated seconds | Saturation percentage |
|---|---|---|---|
| A | 7320 | 126 | 1.721311% |
| B | 7320 | 158 | 2.158470% |
| C | 7320 | 130 | 1.775956% |
| D | 7320 | 375 | 5.122951% |
Noise dominated data is calculated using 1-second bins in cleaned event files. If a bin has >2000 counts, and if more than 50% of those come from <1% of pixels, then it is considered to be noise-dominated and hence unusable.
| Quadrant | # 1 sec bins | Bins with >0 counts | Bins with >2000 counts | High rate bins dominated by noise | Noise dominated (total time) | Noise dominated (detector-on time) | Marked lightcurve |
|---|---|---|---|---|---|---|---|
| A | 7441 | 7324 | 16 | 16 | 0.22% | 0.22% | 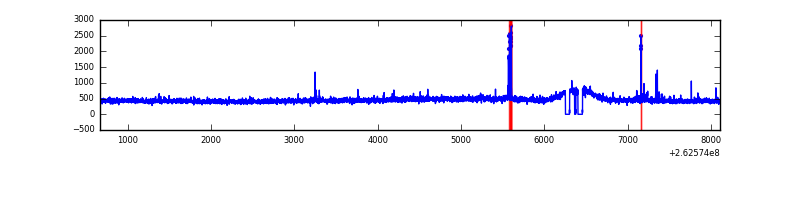 |
| B | 7441 | 7324 | 12 | 12 | 0.16% | 0.16% | 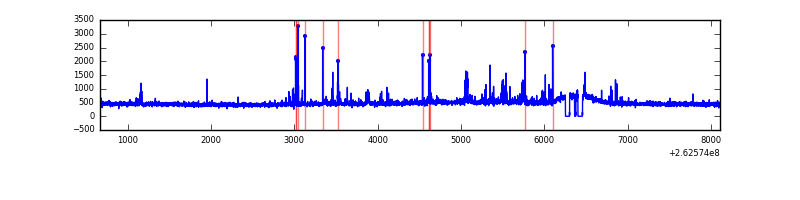 |
| C | 7441 | 7324 | 0 | 0 | 0.00% | 0.00% | 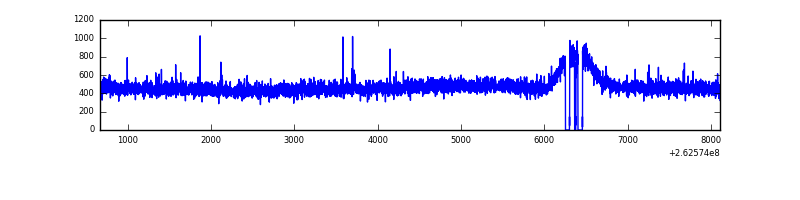 |
| D | 7441 | 7324 | 146 | 146 | 1.96% | 1.99% | 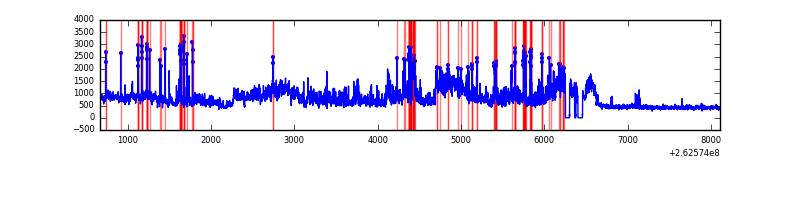 |
Top three noisy pixels from each quadrant. If the there are fewer than three noisy pixels in the level2.evt file, extra rows are filled as -1
| Pixel properties | Quadrant properties | ||||||
|---|---|---|---|---|---|---|---|
| Quadrant | DetID | PixID | Counts | Sigma | Mean | Median | Sigma |
| A | 15 | 69 | 46942 | 263.23 | 854 | 836 | 175.2 |
| A | 14 | 111 | 23677 | 130.4 | 854 | 836 | 175.2 |
| A | 1 | 162 | 16690 | 90.51 | 854 | 836 | 175.2 |
| B | 0 | 189 | 67396 | 409.03 | 863 | 838 | 162.7 |
| B | 4 | 80 | 35970 | 215.9 | 863 | 838 | 162.7 |
| B | 4 | 142 | 30028 | 179.39 | 863 | 838 | 162.7 |
| C | 3 | 233 | 124231 | 630.22 | 849 | 852 | 195.8 |
| C | 13 | 61 | 6161 | 27.12 | 849 | 852 | 195.8 |
| C | 8 | 128 | 4475 | 18.51 | 849 | 852 | 195.8 |
| D | 13 | 122 | 1224757 | 6144.86 | 820 | 799 | 199.2 |
| D | 10 | 157 | 676827 | 3393.99 | 820 | 799 | 199.2 |
| D | 12 | 110 | 374726 | 1877.29 | 820 | 799 | 199.2 |
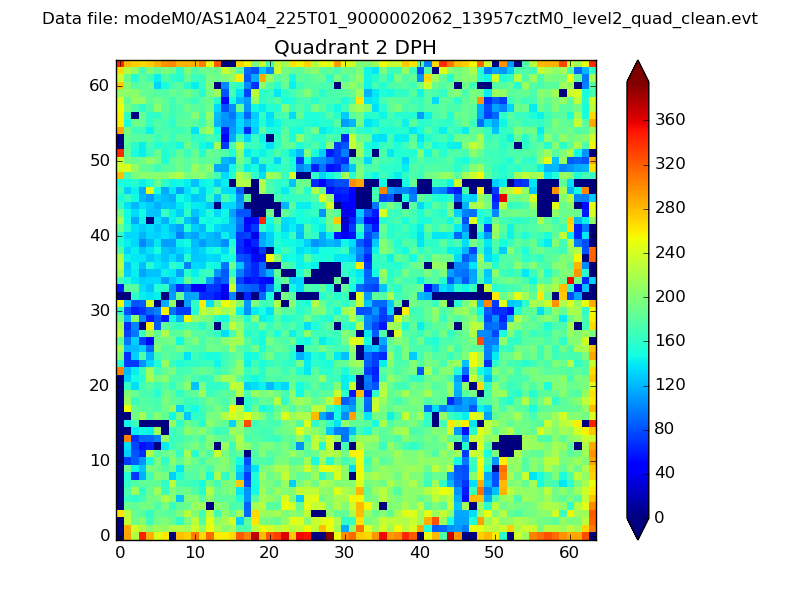
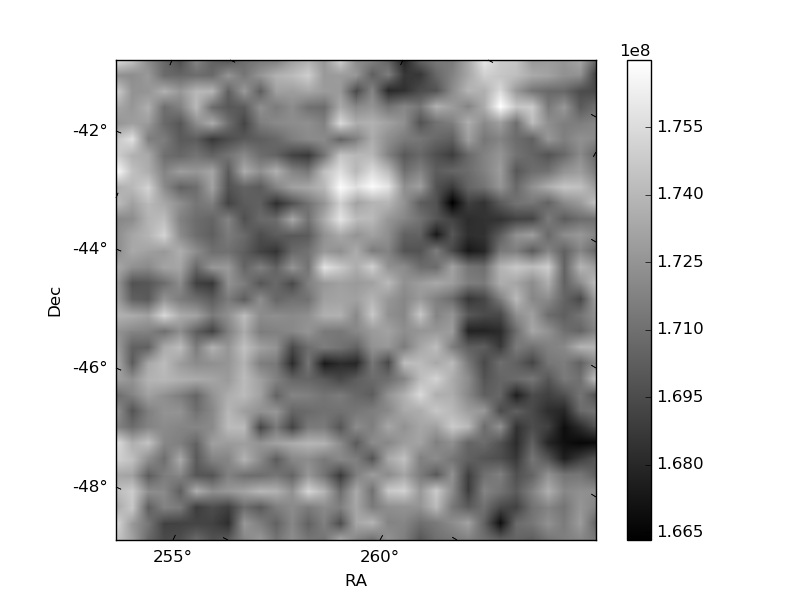
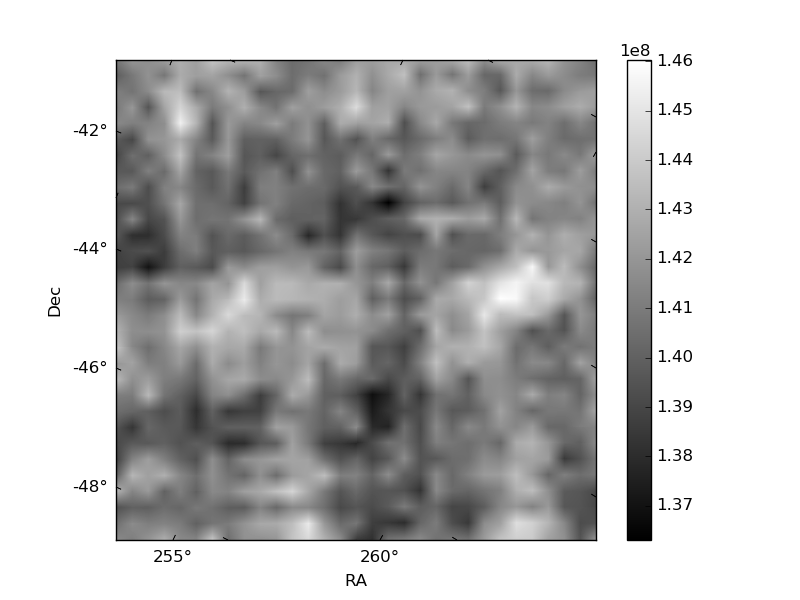
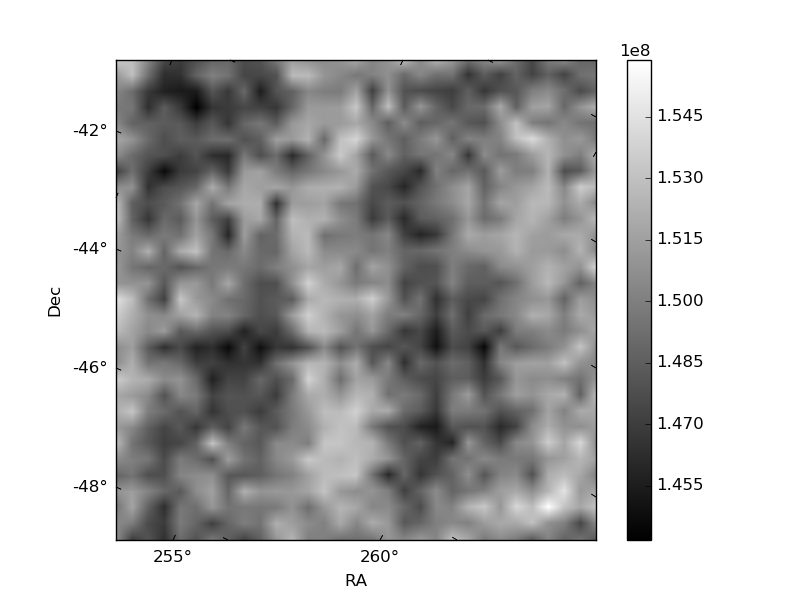
Histogram calculated using DETX and DETY for each event in the final _common_clean file
| Quadrant A | 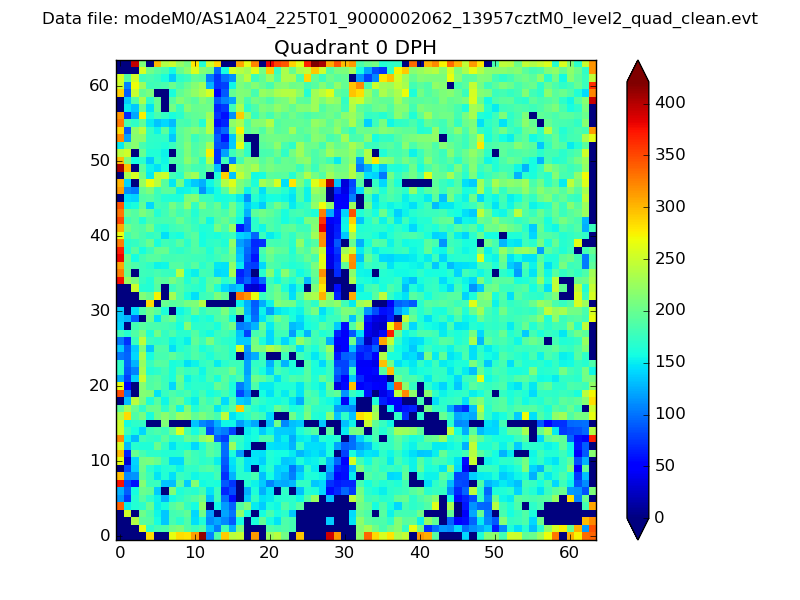 |
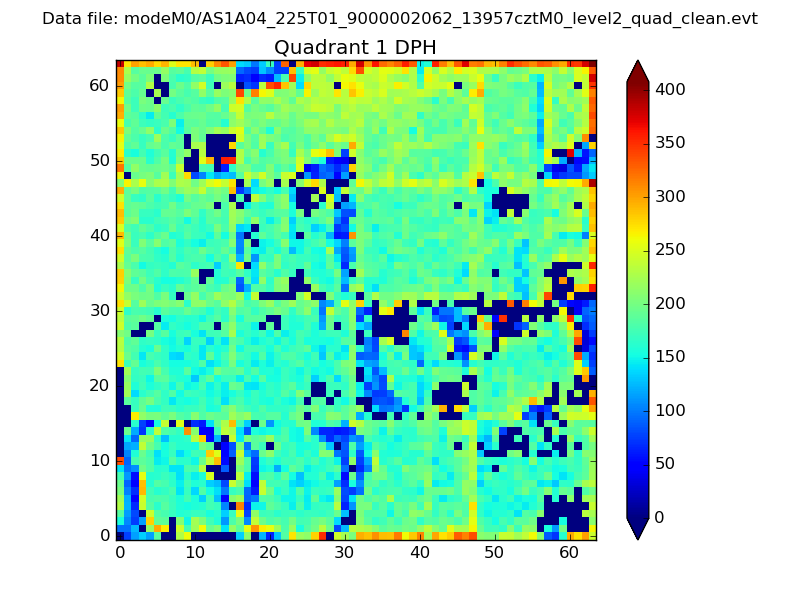 |
Quadrant B |
|---|---|---|---|
| Quadrant D | 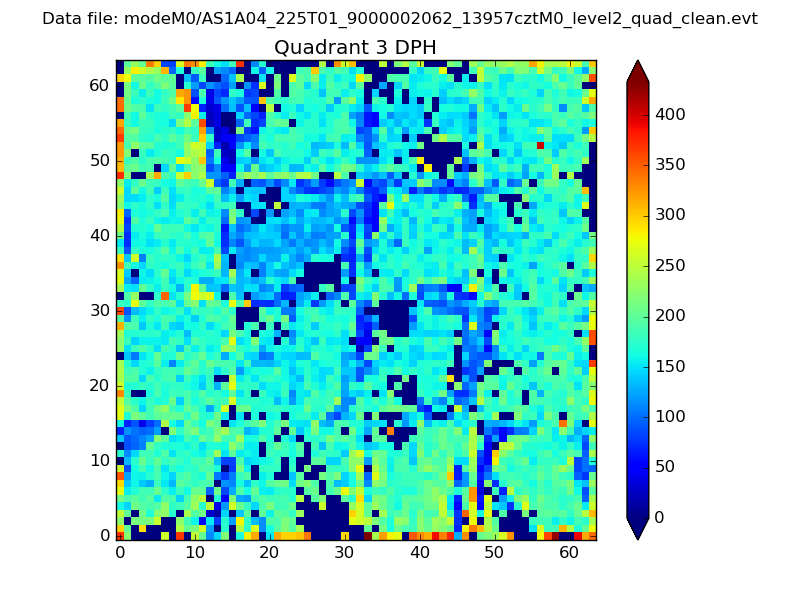 |
 |
Quadrant C |
| Plot type | Count rate plots | Images |
|---|---|---|
| Comparison with Poisson distribution Blue bars denote a histogram of data divided into 1 sec bins. Red curve is a Poisson curve with rate = median count rate of data. |
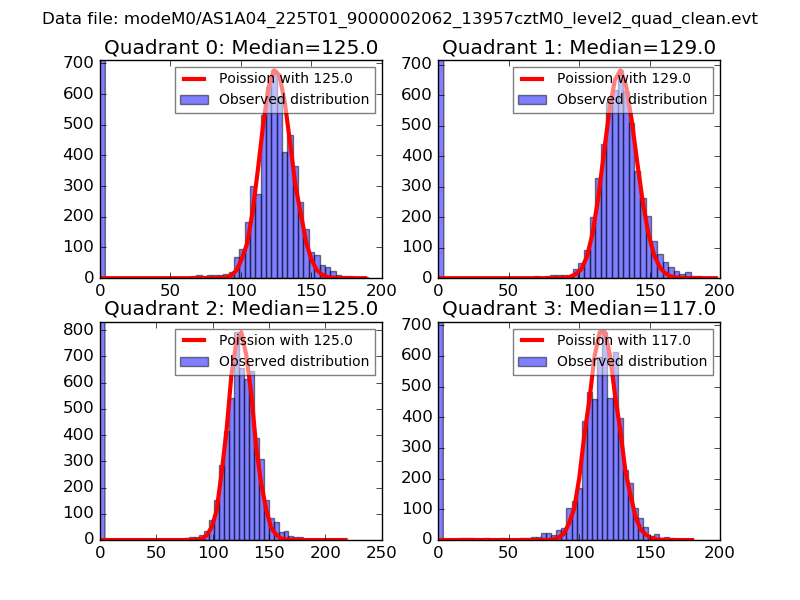 |
 |
| Quadrant-wise count rates Data is divided into 100 sec bins |
 |
|
| Module-wise count rates for Quadrant A Data is divided into 100 sec bins |
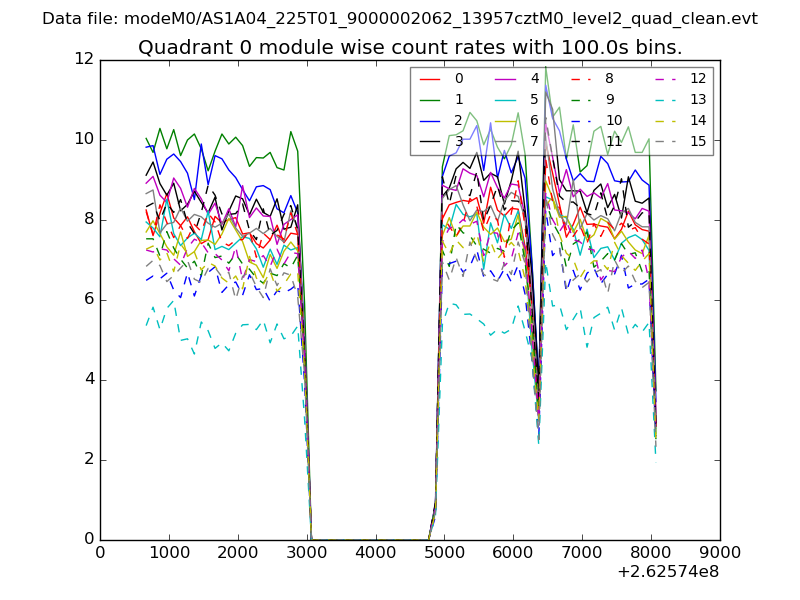 |
 |
| Module-wise count rates for Quadrant B Data is divided into 100 sec bins |
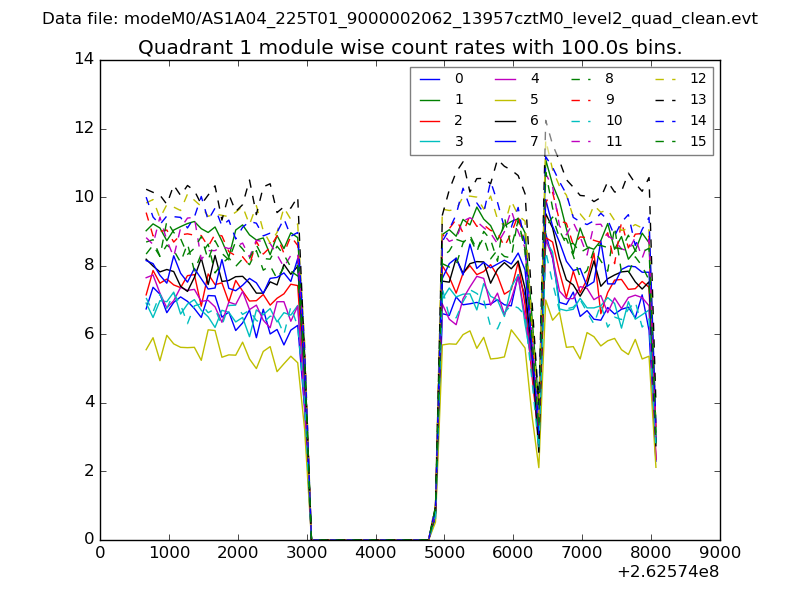 |
 |
| Module-wise count rates for Quadrant C Data is divided into 100 sec bins |
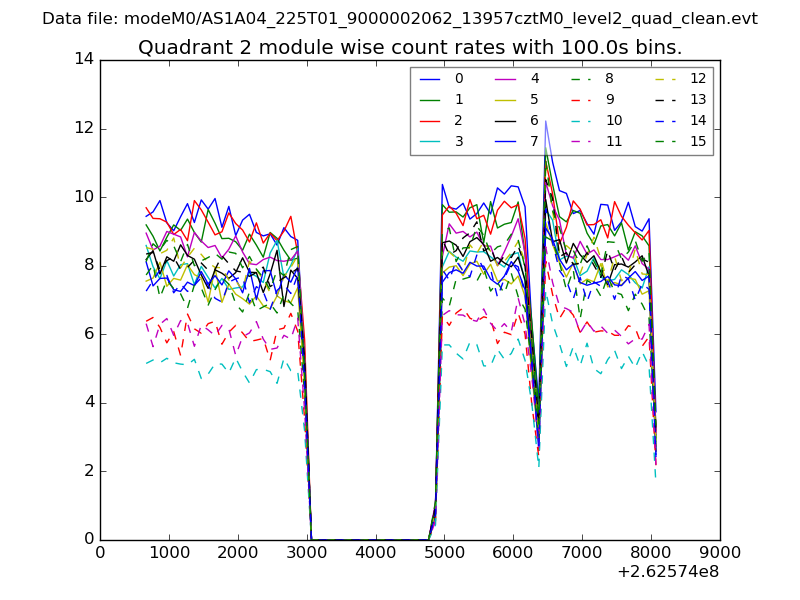 |
 |
| Module-wise count rates for Quadrant D Data is divided into 100 sec bins |
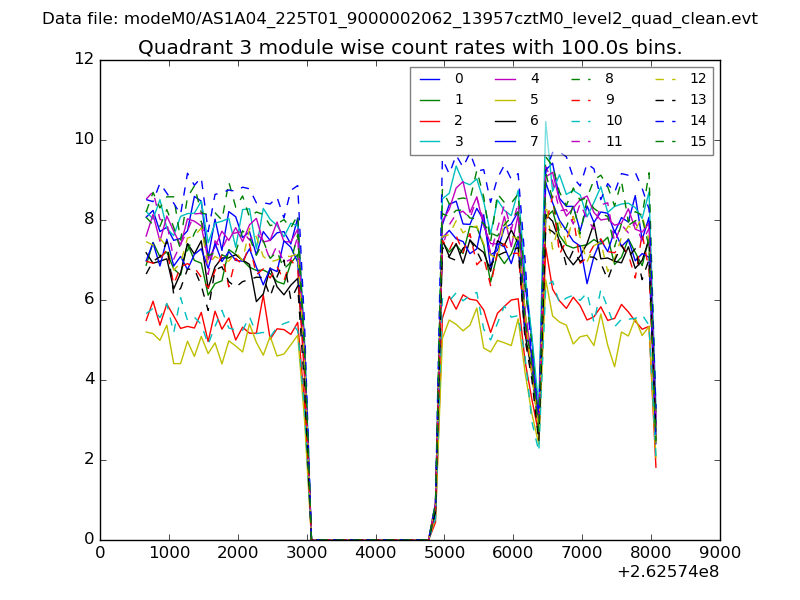 |
 |
| Parameter | Plot |
|---|---|
| CZT HV Monitor | 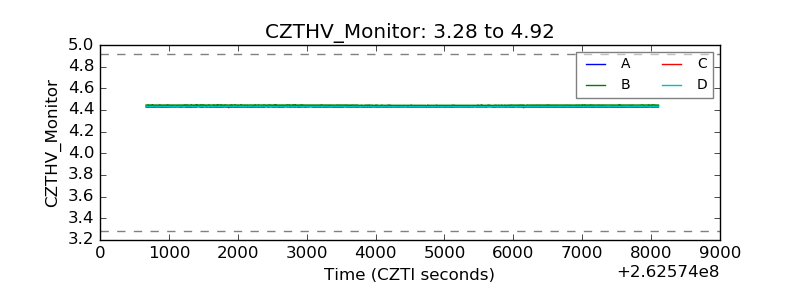 |
| D_VDD | 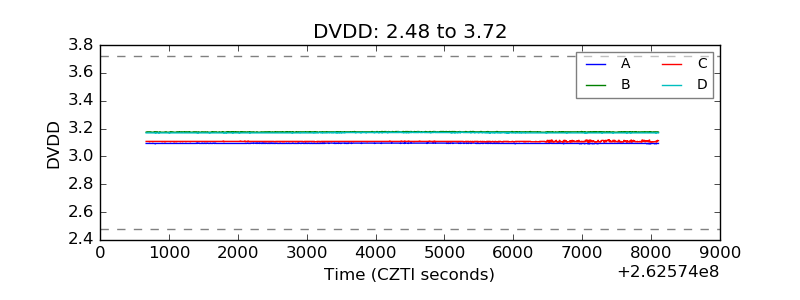 |
| Temperature 1 | 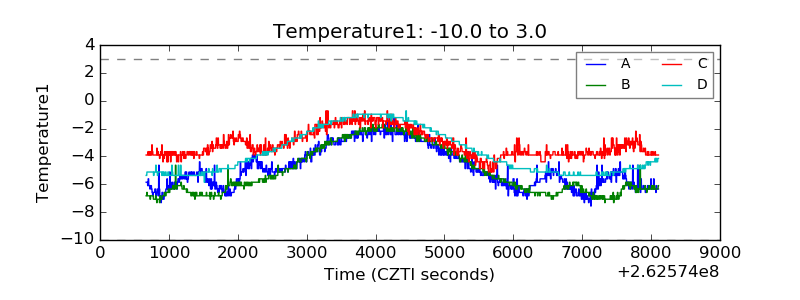 |
| Veto HV Monitor | 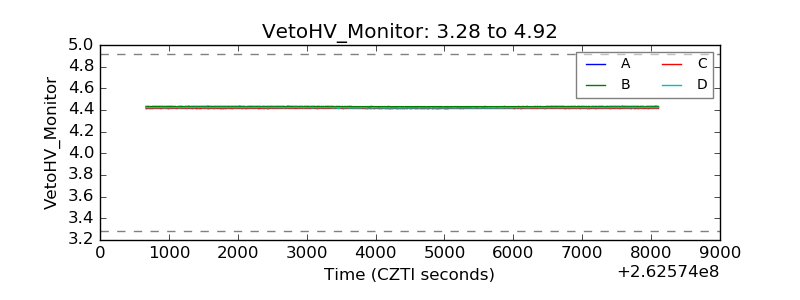 |
| Veto LLD | 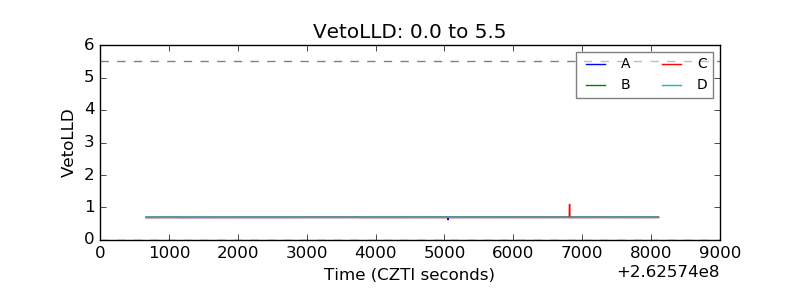 |
| Alpha Counter | 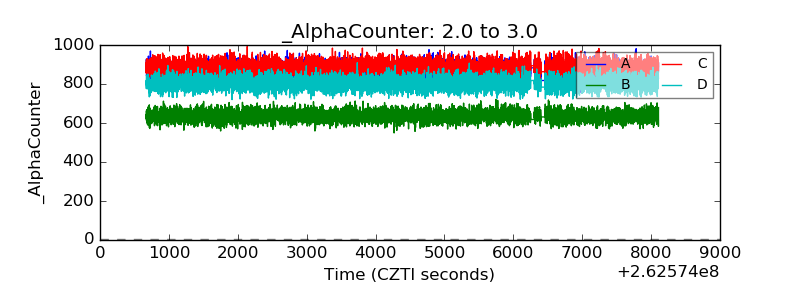 |
| _CPM_Rate | 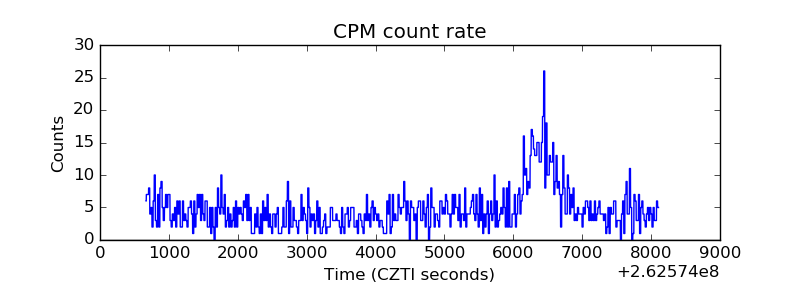 |
| CZT Counter |  |
| +2.5 Volts monitor |  |
| +5 Volts monitor |  |
| _ROLL_ROT | 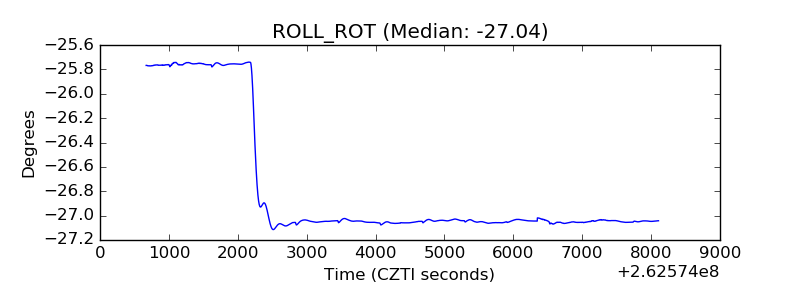 |
| _Roll_DEC | 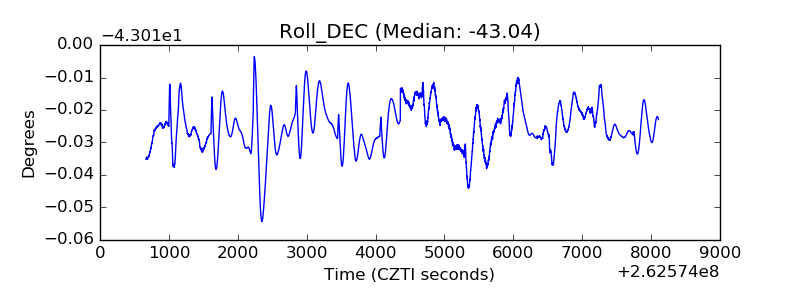 |
| _Roll_RA |  |
| Veto Counter | 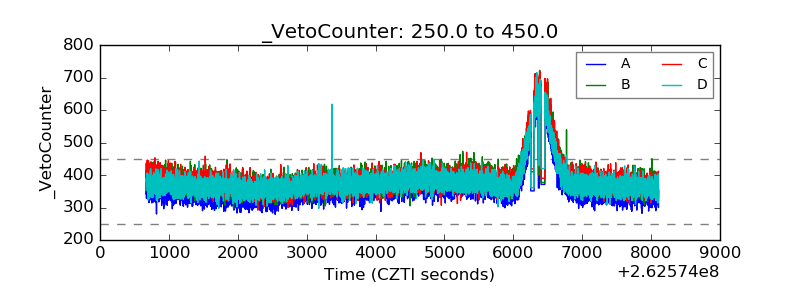 |