| Param | Original file | Final file |
|---|---|---|
| Filename | modeM0/AS1A04_225T01_9000002062_13962cztM0_level2.evt | modeM0/AS1A04_225T01_9000002062_13962cztM0_level2_quad_clean.evt |
| Size (bytes) | 2,390,544,000 | 404,447,040 |
| Size | 2.2 GB | 385.7 MB |
| Events in quadrant A | 17,570,754 | 2,519,375 |
| Events in quadrant B | 15,624,136 | 2,611,053 |
| Events in quadrant C | 15,087,477 | 2,546,280 |
| Events in quadrant D | 21,990,482 | 2,408,394 |
| Mode SS | |||
|---|---|---|---|
| Quadrant | BADHDUFLAG | Total packets | Discarded packets |
| A | 0 | 640 | 0 |
| B | 0 | 640 | 0 |
| C | 0 | 640 | 0 |
| D | 0 | 640 | 0 |
| Mode M0 | |||
|---|---|---|---|
| Quadrant | BADHDUFLAG | Total packets | Discarded packets |
| A | 0 | 73305 | 8 |
| B | 0 | 67006 | 7 |
| C | 0 | 65115 | 7 |
| D | 0 | 86479 | 7 |
| Mode M9 | |||
|---|---|---|---|
| Quadrant | BADHDUFLAG | Total packets | Discarded packets |
| A | 0 | 28 | 0 |
| B | 0 | 28 | 0 |
| C | 0 | 28 | 0 |
| D | 0 | 28 | 0 |
| Quadrant | Total seconds | Saturated seconds | Saturation percentage |
|---|---|---|---|
| A | 31491 | 1524 | 4.839478% |
| B | 31491 | 822 | 2.610270% |
| C | 31491 | 585 | 1.857674% |
| D | 31491 | 1604 | 5.093519% |
Noise dominated data is calculated using 1-second bins in cleaned event files. If a bin has >2000 counts, and if more than 50% of those come from <1% of pixels, then it is considered to be noise-dominated and hence unusable.
| Quadrant | # 1 sec bins | Bins with >0 counts | Bins with >2000 counts | High rate bins dominated by noise | Noise dominated (total time) | Noise dominated (detector-on time) | Marked lightcurve |
|---|---|---|---|---|---|---|---|
| A | 34297 | 31501 | 724 | 724 | 2.11% | 2.30% | 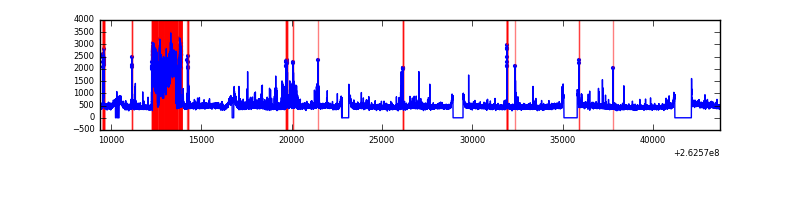 |
| B | 34297 | 31501 | 113 | 113 | 0.33% | 0.36% | 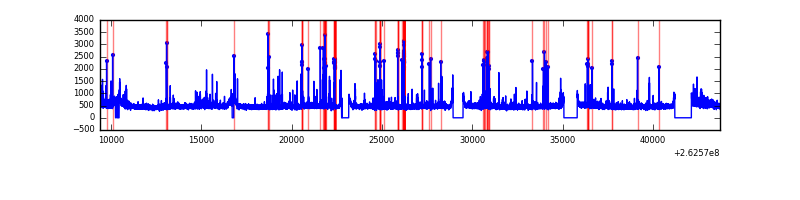 |
| C | 34297 | 31501 | 6 | 6 | 0.02% | 0.02% | 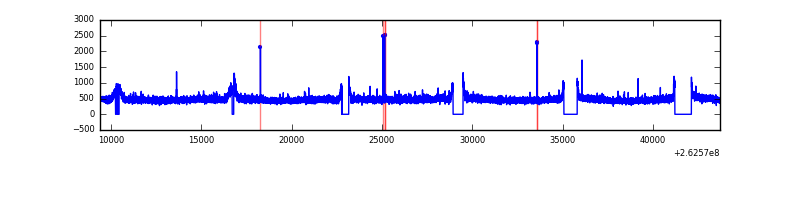 |
| D | 34297 | 31501 | 869 | 869 | 2.53% | 2.76% | 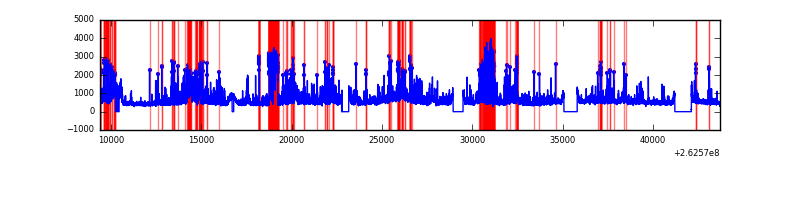 |
Top three noisy pixels from each quadrant. If the there are fewer than three noisy pixels in the level2.evt file, extra rows are filled as -1
| Pixel properties | Quadrant properties | ||||||
|---|---|---|---|---|---|---|---|
| Quadrant | DetID | PixID | Counts | Sigma | Mean | Median | Sigma |
| A | 14 | 111 | 2945979 | 3933.34 | 3688 | 3597 | 748.1 |
| A | 15 | 222 | 140631 | 183.18 | 3688 | 3597 | 748.1 |
| A | 15 | 69 | 97433 | 125.44 | 3688 | 3597 | 748.1 |
| B | 3 | 64 | 238940 | 334.59 | 3734 | 3626 | 703.3 |
| B | 4 | 80 | 215811 | 301.7 | 3734 | 3626 | 703.3 |
| B | 3 | 209 | 153744 | 213.45 | 3734 | 3626 | 703.3 |
| C | 3 | 233 | 782404 | 922.19 | 3658 | 3668 | 844.4 |
| C | 13 | 61 | 26179 | 26.66 | 3658 | 3668 | 844.4 |
| C | 14 | 234 | 22516 | 22.32 | 3658 | 3668 | 844.4 |
| D | 13 | 122 | 3300845 | 3472.55 | 3549 | 3482 | 949.6 |
| D | 1 | 52 | 1767153 | 1857.37 | 3549 | 3482 | 949.6 |
| D | 7 | 80 | 1100134 | 1154.92 | 3549 | 3482 | 949.6 |
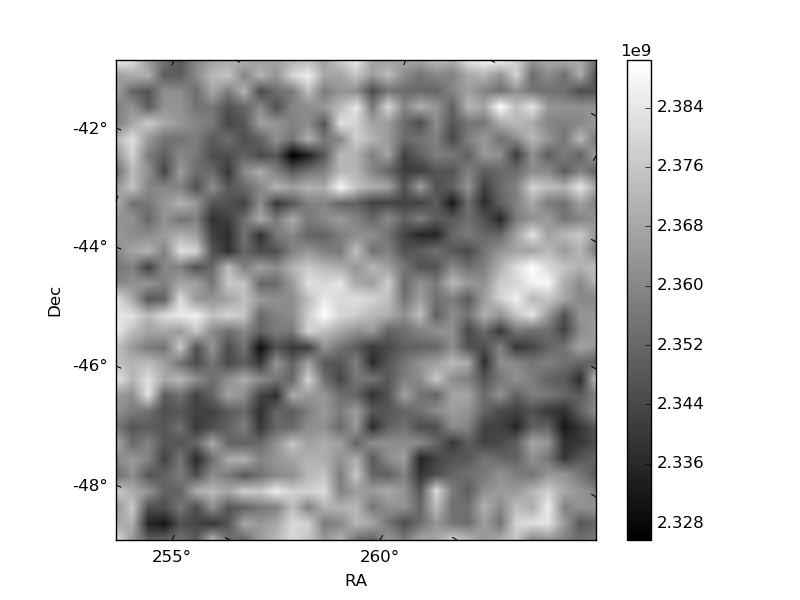
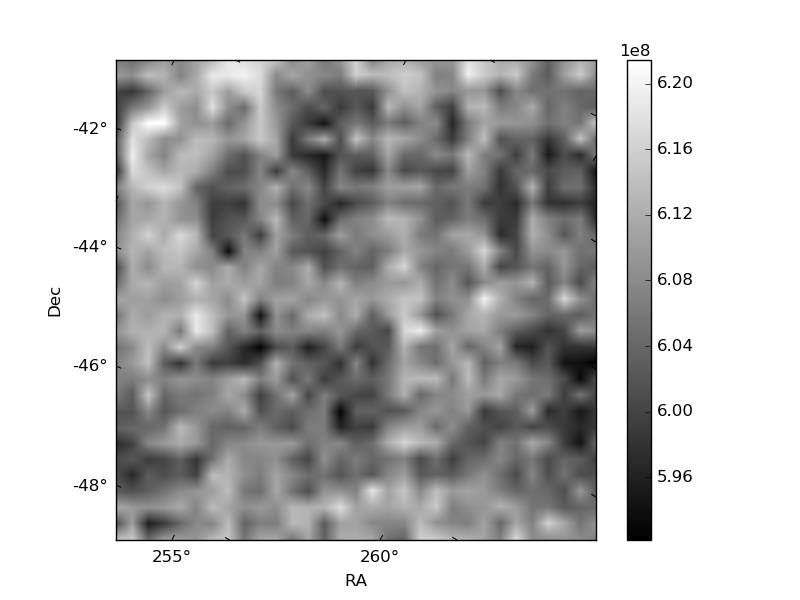
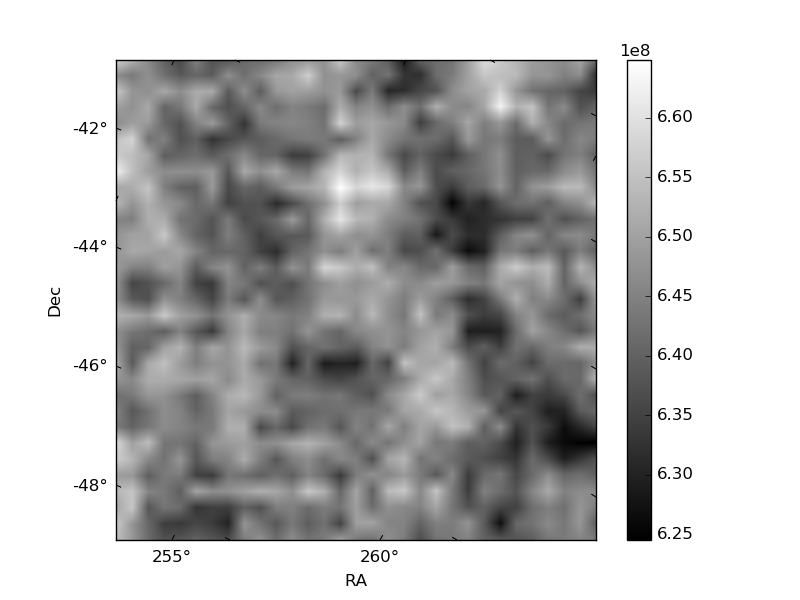
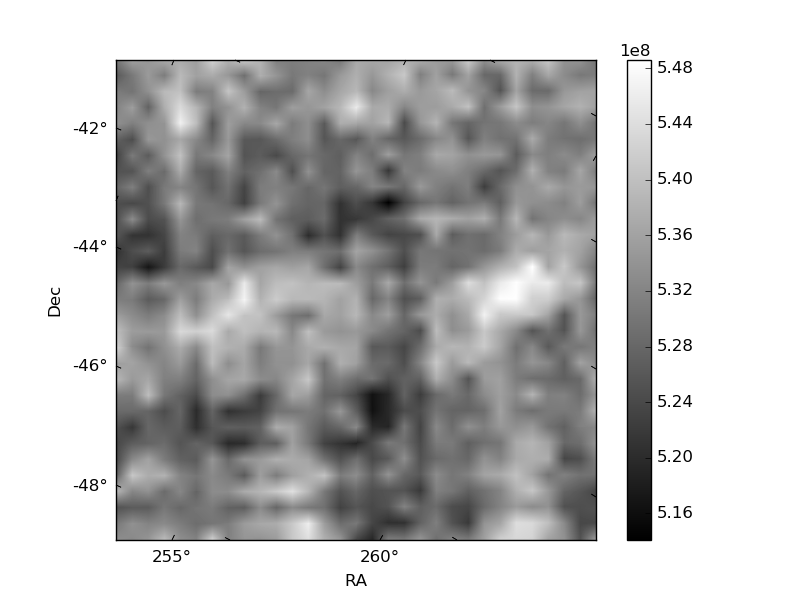
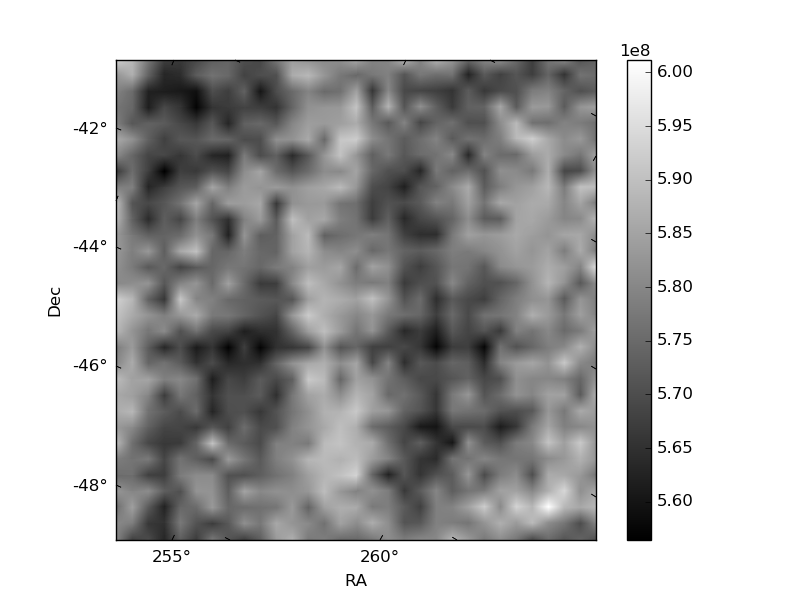
Histogram calculated using DETX and DETY for each event in the final _common_clean file
| Quadrant A | 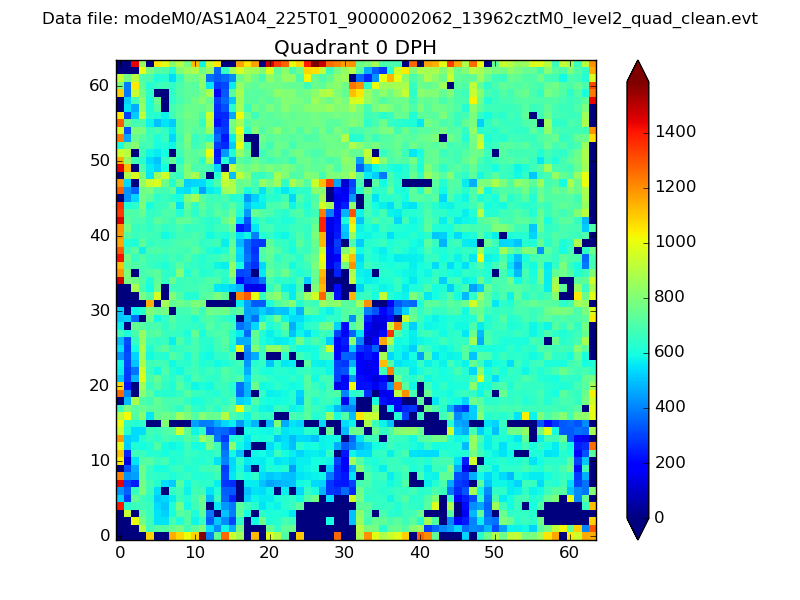 |
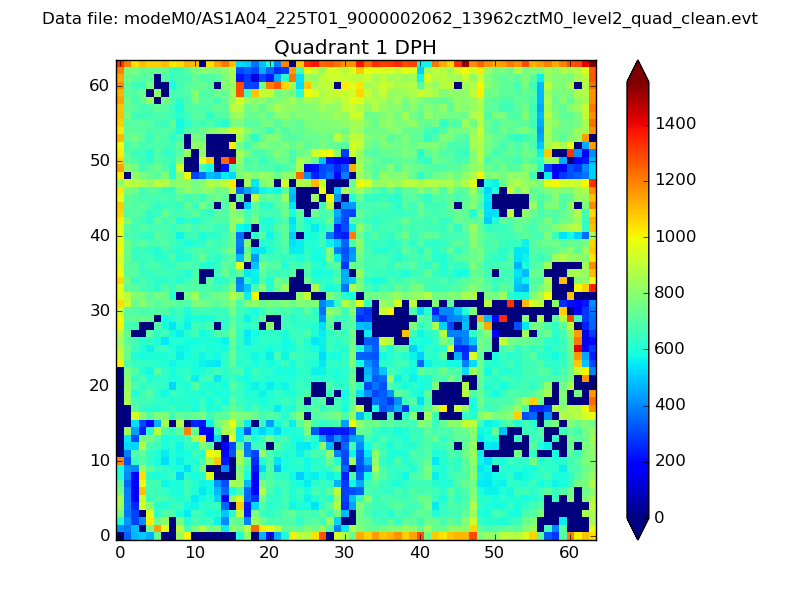 |
Quadrant B |
|---|---|---|---|
| Quadrant D | 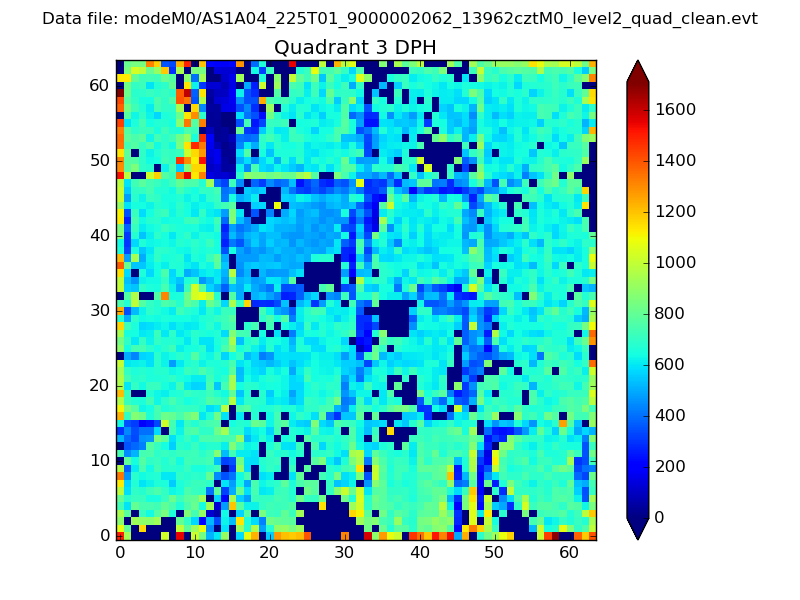 |
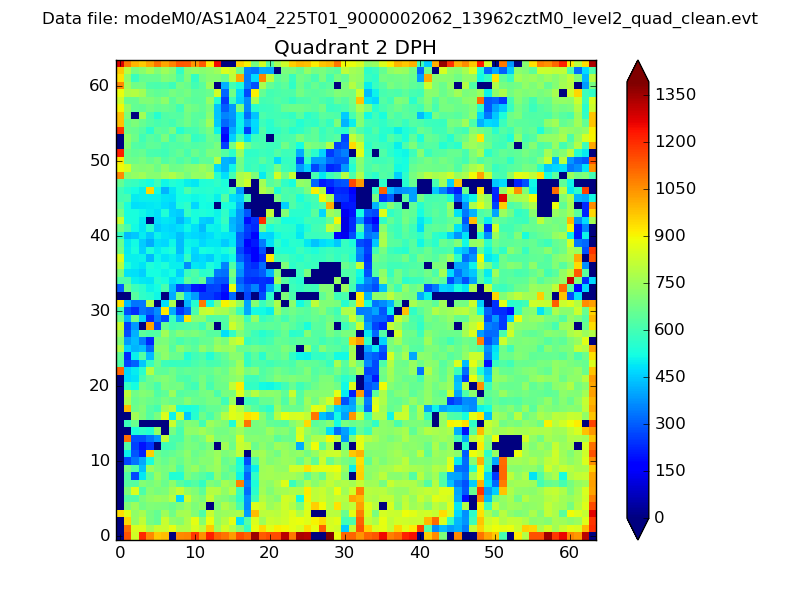 |
Quadrant C |
| Plot type | Count rate plots | Images |
|---|---|---|
| Comparison with Poisson distribution Blue bars denote a histogram of data divided into 1 sec bins. Red curve is a Poisson curve with rate = median count rate of data. |
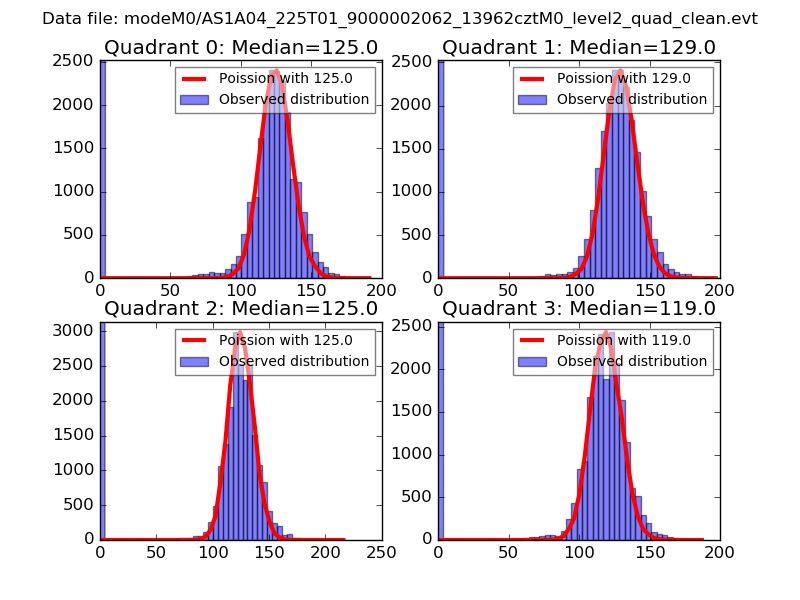 |
 |
| Quadrant-wise count rates Data is divided into 100 sec bins |
 |
|
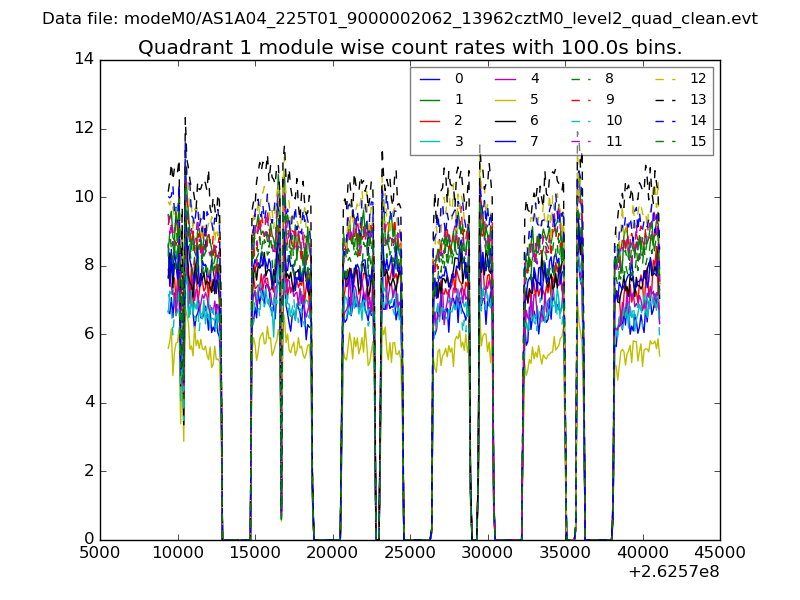
| Module-wise count rates for Quadrant A Data is divided into 100 sec bins |
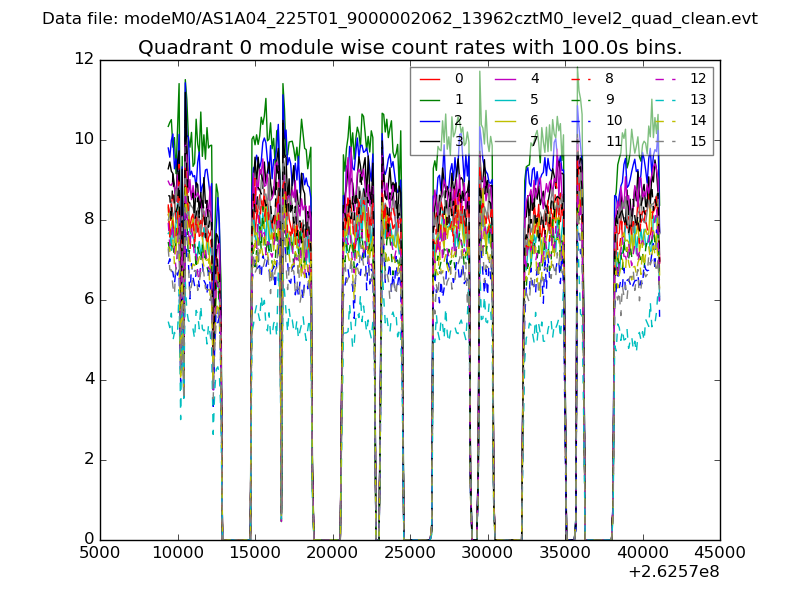 |
 |
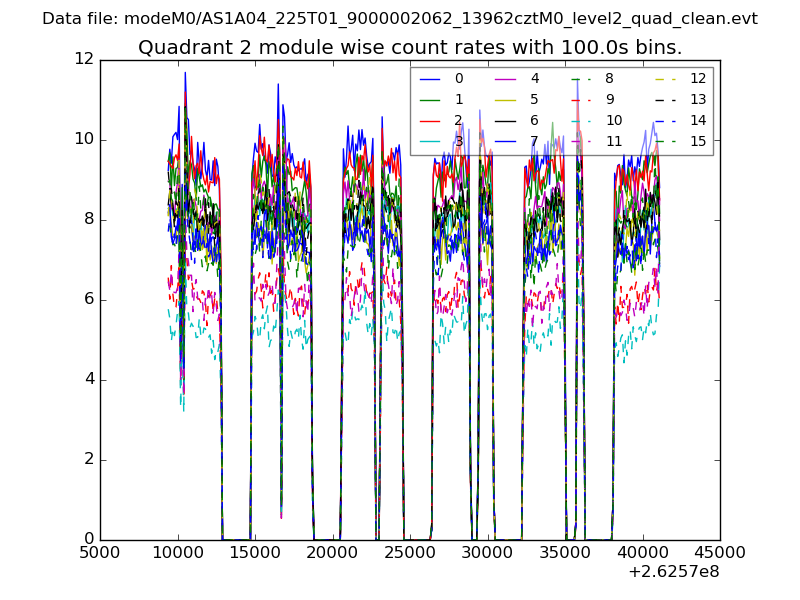
| Module-wise count rates for Quadrant B Data is divided into 100 sec bins |
 |
 |
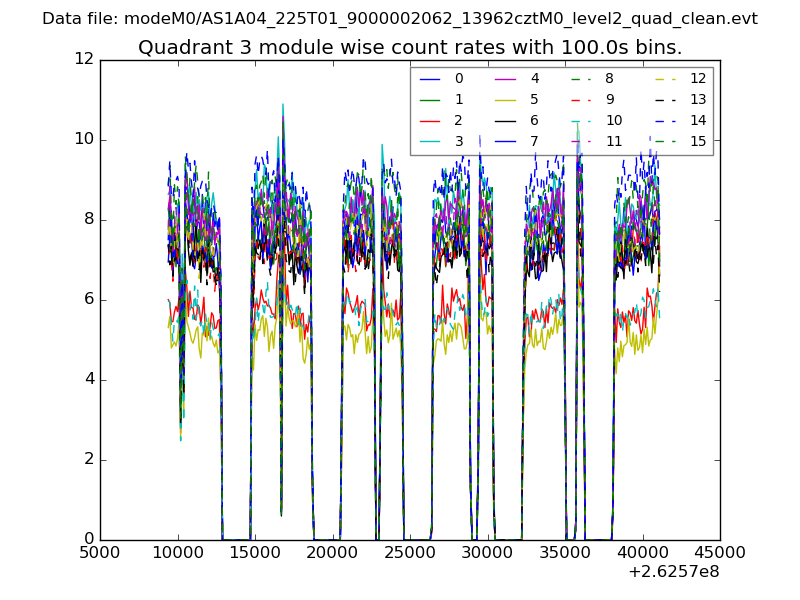
| Module-wise count rates for Quadrant C Data is divided into 100 sec bins |
 |
 |
| Module-wise count rates for Quadrant D Data is divided into 100 sec bins |
 |
 |
| Parameter | Plot |
|---|---|
| CZT HV Monitor | 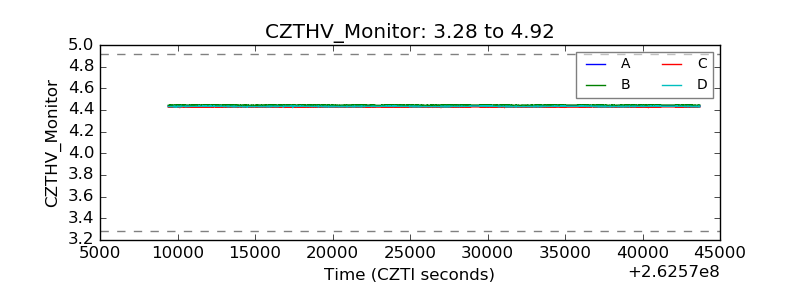 |
| D_VDD | 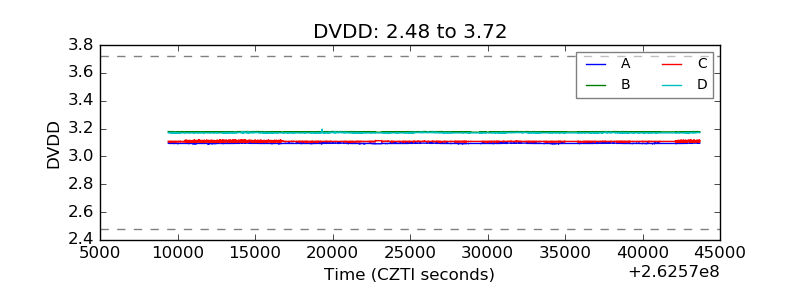 |
| Temperature 1 | 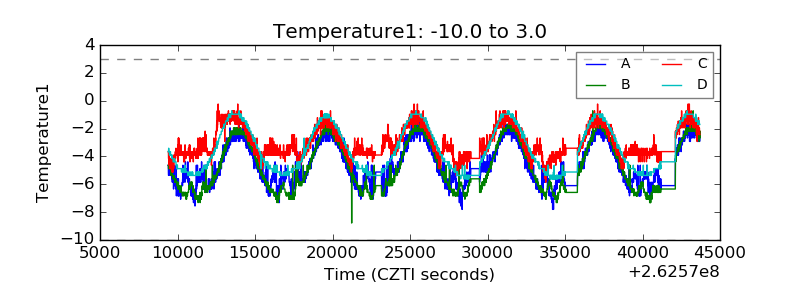 |
| Veto HV Monitor | 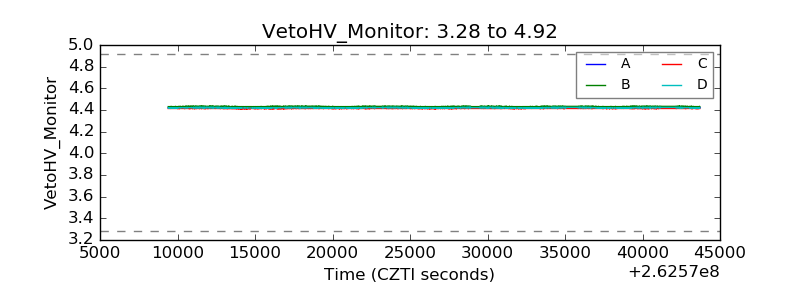 |
| Veto LLD | 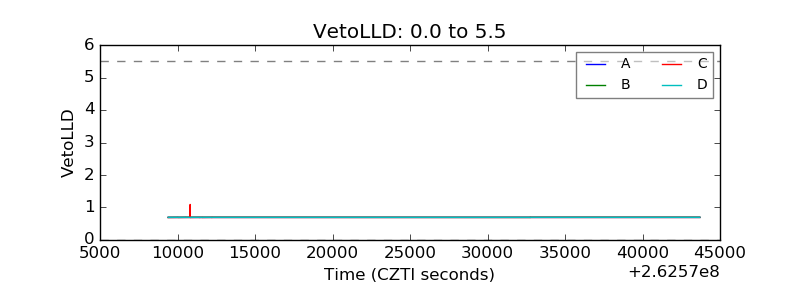 |
| Alpha Counter | 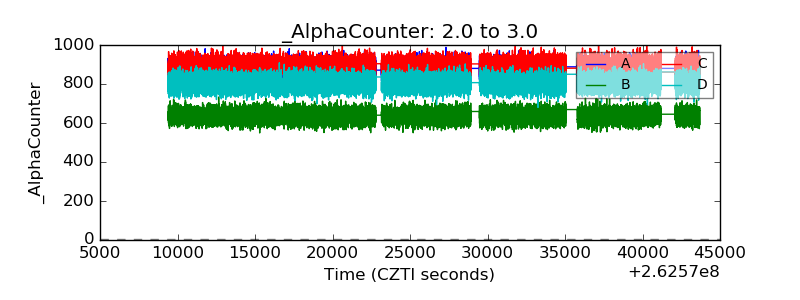 |
| _CPM_Rate | 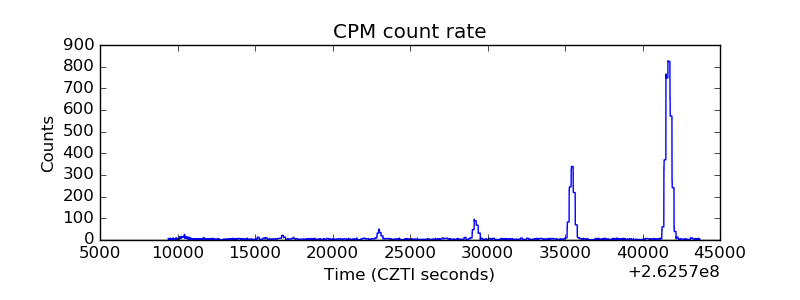 |
| CZT Counter | 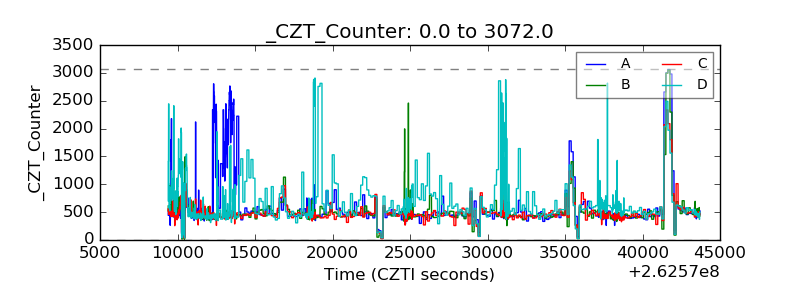 |
| +2.5 Volts monitor |  |
| +5 Volts monitor |  |
| _ROLL_ROT | 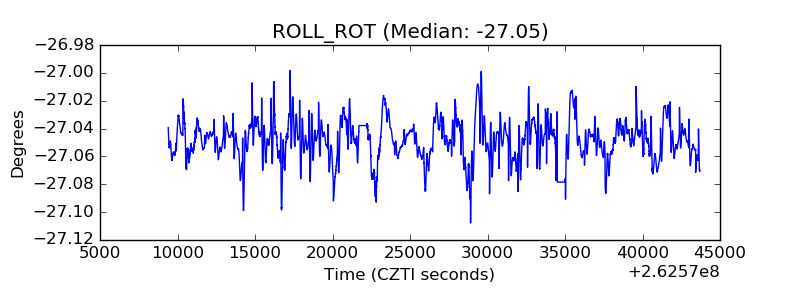 |
| _Roll_DEC | 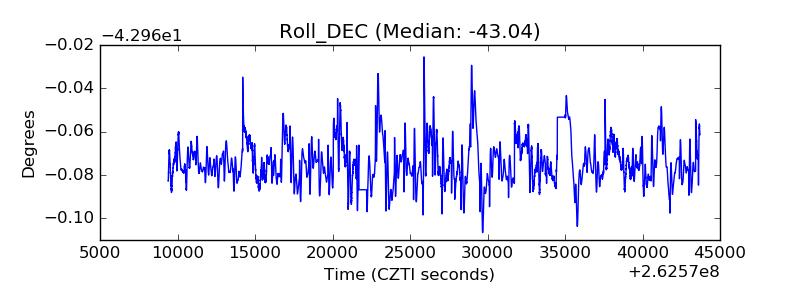 |
| _Roll_RA | 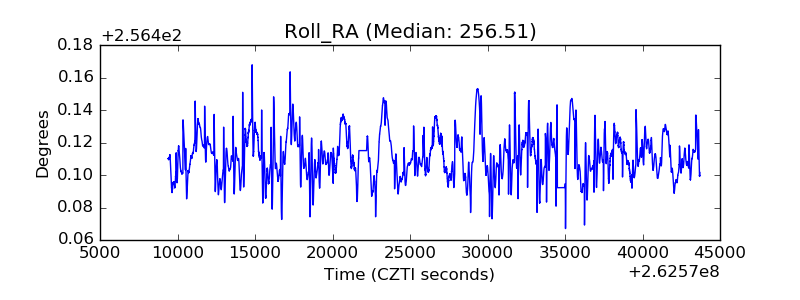 |
| Veto Counter | 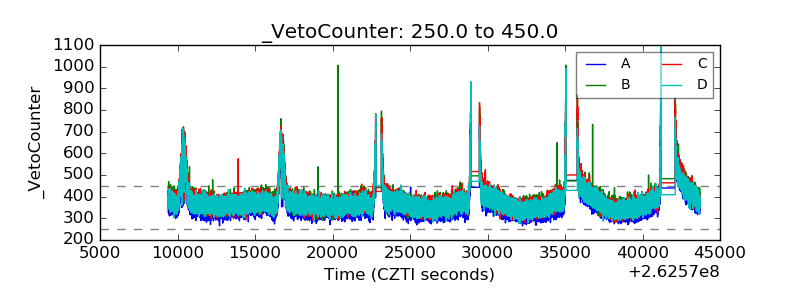 |