| Param | Original file | Final file |
|---|---|---|
| Filename | modeM0/AS1A04_225T01_9000002062_13965cztM0_level2.evt | modeM0/AS1A04_225T01_9000002062_13965cztM0_level2_quad_clean.evt |
| Size (bytes) | 463,910,400 | 82,134,720 |
| Size | 442.4 MB | 78.3 MB |
| Events in quadrant A | 3,337,246 | 515,375 |
| Events in quadrant B | 3,430,345 | 527,035 |
| Events in quadrant C | 3,216,862 | 509,537 |
| Events in quadrant D | 3,629,629 | 487,980 |
| Mode SS | |||
|---|---|---|---|
| Quadrant | BADHDUFLAG | Total packets | Discarded packets |
| A | 0 | 130 | 0 |
| B | 0 | 130 | 0 |
| C | 0 | 130 | 0 |
| D | 0 | 130 | 0 |
| Mode M0 | |||
|---|---|---|---|
| Quadrant | BADHDUFLAG | Total packets | Discarded packets |
| A | 0 | 14191 | 3 |
| B | 0 | 14379 | 2 |
| C | 0 | 13762 | 2 |
| D | 0 | 15120 | 2 |
| Mode M9 | |||
|---|---|---|---|
| Quadrant | BADHDUFLAG | Total packets | Discarded packets |
| A | 0 | 21 | 0 |
| B | 0 | 21 | 0 |
| C | 0 | 21 | 0 |
| D | 0 | 21 | 0 |
| Quadrant | Total seconds | Saturated seconds | Saturation percentage |
|---|---|---|---|
| A | 6404 | 95 | 1.483448% |
| B | 6404 | 95 | 1.483448% |
| C | 6404 | 73 | 1.139913% |
| D | 6404 | 149 | 2.326671% |
Noise dominated data is calculated using 1-second bins in cleaned event files. If a bin has >2000 counts, and if more than 50% of those come from <1% of pixels, then it is considered to be noise-dominated and hence unusable.
| Quadrant | # 1 sec bins | Bins with >0 counts | Bins with >2000 counts | High rate bins dominated by noise | Noise dominated (total time) | Noise dominated (detector-on time) | Marked lightcurve |
|---|---|---|---|---|---|---|---|
| A | 7580 | 6406 | 0 | 0 | 0.00% | 0.00% | 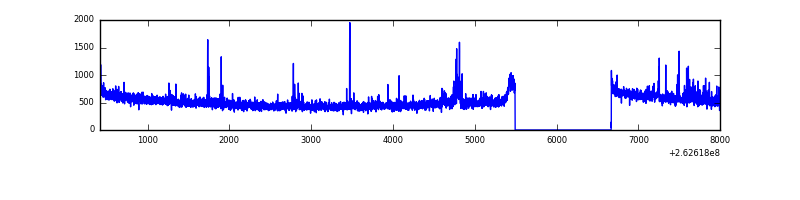 |
| B | 7580 | 6406 | 6 | 6 | 0.08% | 0.09% | 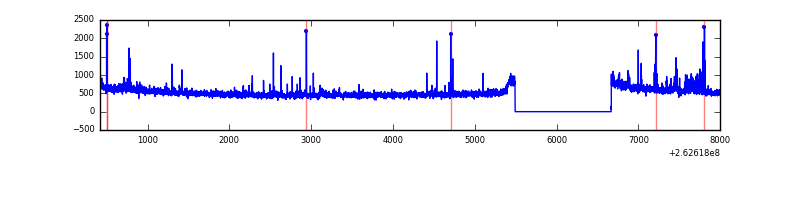 |
| C | 7580 | 6406 | 0 | 0 | 0.00% | 0.00% | 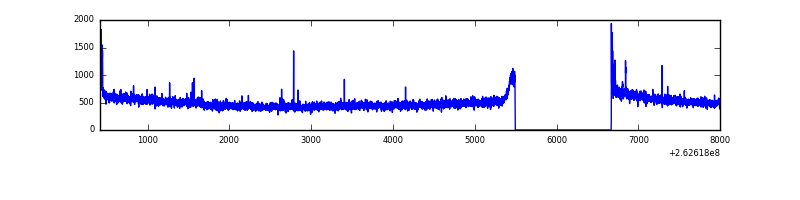 |
| D | 7580 | 6406 | 75 | 75 | 0.99% | 1.17% | 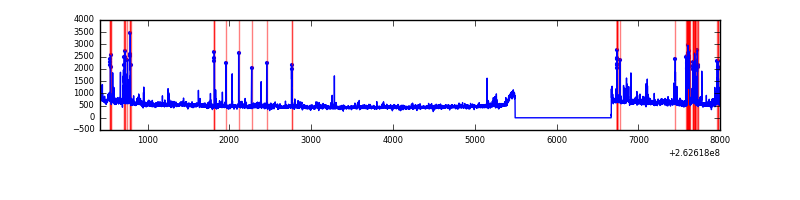 |
Top three noisy pixels from each quadrant. If the there are fewer than three noisy pixels in the level2.evt file, extra rows are filled as -1
| Pixel properties | Quadrant properties | ||||||
|---|---|---|---|---|---|---|---|
| Quadrant | DetID | PixID | Counts | Sigma | Mean | Median | Sigma |
| A | 8 | 15 | 61276 | 363.26 | 824 | 807 | 166.5 |
| A | 14 | 111 | 58375 | 345.83 | 824 | 807 | 166.5 |
| A | 1 | 162 | 17710 | 101.54 | 824 | 807 | 166.5 |
| B | 0 | 189 | 81052 | 520.71 | 826 | 808 | 154.1 |
| B | 3 | 209 | 26714 | 168.11 | 826 | 808 | 154.1 |
| B | 0 | 190 | 25851 | 162.51 | 826 | 808 | 154.1 |
| C | 3 | 233 | 106199 | 580.94 | 792 | 795 | 181.4 |
| C | 8 | 222 | 15963 | 83.6 | 792 | 795 | 181.4 |
| C | 13 | 61 | 5785 | 27.5 | 792 | 795 | 181.4 |
| D | 15 | 0 | 143707 | 707.77 | 778 | 763 | 202.0 |
| D | 8 | 195 | 108955 | 535.7 | 778 | 763 | 202.0 |
| D | 13 | 189 | 99977 | 491.24 | 778 | 763 | 202.0 |
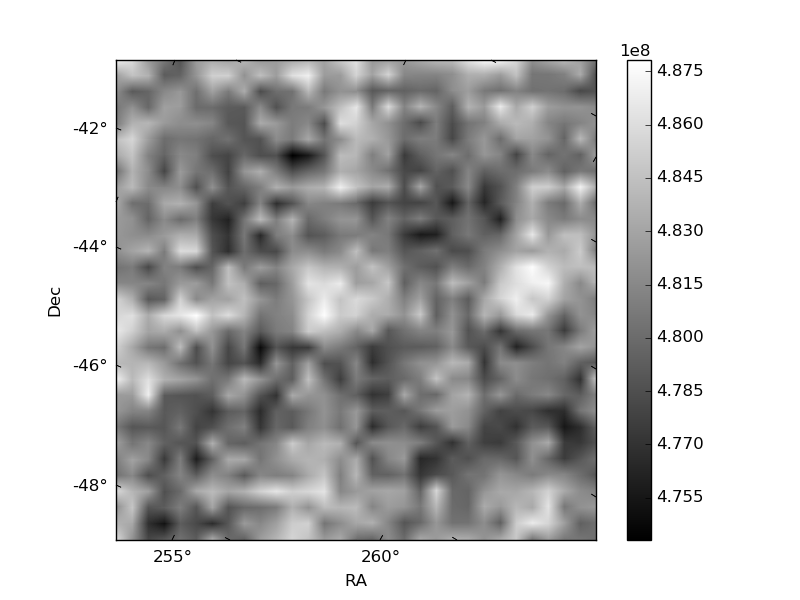
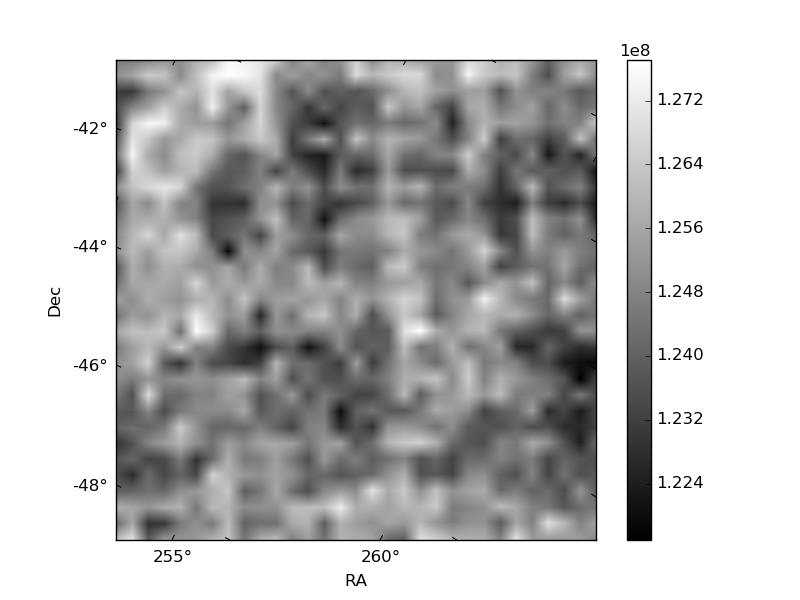
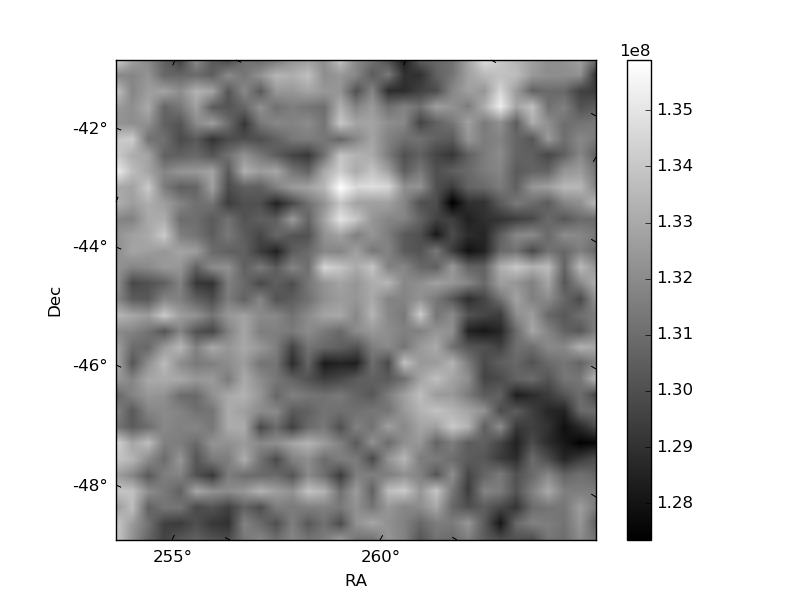
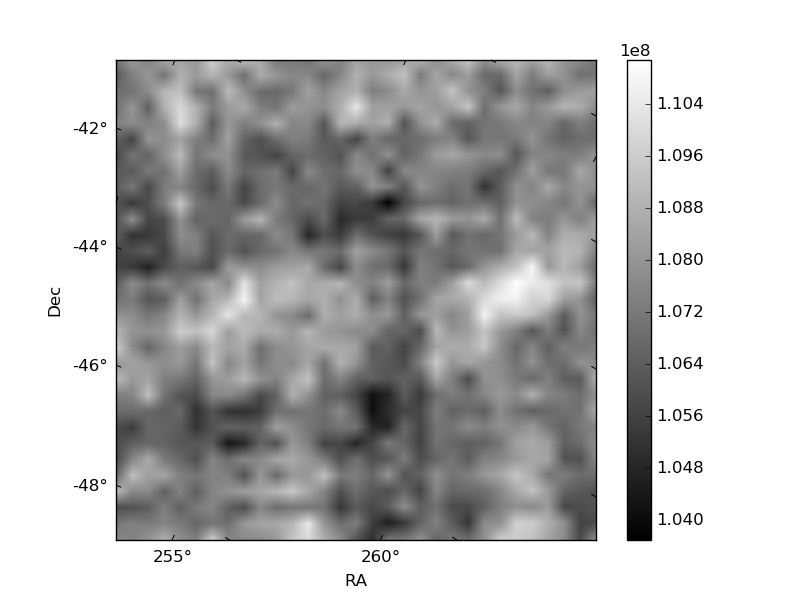
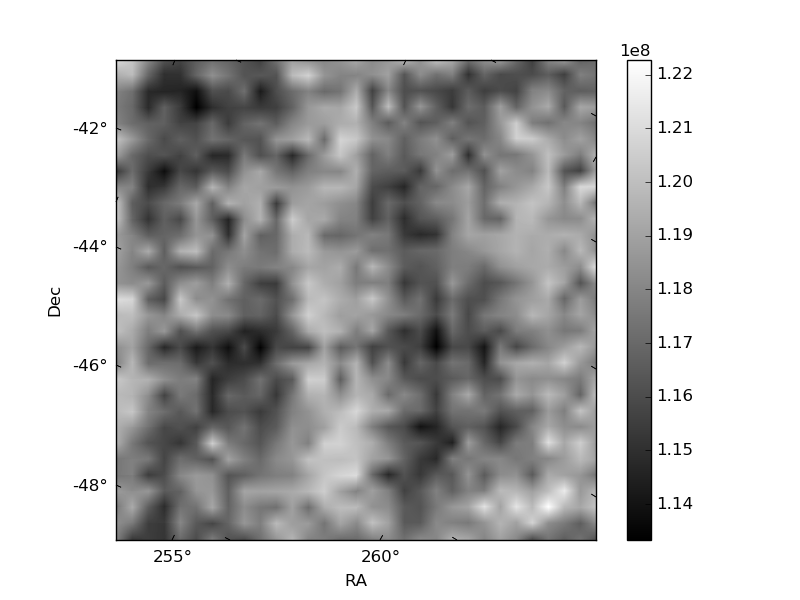
Histogram calculated using DETX and DETY for each event in the final _common_clean file
| Quadrant A | 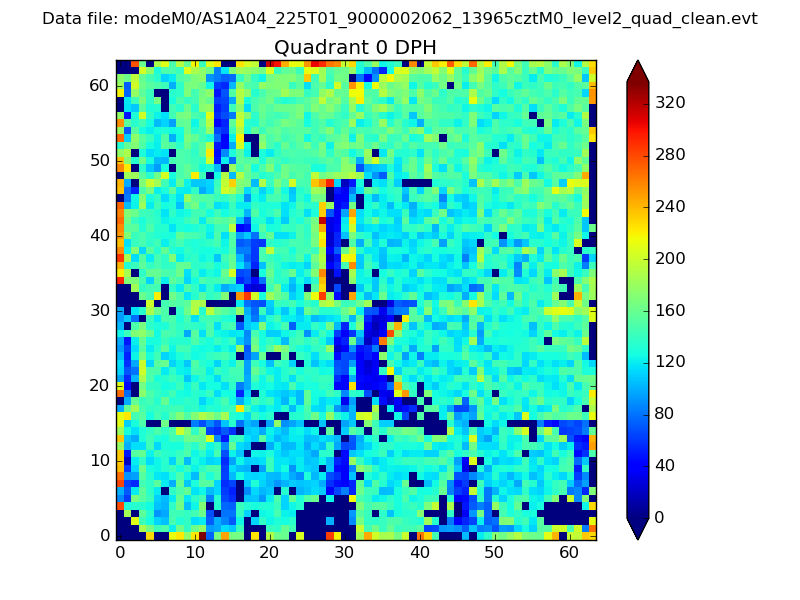 |
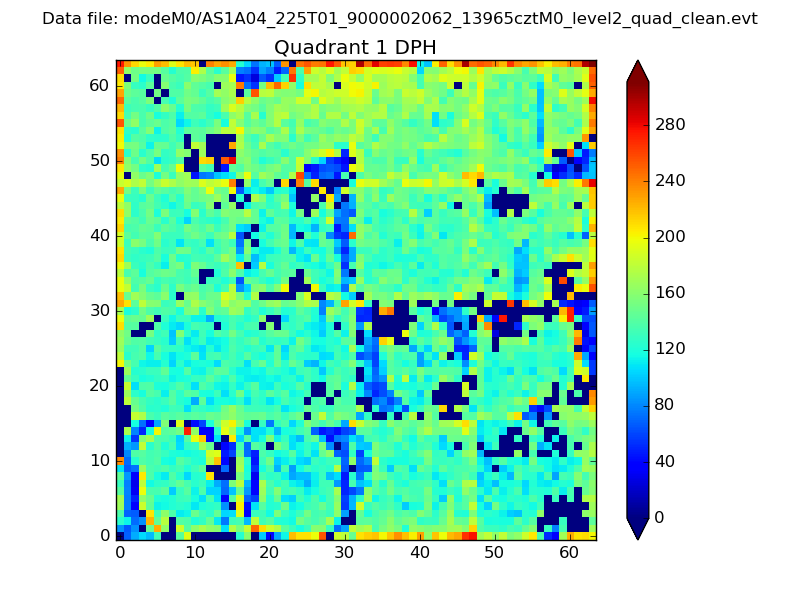 |
Quadrant B |
|---|---|---|---|
| Quadrant D | 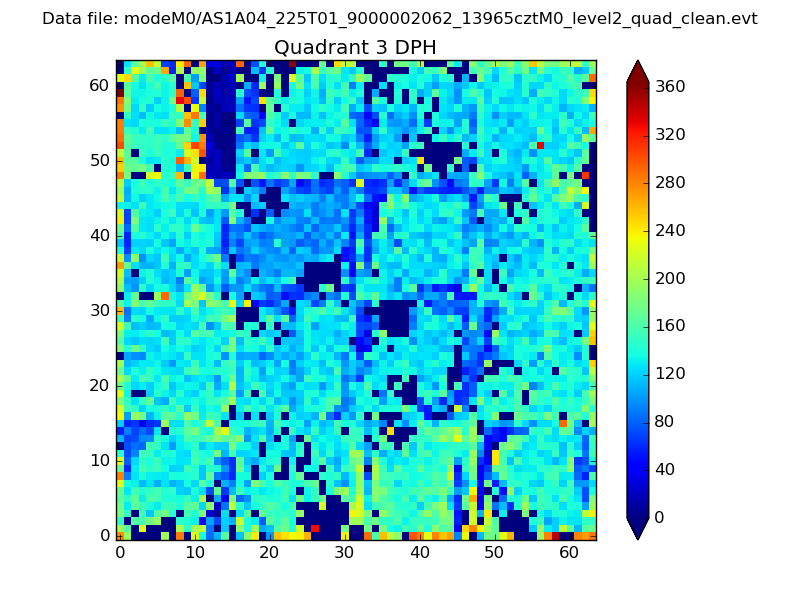 |
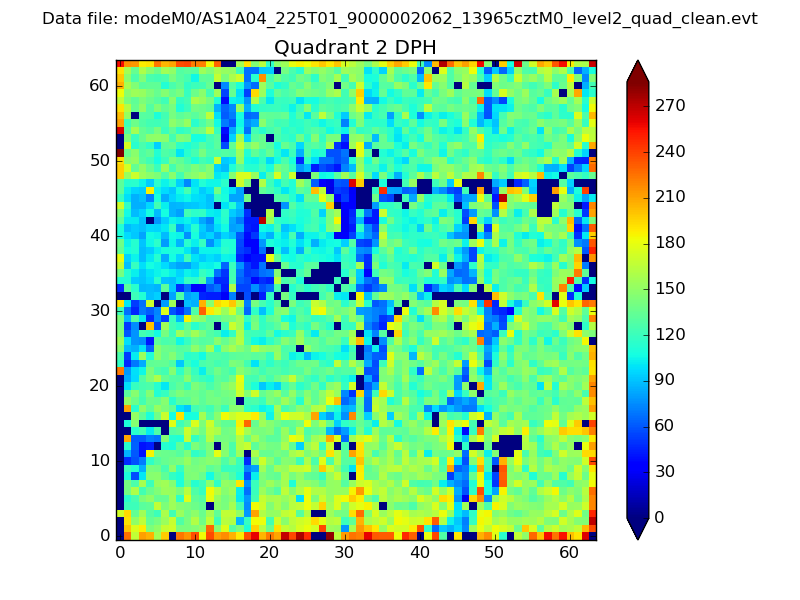 |
Quadrant C |
| Plot type | Count rate plots | Images |
|---|---|---|
| Comparison with Poisson distribution Blue bars denote a histogram of data divided into 1 sec bins. Red curve is a Poisson curve with rate = median count rate of data. |
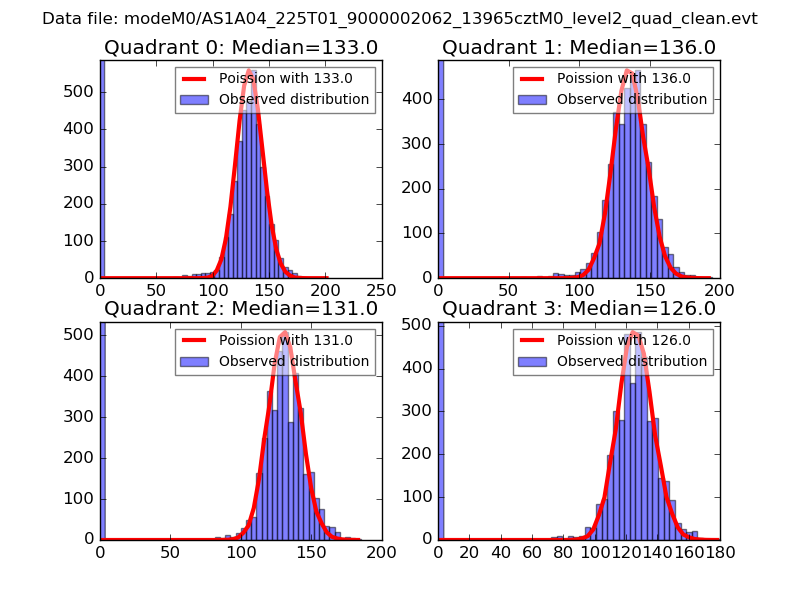 |
 |
| Quadrant-wise count rates Data is divided into 100 sec bins |
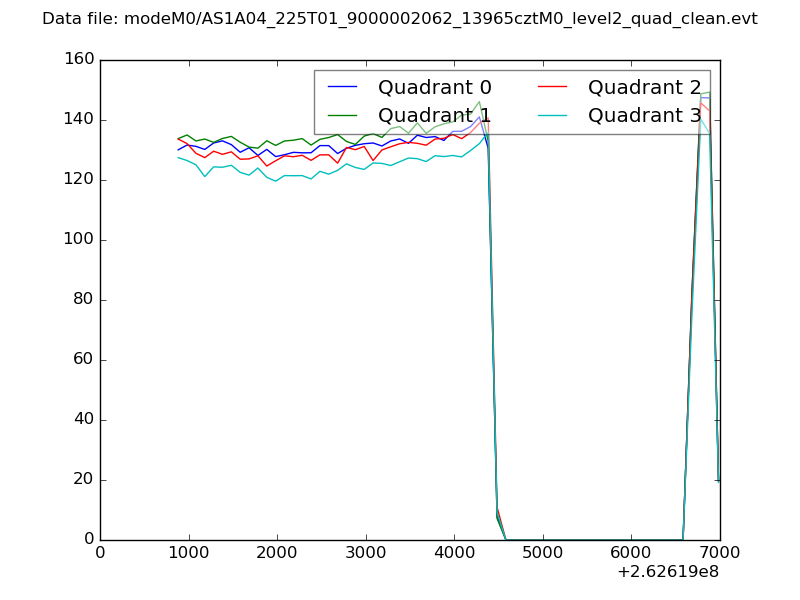 |
|
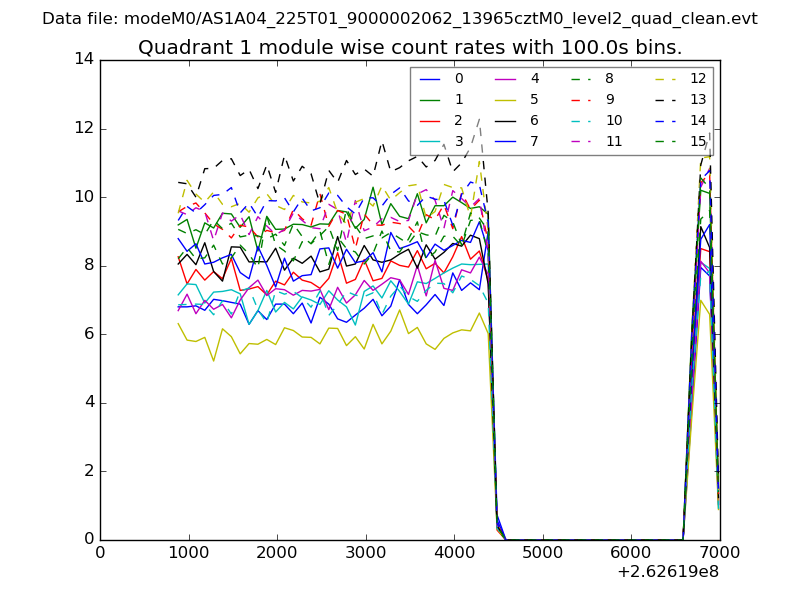
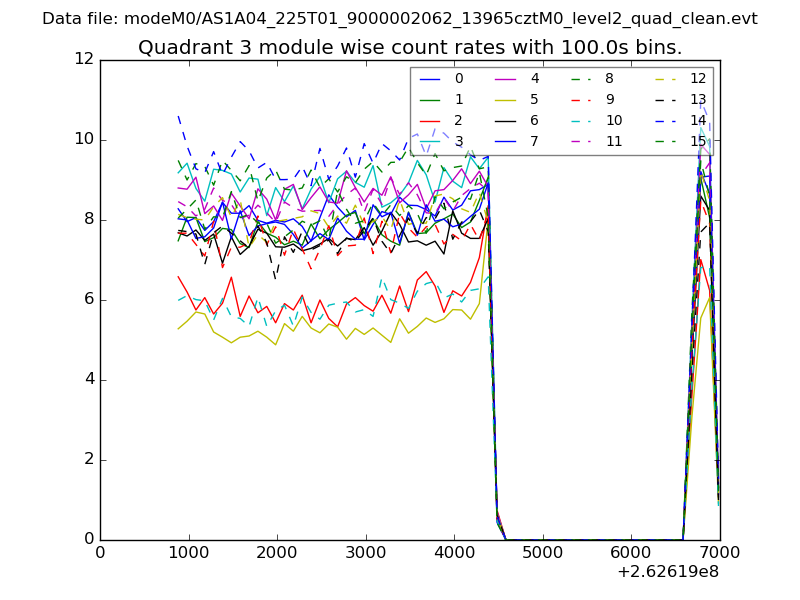
| Module-wise count rates for Quadrant A Data is divided into 100 sec bins |
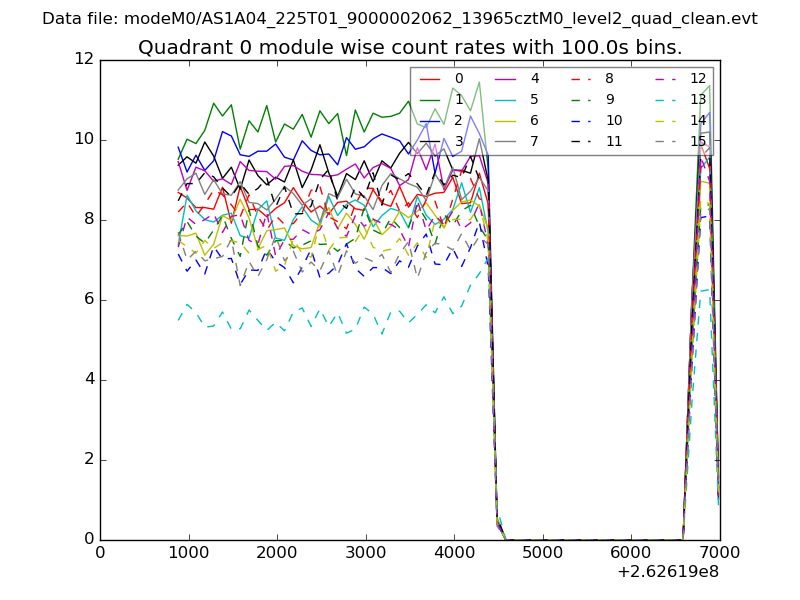 |
 |
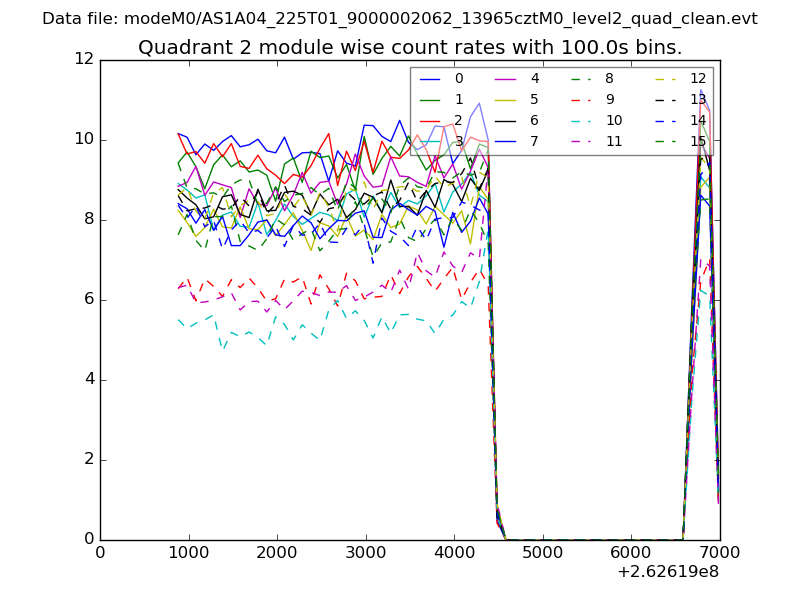
| Module-wise count rates for Quadrant B Data is divided into 100 sec bins |
 |
 |
| Module-wise count rates for Quadrant C Data is divided into 100 sec bins |
 |
 |
| Module-wise count rates for Quadrant D Data is divided into 100 sec bins |
 |
 |
| Parameter | Plot |
|---|---|
| CZT HV Monitor | 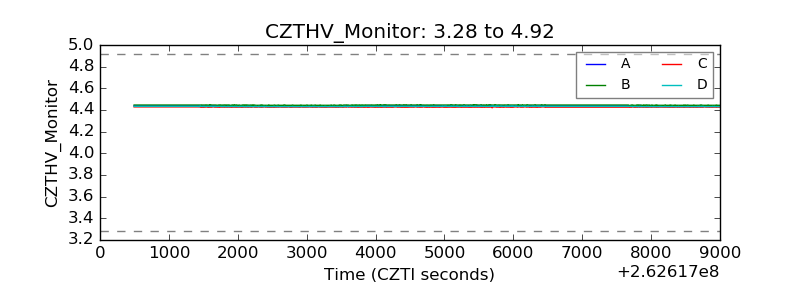 |
| D_VDD | 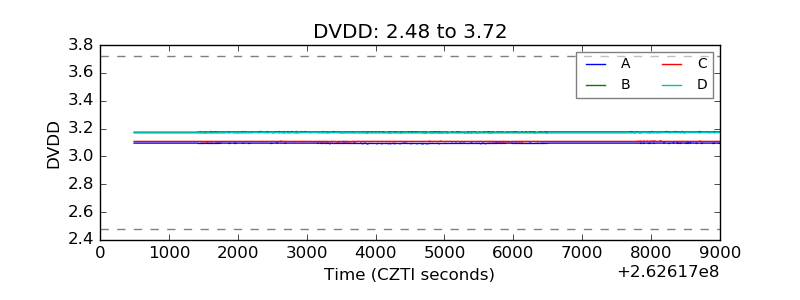 |
| Temperature 1 | 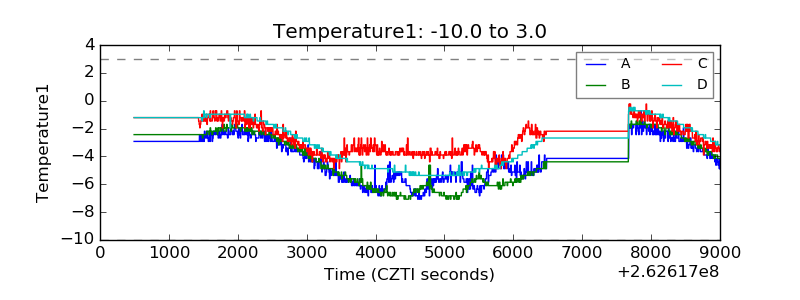 |
| Veto HV Monitor | 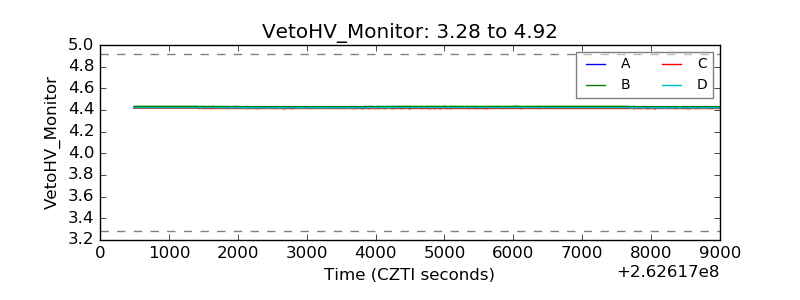 |
| Veto LLD | 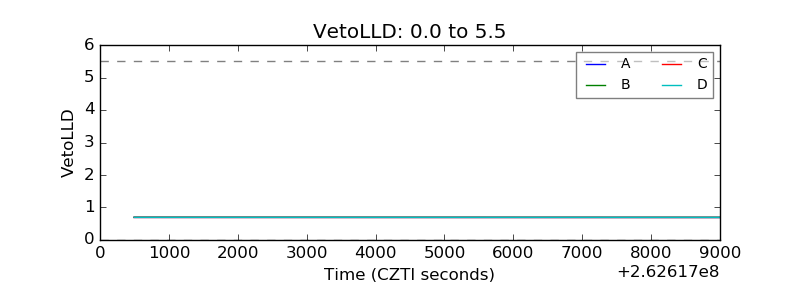 |
| Alpha Counter | 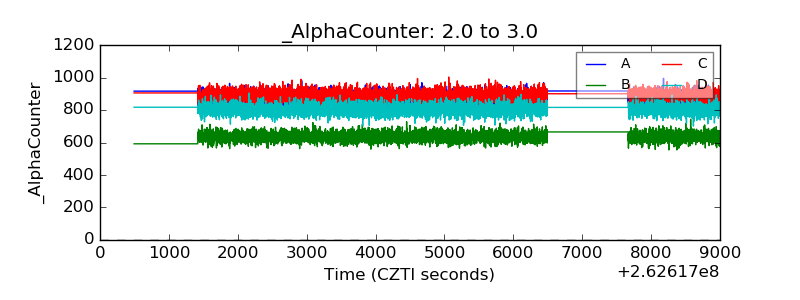 |
| _CPM_Rate | 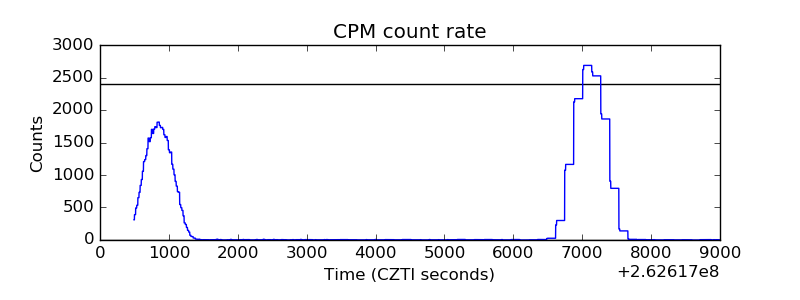 |
| CZT Counter | 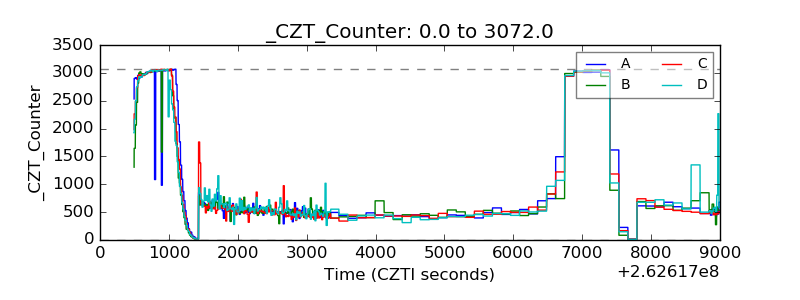 |
| +2.5 Volts monitor |  |
| +5 Volts monitor | 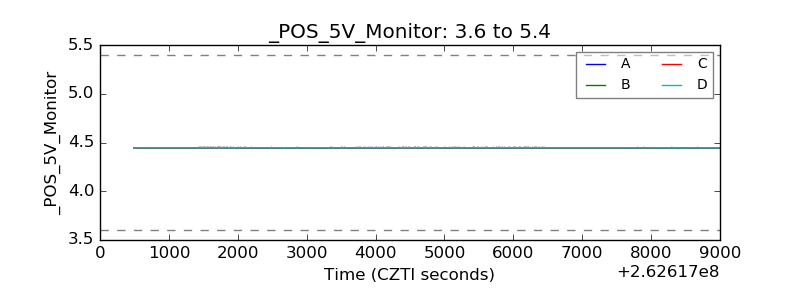 |
| _ROLL_ROT | 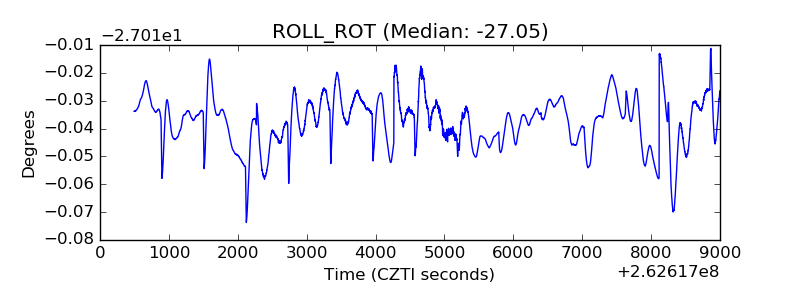 |
| _Roll_DEC |  |
| _Roll_RA | 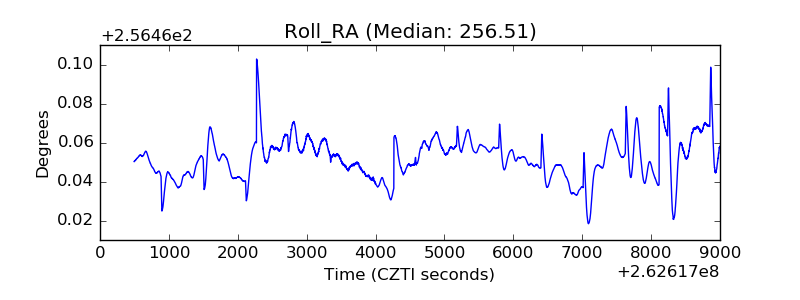 |
| Veto Counter | 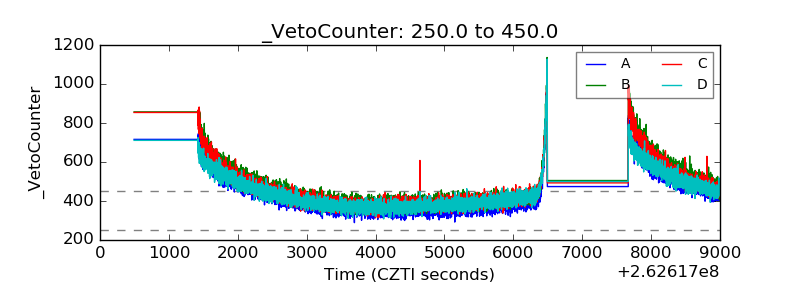 |