| Param | Original file | Final file |
|---|---|---|
| Filename | modeM0/AS1A04_225T01_9000002062_13968cztM0_level2.evt | modeM0/AS1A04_225T01_9000002062_13968cztM0_level2_quad_clean.evt |
| Size (bytes) | 523,212,480 | 116,061,120 |
| Size | 499.0 MB | 110.7 MB |
| Events in quadrant A | 3,439,355 | 770,543 |
| Events in quadrant B | 3,880,115 | 798,696 |
| Events in quadrant C | 3,448,573 | 768,120 |
| Events in quadrant D | 4,620,882 | 708,639 |
| Mode SS | |||
|---|---|---|---|
| Quadrant | BADHDUFLAG | Total packets | Discarded packets |
| A | 0 | 136 | 0 |
| B | 0 | 136 | 0 |
| C | 0 | 136 | 0 |
| D | 0 | 136 | 0 |
| Mode M0 | |||
|---|---|---|---|
| Quadrant | BADHDUFLAG | Total packets | Discarded packets |
| A | 0 | 14480 | 3 |
| B | 0 | 15832 | 2 |
| C | 0 | 14299 | 2 |
| D | 0 | 18100 | 2 |
| Mode M9 | |||
|---|---|---|---|
| Quadrant | BADHDUFLAG | Total packets | Discarded packets |
| A | 0 | 27 | 0 |
| B | 0 | 27 | 0 |
| C | 0 | 27 | 0 |
| D | 0 | 27 | 0 |
| Quadrant | Total seconds | Saturated seconds | Saturation percentage |
|---|---|---|---|
| A | 6732 | 95 | 1.411171% |
| B | 6732 | 202 | 3.000594% |
| C | 6732 | 27 | 0.401070% |
| D | 6732 | 334 | 4.961378% |
Noise dominated data is calculated using 1-second bins in cleaned event files. If a bin has >2000 counts, and if more than 50% of those come from <1% of pixels, then it is considered to be noise-dominated and hence unusable.
| Quadrant | # 1 sec bins | Bins with >0 counts | Bins with >2000 counts | High rate bins dominated by noise | Noise dominated (total time) | Noise dominated (detector-on time) | Marked lightcurve |
|---|---|---|---|---|---|---|---|
| A | 9418 | 6735 | 1 | 1 | 0.01% | 0.01% | 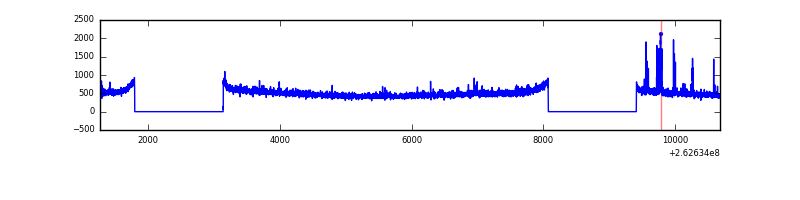 |
| B | 9418 | 6735 | 44 | 44 | 0.47% | 0.65% | 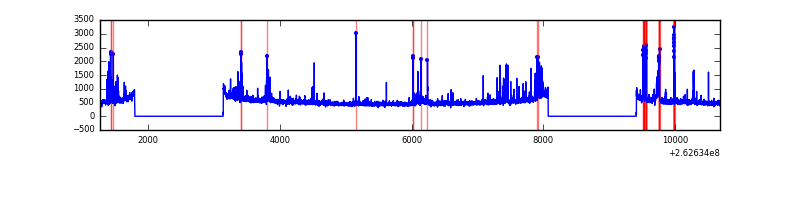 |
| C | 9418 | 6735 | 1 | 1 | 0.01% | 0.01% | 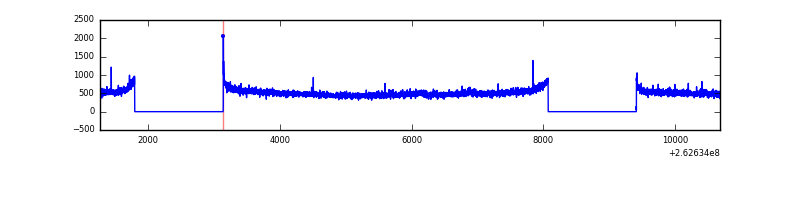 |
| D | 9418 | 6735 | 297 | 297 | 3.15% | 4.41% | 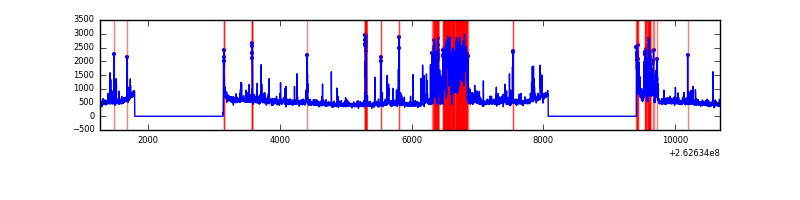 |
Top three noisy pixels from each quadrant. If the there are fewer than three noisy pixels in the level2.evt file, extra rows are filled as -1
| Pixel properties | Quadrant properties | ||||||
|---|---|---|---|---|---|---|---|
| Quadrant | DetID | PixID | Counts | Sigma | Mean | Median | Sigma |
| A | 14 | 111 | 69543 | 398.23 | 861 | 844 | 172.5 |
| A | 1 | 162 | 19621 | 108.85 | 861 | 844 | 172.5 |
| A | 9 | 143 | 17045 | 93.91 | 861 | 844 | 172.5 |
| B | 10 | 245 | 225035 | 1381.81 | 871 | 850 | 162.2 |
| B | 3 | 64 | 50620 | 306.77 | 871 | 850 | 162.2 |
| B | 4 | 80 | 49118 | 297.51 | 871 | 850 | 162.2 |
| C | 3 | 233 | 156469 | 807.58 | 842 | 849 | 192.7 |
| C | 13 | 61 | 5908 | 26.25 | 842 | 849 | 192.7 |
| C | 6 | 253 | 5676 | 25.05 | 842 | 849 | 192.7 |
| D | 13 | 122 | 1048515 | 4953.76 | 814 | 793 | 211.5 |
| D | 8 | 195 | 116057 | 544.98 | 814 | 793 | 211.5 |
| D | 2 | 14 | 87584 | 410.36 | 814 | 793 | 211.5 |
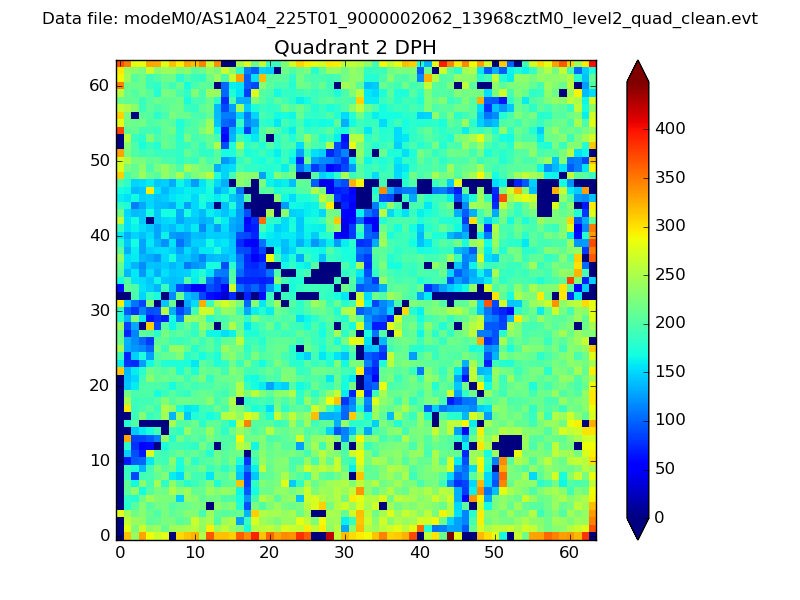
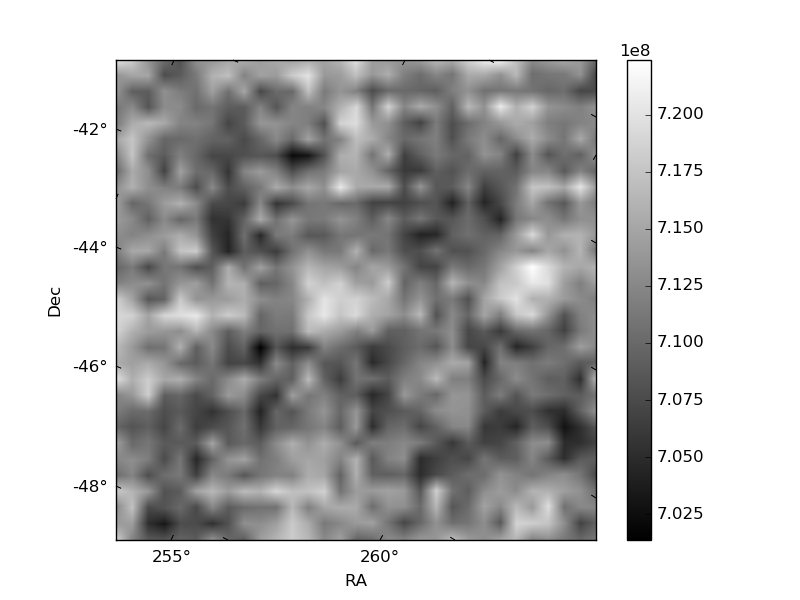
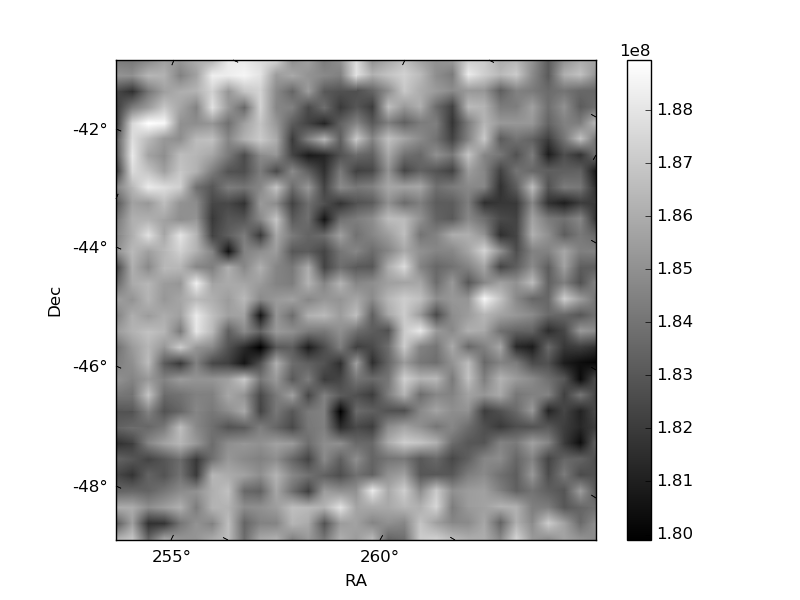
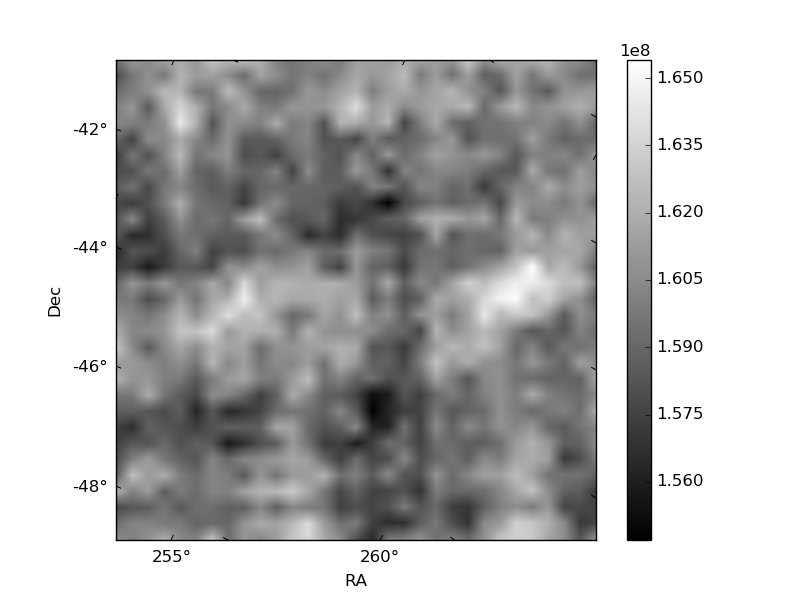
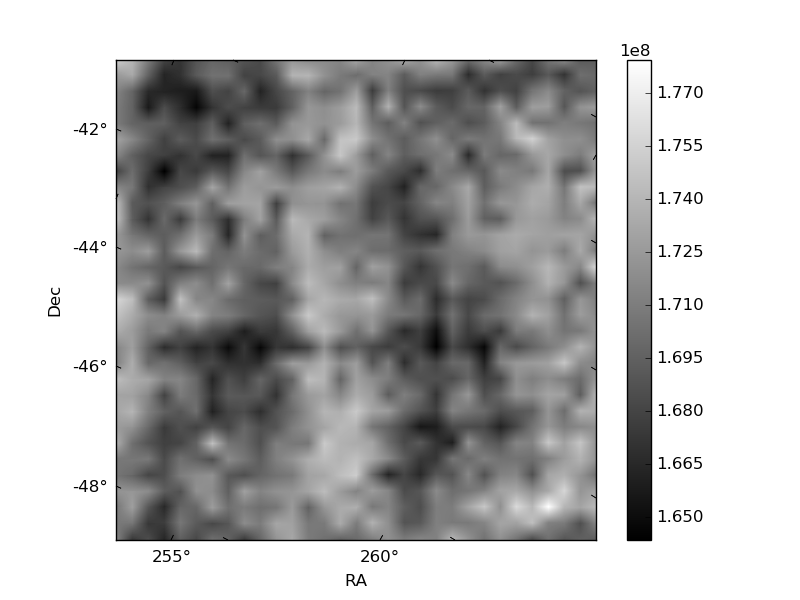
Histogram calculated using DETX and DETY for each event in the final _common_clean file
| Quadrant A | 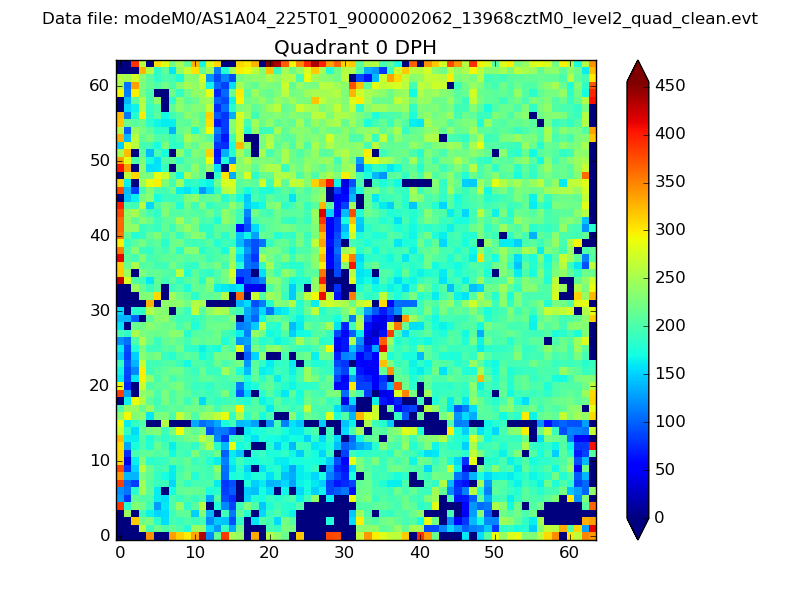 |
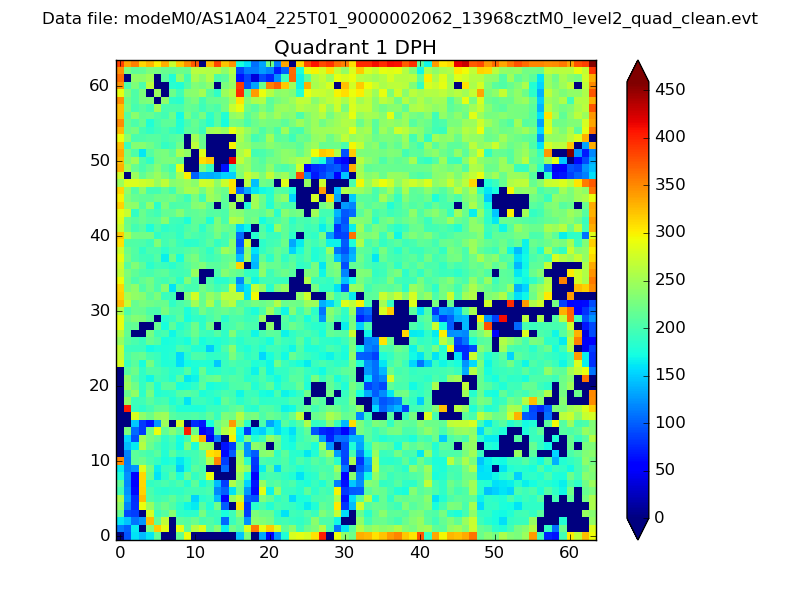 |
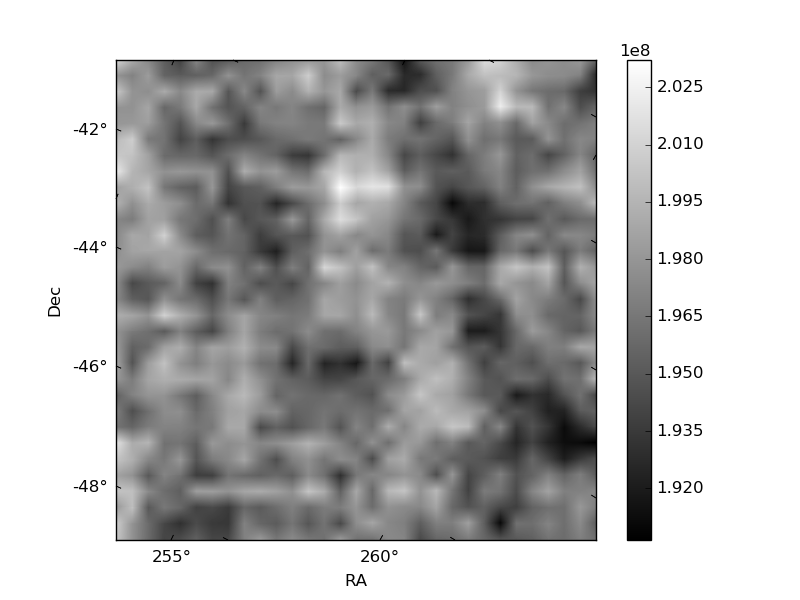
Quadrant B |
|---|---|---|---|
| Quadrant D | 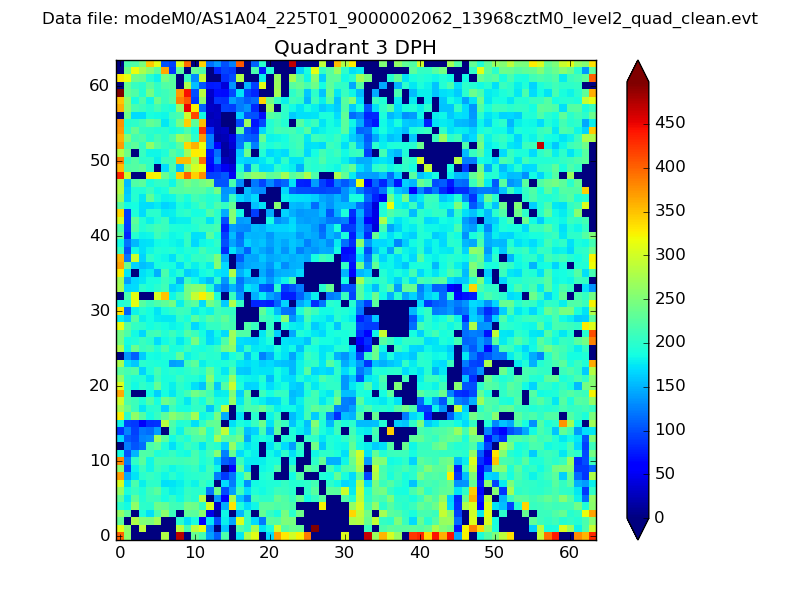 |
 |
Quadrant C |
| Plot type | Count rate plots | Images |
|---|---|---|
| Comparison with Poisson distribution Blue bars denote a histogram of data divided into 1 sec bins. Red curve is a Poisson curve with rate = median count rate of data. |
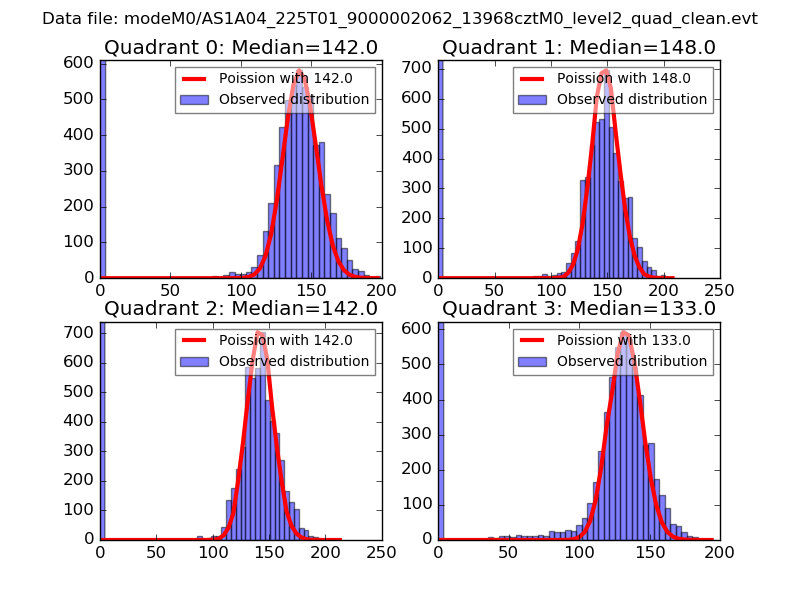 |
 |
| Quadrant-wise count rates Data is divided into 100 sec bins |
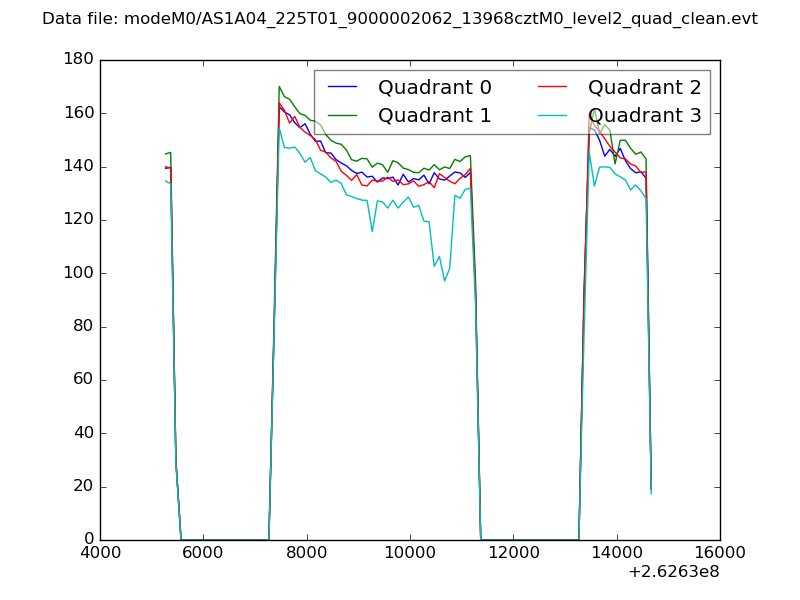 |
|
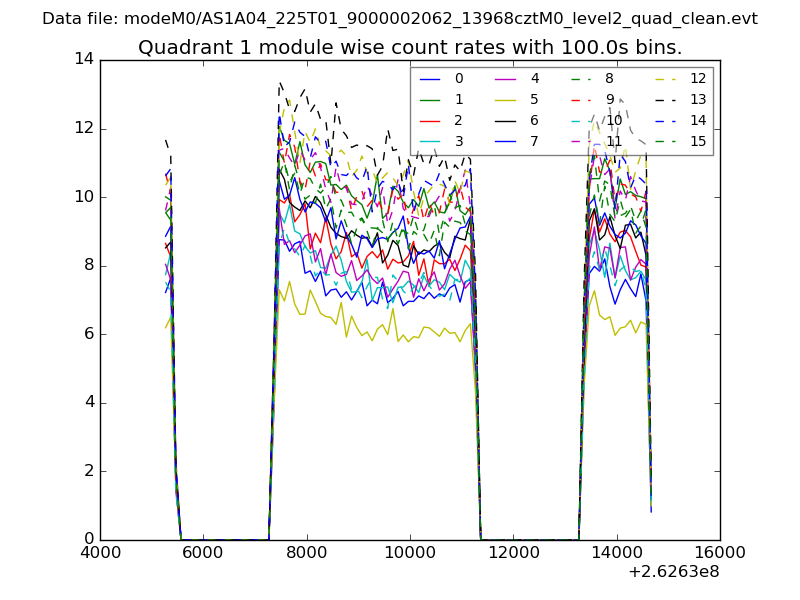
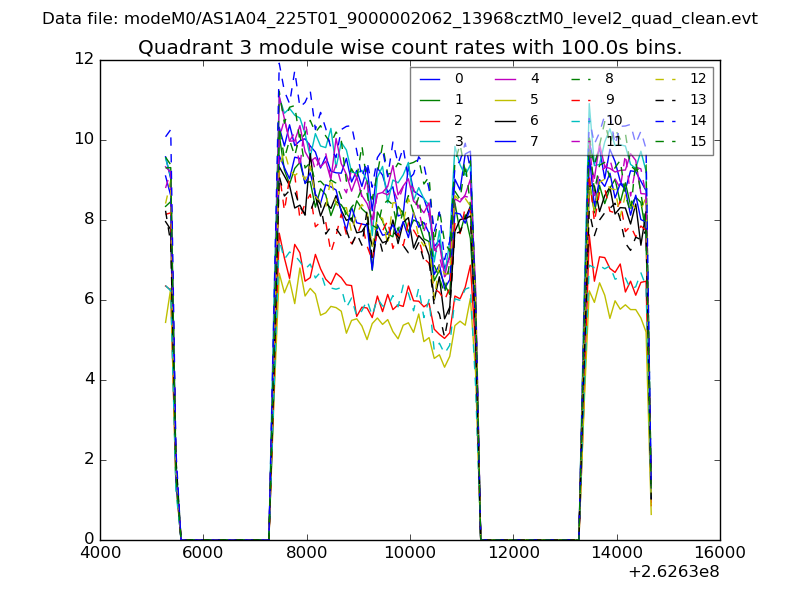
| Module-wise count rates for Quadrant A Data is divided into 100 sec bins |
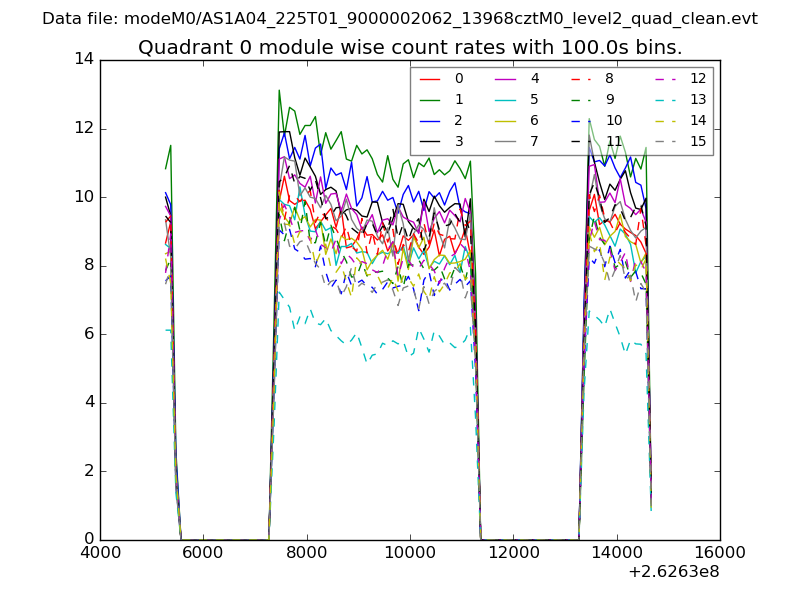 |
 |
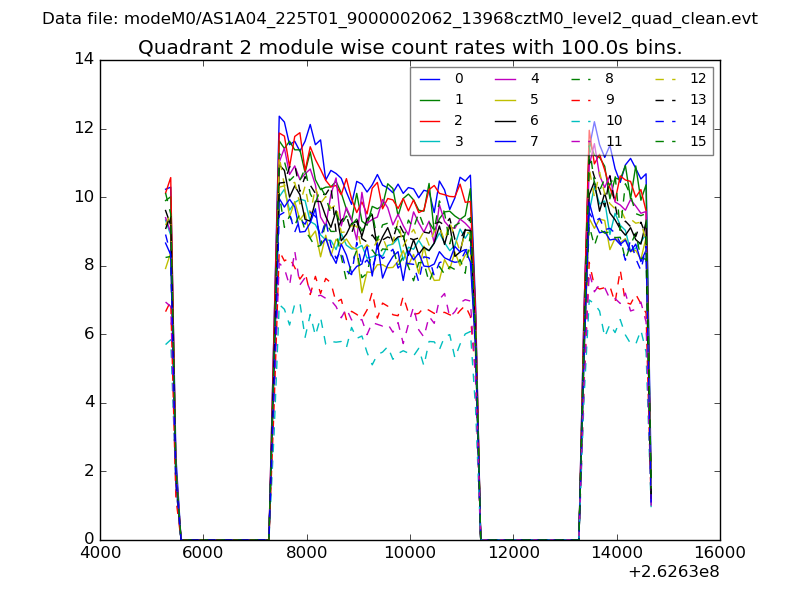
| Module-wise count rates for Quadrant B Data is divided into 100 sec bins |
 |
 |
| Module-wise count rates for Quadrant C Data is divided into 100 sec bins |
 |
 |
| Module-wise count rates for Quadrant D Data is divided into 100 sec bins |
 |
 |
| Parameter | Plot |
|---|---|
| CZT HV Monitor | 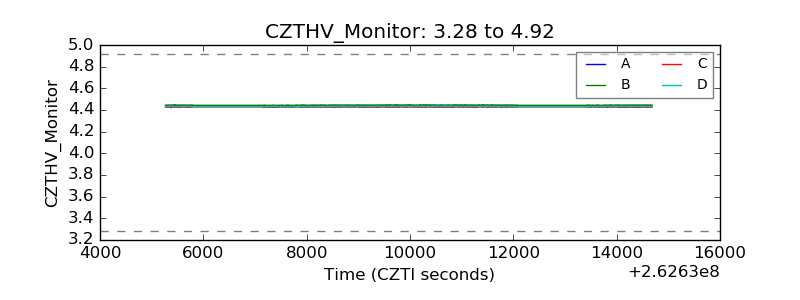 |
| D_VDD | 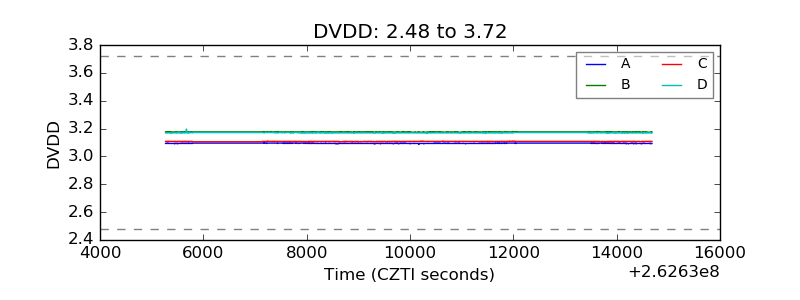 |
| Temperature 1 | 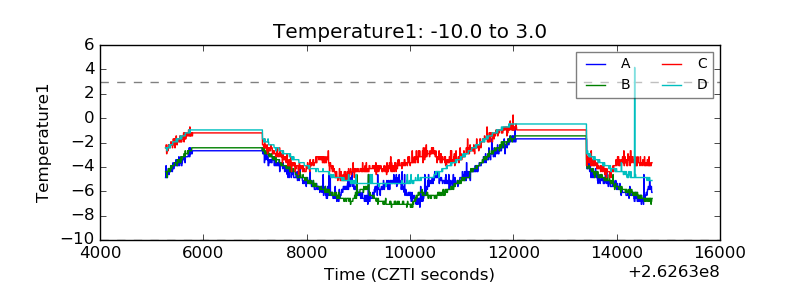 |
| Veto HV Monitor | 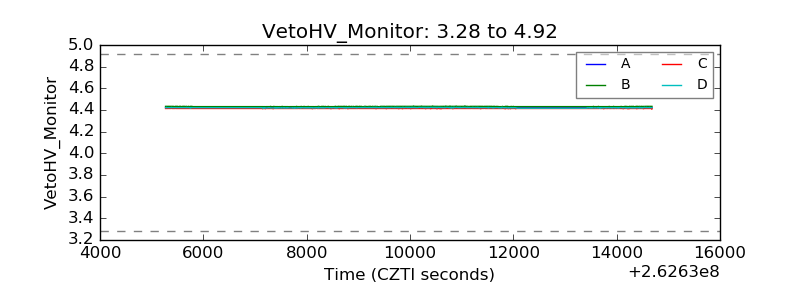 |
| Veto LLD | 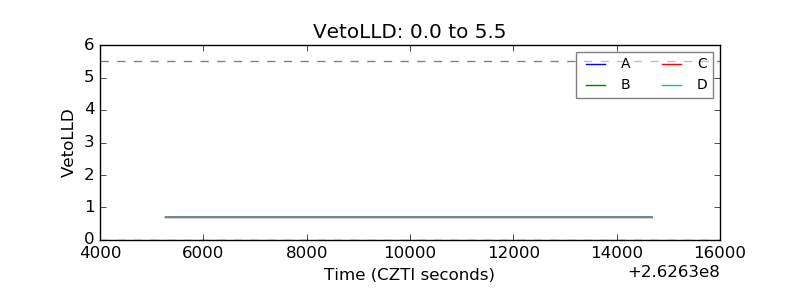 |
| Alpha Counter | 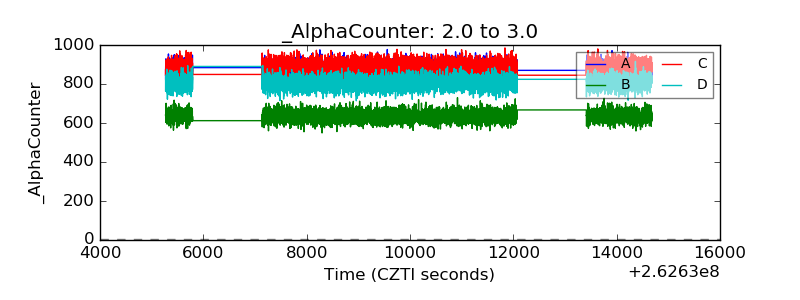 |
| _CPM_Rate | 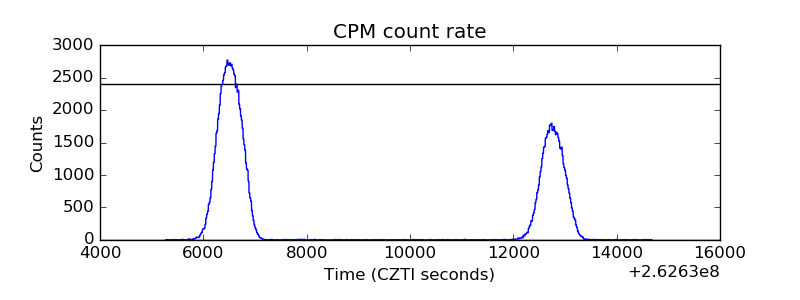 |
| CZT Counter | 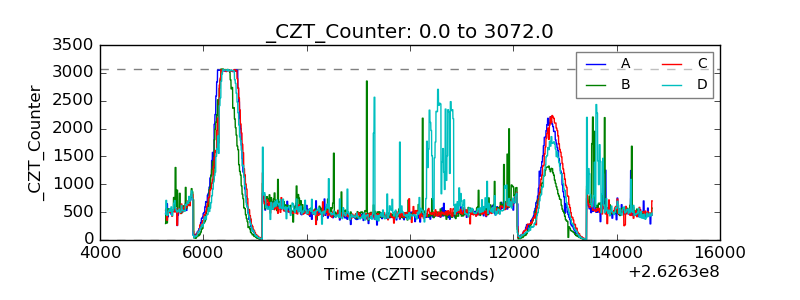 |
| +2.5 Volts monitor | 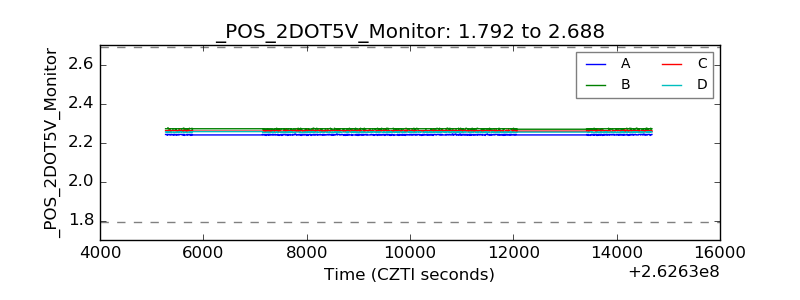 |
| +5 Volts monitor |  |
| _ROLL_ROT | 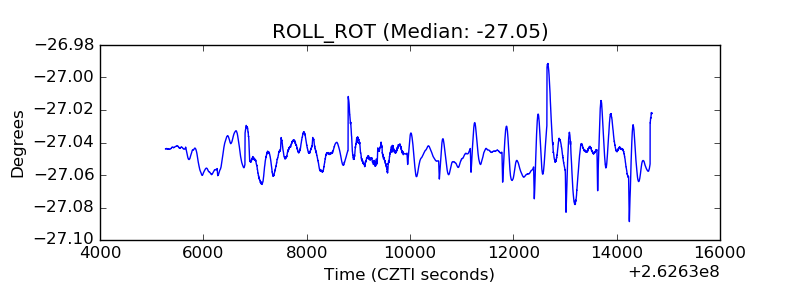 |
| _Roll_DEC | 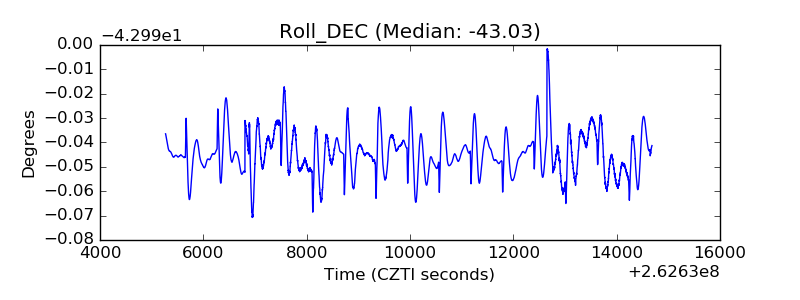 |
| _Roll_RA | 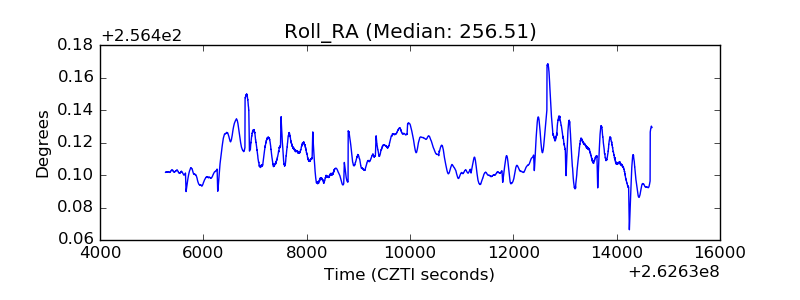 |
| Veto Counter | 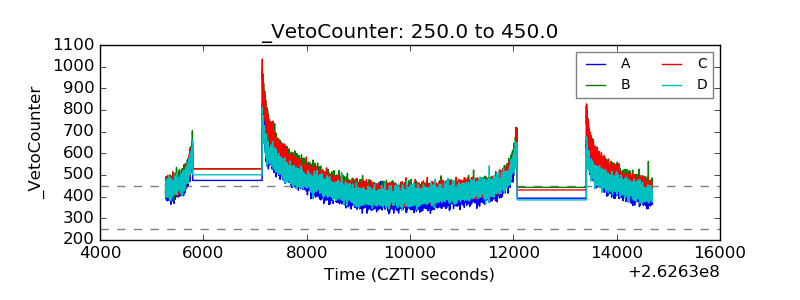 |