| Param | Original file | Final file |
|---|---|---|
| Filename | modeM0/AS1A04_225T01_9000002062_13969cztM0_level2.evt | modeM0/AS1A04_225T01_9000002062_13969cztM0_level2_quad_clean.evt |
| Size (bytes) | 462,401,280 | 104,598,720 |
| Size | 441.0 MB | 99.8 MB |
| Events in quadrant A | 3,126,554 | 683,980 |
| Events in quadrant B | 3,390,738 | 711,565 |
| Events in quadrant C | 3,182,104 | 688,769 |
| Events in quadrant D | 3,872,840 | 640,222 |
| Mode SS | |||
|---|---|---|---|
| Quadrant | BADHDUFLAG | Total packets | Discarded packets |
| A | 0 | 130 | 0 |
| B | 0 | 130 | 0 |
| C | 0 | 130 | 0 |
| D | 0 | 130 | 0 |
| Mode M0 | |||
|---|---|---|---|
| Quadrant | BADHDUFLAG | Total packets | Discarded packets |
| A | 0 | 13471 | 3 |
| B | 0 | 14229 | 2 |
| C | 0 | 13239 | 2 |
| D | 0 | 15636 | 2 |
| Mode M9 | |||
|---|---|---|---|
| Quadrant | BADHDUFLAG | Total packets | Discarded packets |
| A | 0 | 26 | 0 |
| B | 0 | 26 | 0 |
| C | 0 | 26 | 0 |
| D | 0 | 26 | 0 |
| Quadrant | Total seconds | Saturated seconds | Saturation percentage |
|---|---|---|---|
| A | 6356 | 61 | 0.959723% |
| B | 6356 | 117 | 1.840780% |
| C | 6356 | 19 | 0.298930% |
| D | 6356 | 160 | 2.517306% |
Noise dominated data is calculated using 1-second bins in cleaned event files. If a bin has >2000 counts, and if more than 50% of those come from <1% of pixels, then it is considered to be noise-dominated and hence unusable.
| Quadrant | # 1 sec bins | Bins with >0 counts | Bins with >2000 counts | High rate bins dominated by noise | Noise dominated (total time) | Noise dominated (detector-on time) | Marked lightcurve |
|---|---|---|---|---|---|---|---|
| A | 8892 | 6359 | 3 | 3 | 0.03% | 0.05% | 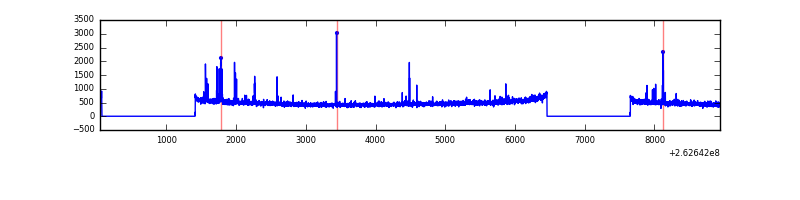 |
| B | 8892 | 6359 | 35 | 35 | 0.39% | 0.55% | 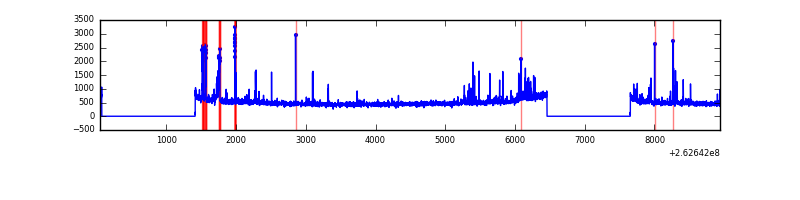 |
| C | 8892 | 6359 | 0 | 0 | 0.00% | 0.00% | 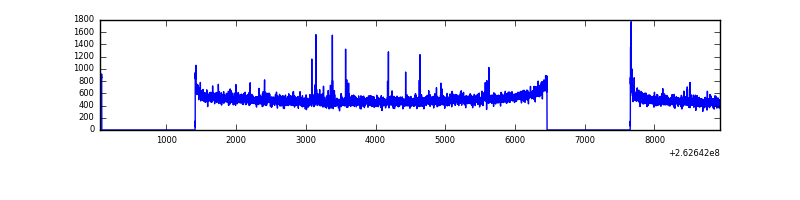 |
| D | 8892 | 6359 | 133 | 133 | 1.50% | 2.09% | 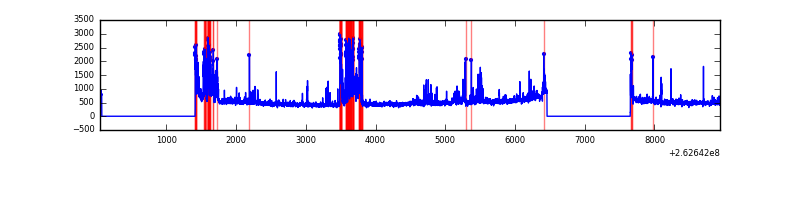 |
Top three noisy pixels from each quadrant. If the there are fewer than three noisy pixels in the level2.evt file, extra rows are filled as -1
| Pixel properties | Quadrant properties | ||||||
|---|---|---|---|---|---|---|---|
| Quadrant | DetID | PixID | Counts | Sigma | Mean | Median | Sigma |
| A | 14 | 111 | 64657 | 408.89 | 772 | 756 | 156.3 |
| A | 15 | 222 | 33773 | 211.27 | 772 | 756 | 156.3 |
| A | 1 | 162 | 19704 | 121.25 | 772 | 756 | 156.3 |
| B | 10 | 245 | 131078 | 891.99 | 784 | 765 | 146.1 |
| B | 4 | 80 | 39269 | 263.56 | 784 | 765 | 146.1 |
| B | 0 | 189 | 37485 | 251.35 | 784 | 765 | 146.1 |
| C | 3 | 233 | 177754 | 1008.12 | 762 | 766 | 175.6 |
| C | 12 | 4 | 34531 | 192.32 | 762 | 766 | 175.6 |
| C | 13 | 61 | 5514 | 27.04 | 762 | 766 | 175.6 |
| D | 13 | 122 | 614944 | 3412.76 | 738 | 718 | 180.0 |
| D | 8 | 195 | 150505 | 832.25 | 738 | 718 | 180.0 |
| D | 13 | 189 | 77740 | 427.95 | 738 | 718 | 180.0 |
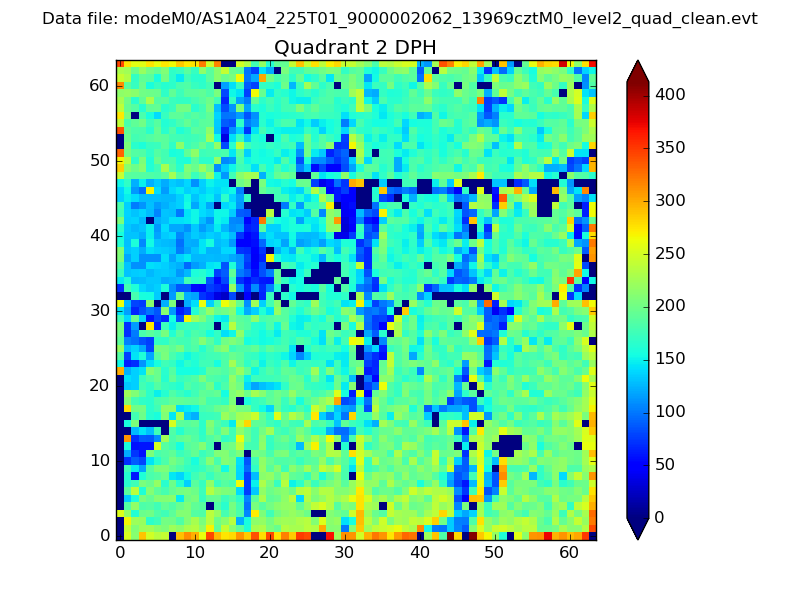
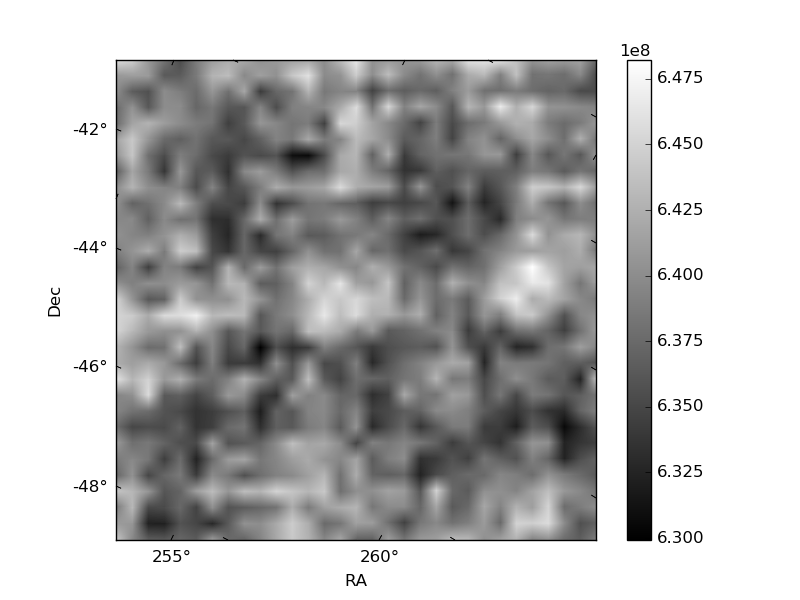
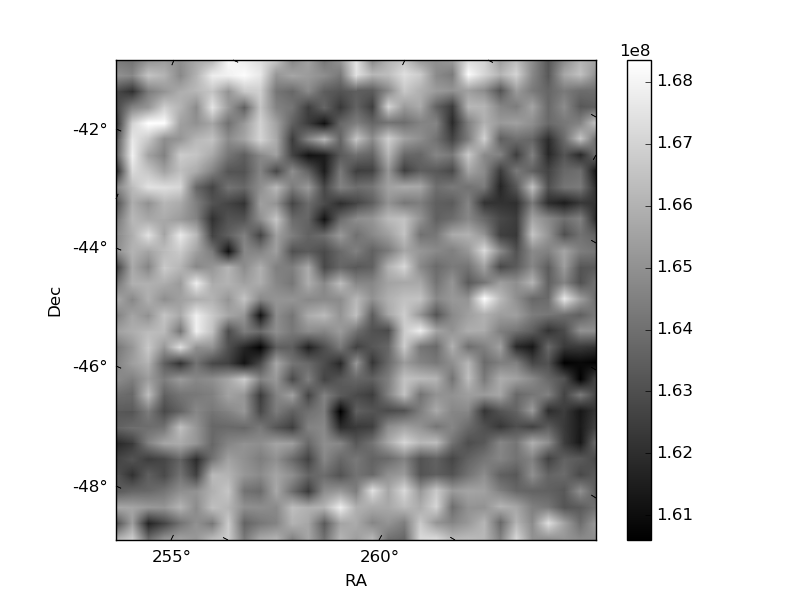
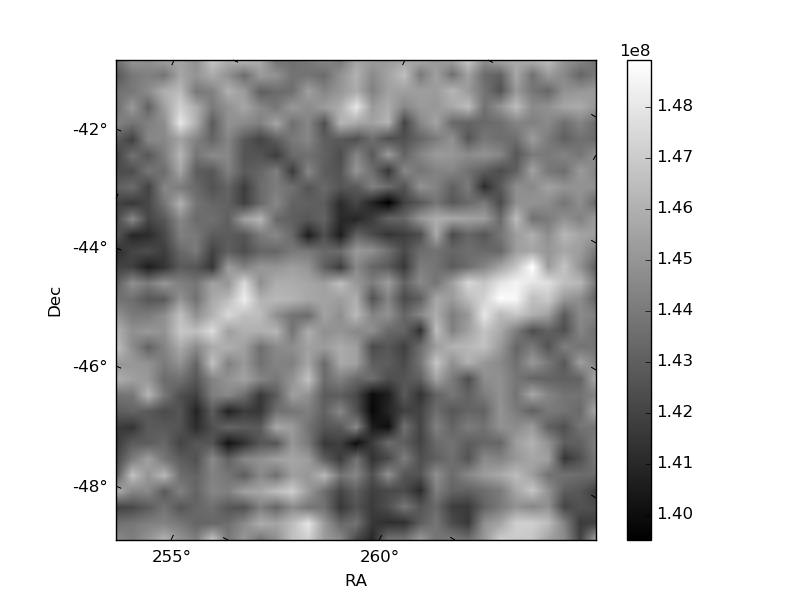
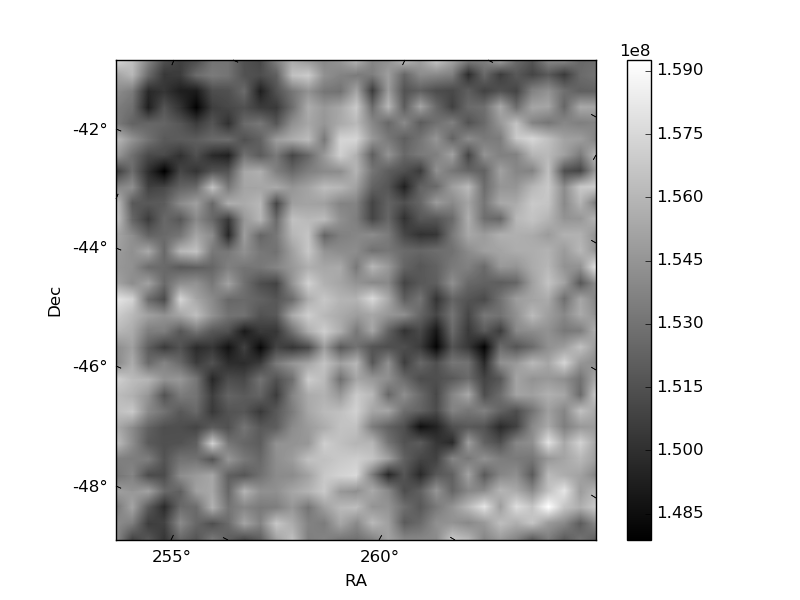
Histogram calculated using DETX and DETY for each event in the final _common_clean file
| Quadrant A | 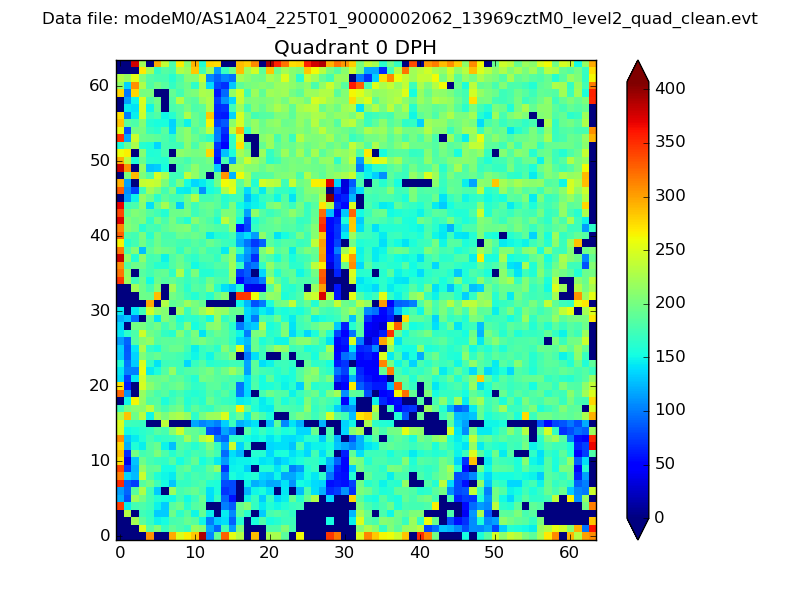 |
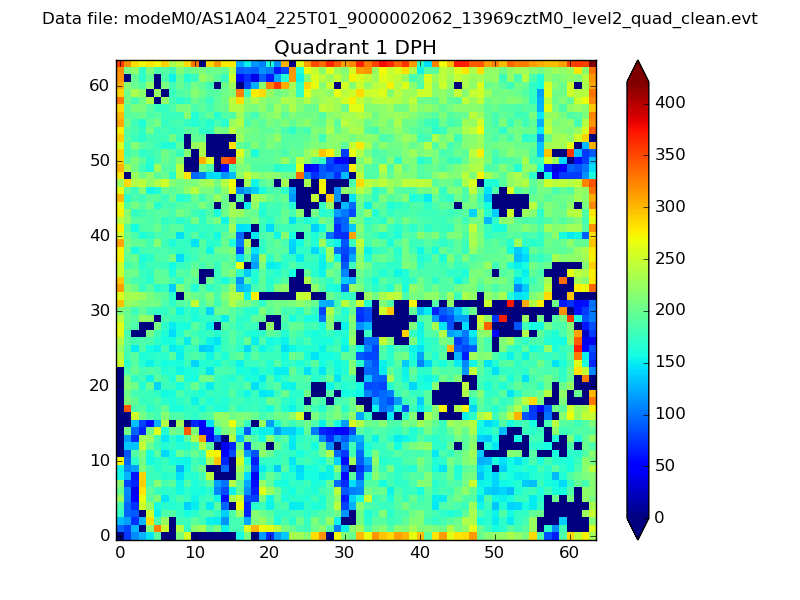 |
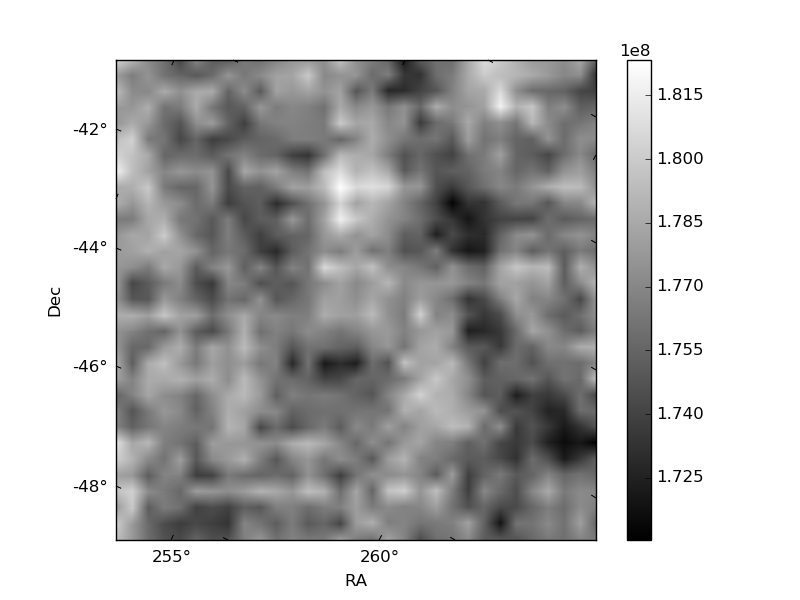
Quadrant B |
|---|---|---|---|
| Quadrant D | 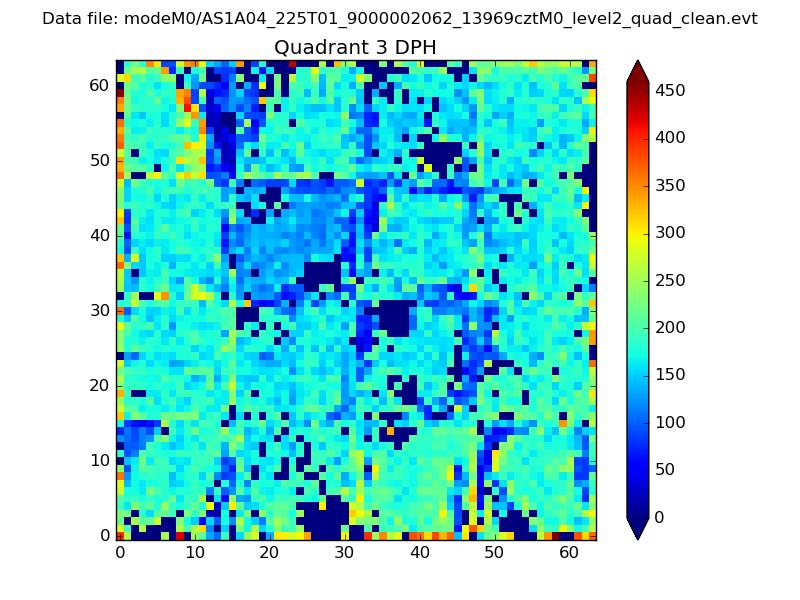 |
 |
Quadrant C |
| Plot type | Count rate plots | Images |
|---|---|---|
| Comparison with Poisson distribution Blue bars denote a histogram of data divided into 1 sec bins. Red curve is a Poisson curve with rate = median count rate of data. |
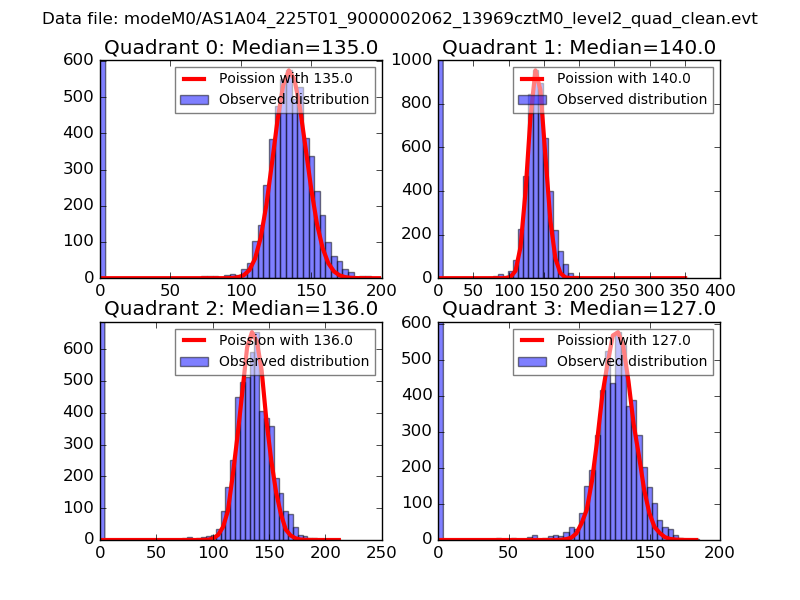 |
 |
| Quadrant-wise count rates Data is divided into 100 sec bins |
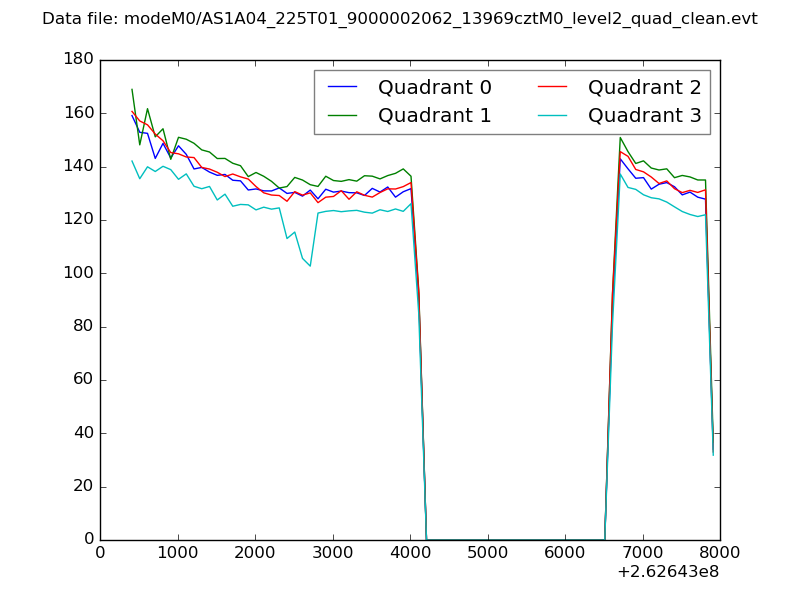 |
|
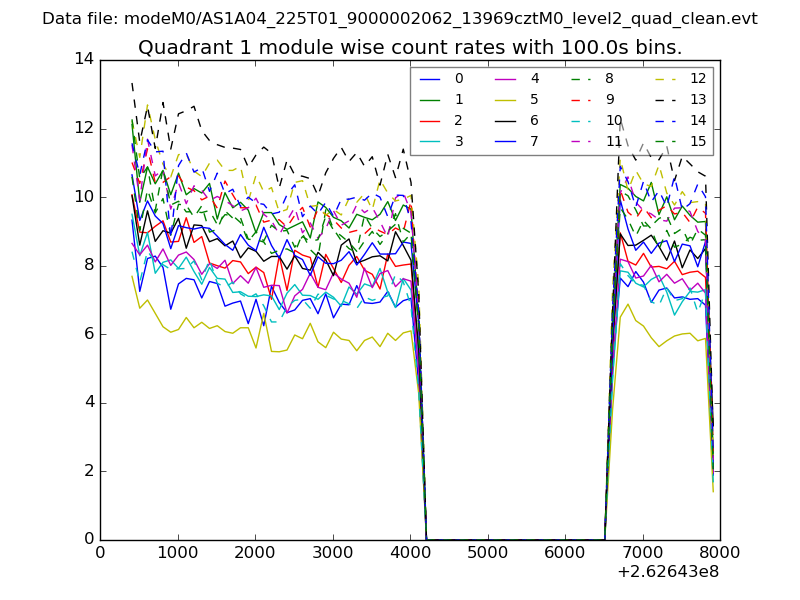
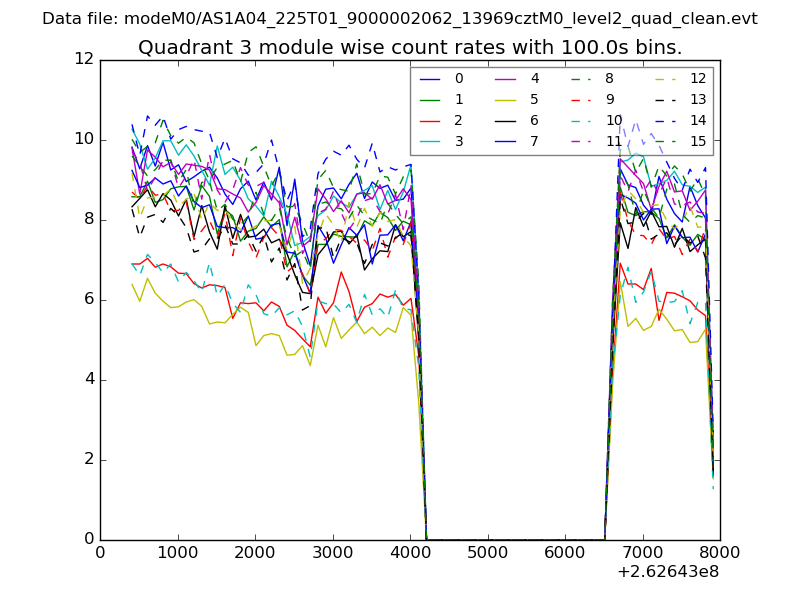
| Module-wise count rates for Quadrant A Data is divided into 100 sec bins |
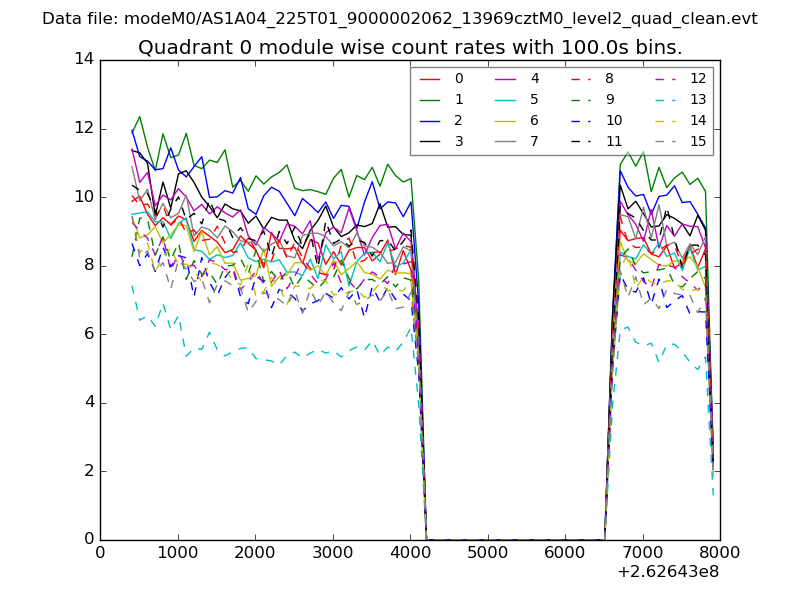 |
 |
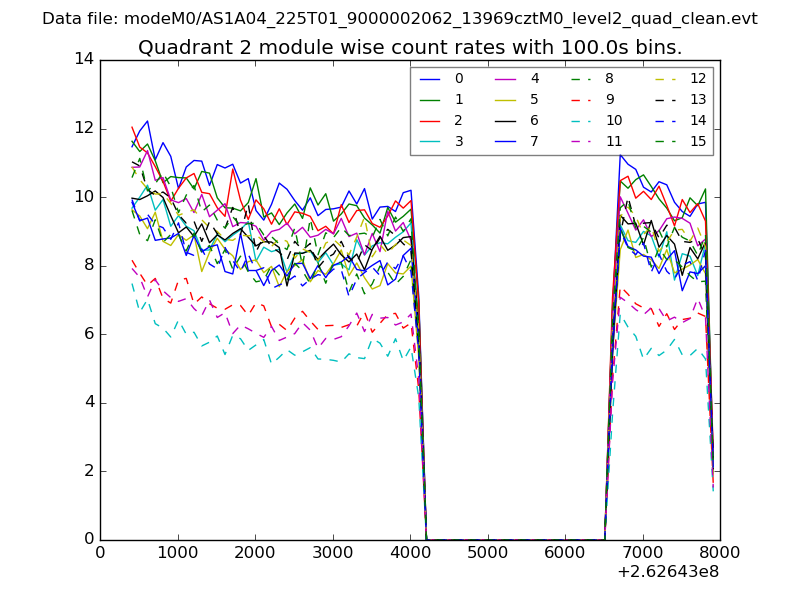
| Module-wise count rates for Quadrant B Data is divided into 100 sec bins |
 |
 |
| Module-wise count rates for Quadrant C Data is divided into 100 sec bins |
 |
 |
| Module-wise count rates for Quadrant D Data is divided into 100 sec bins |
 |
 |
| Parameter | Plot |
|---|---|
| CZT HV Monitor | 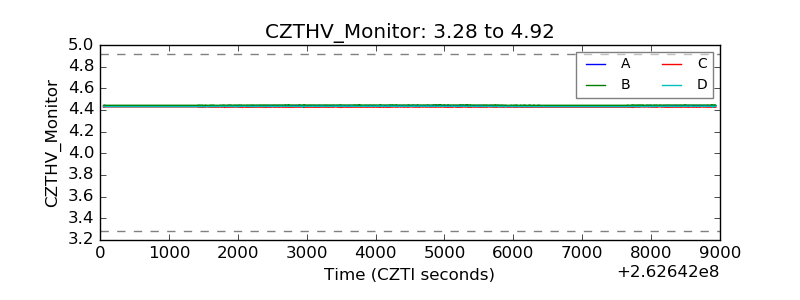 |
| D_VDD | 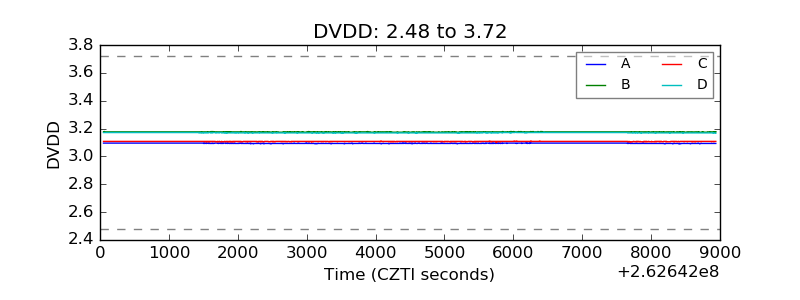 |
| Temperature 1 | 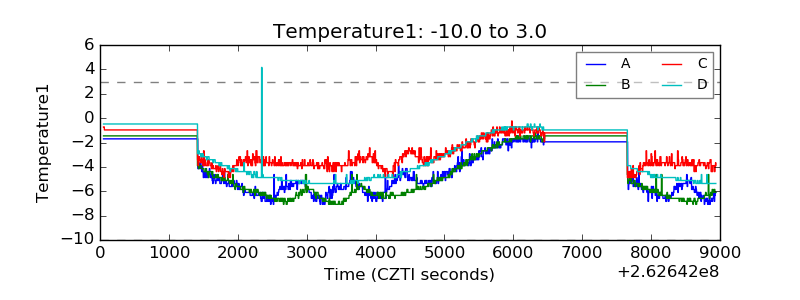 |
| Veto HV Monitor | 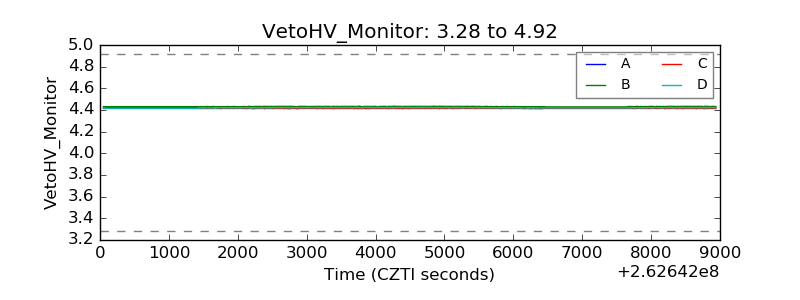 |
| Veto LLD | 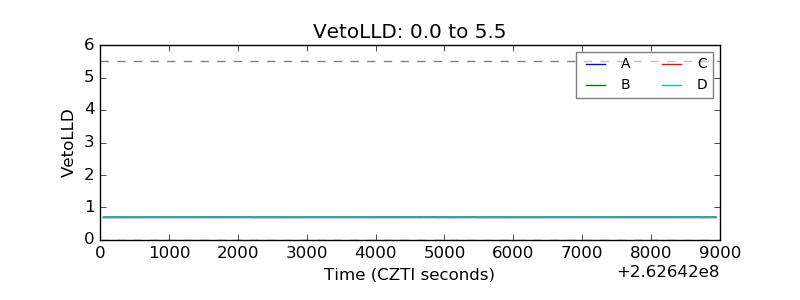 |
| Alpha Counter | 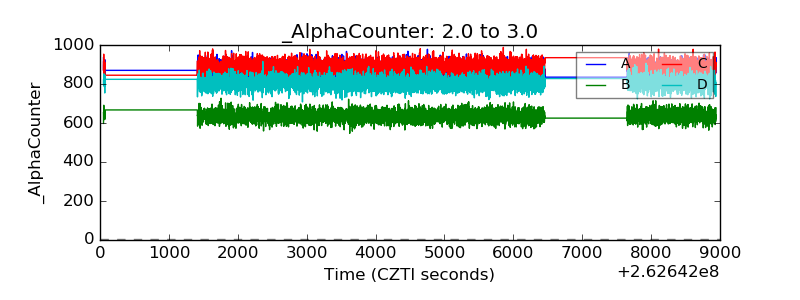 |
| _CPM_Rate | 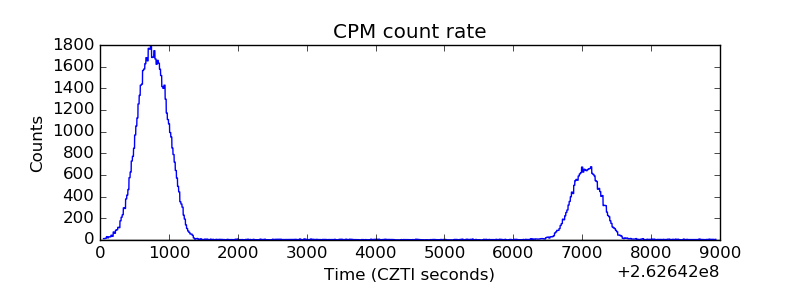 |
| CZT Counter | 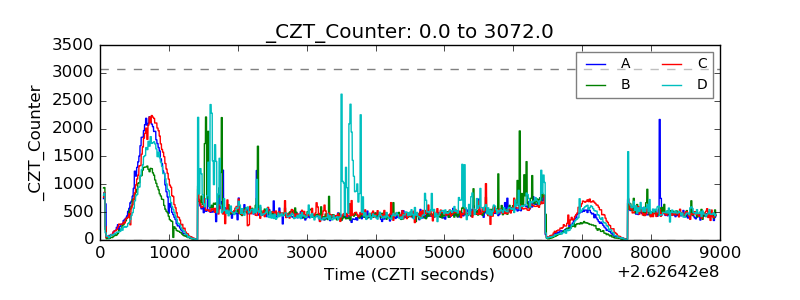 |
| +2.5 Volts monitor |  |
| +5 Volts monitor | 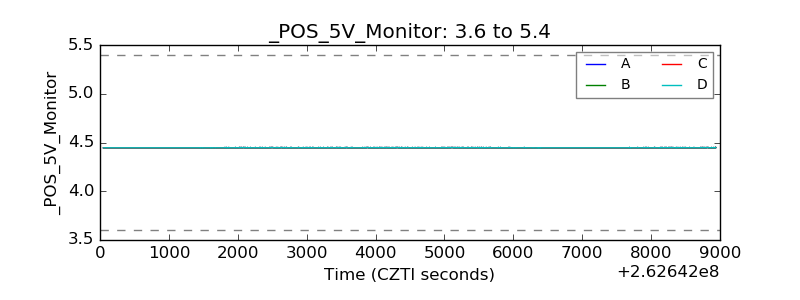 |
| _ROLL_ROT | 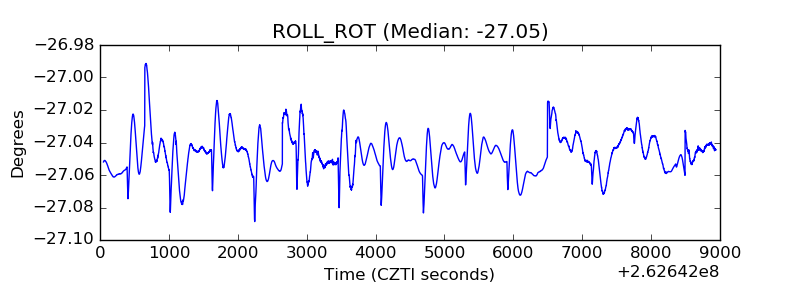 |
| _Roll_DEC | 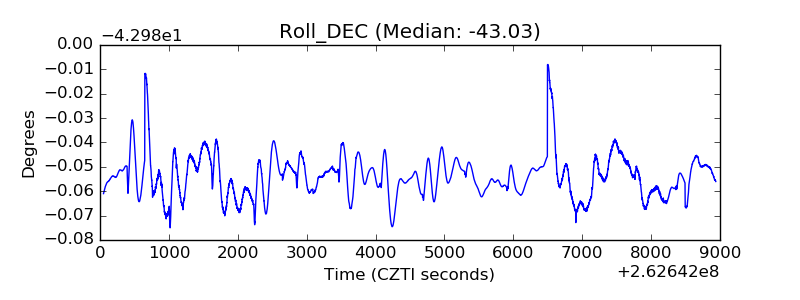 |
| _Roll_RA | 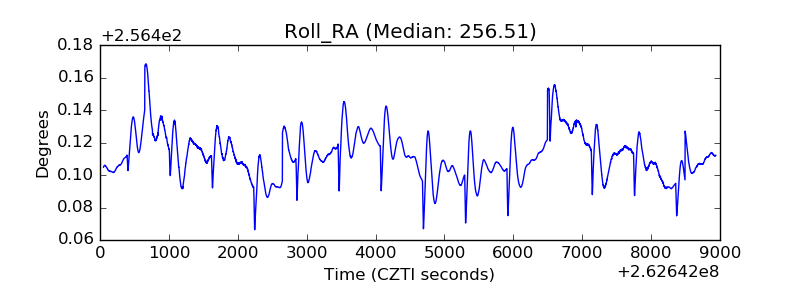 |
| Veto Counter | 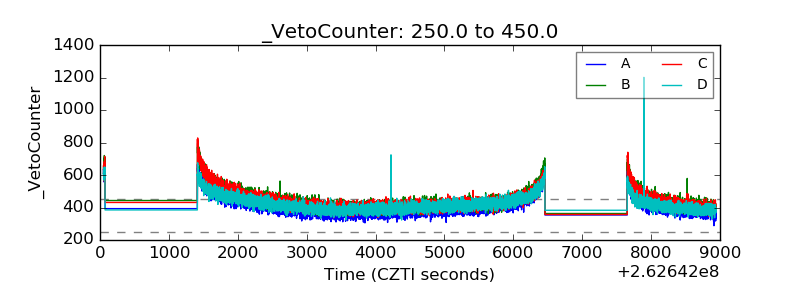 |