| Param | Original file | Final file |
|---|---|---|
| Filename | modeM0/AS1A04_225T01_9000002062_13971cztM0_level2.evt | modeM0/AS1A04_225T01_9000002062_13971cztM0_level2_quad_clean.evt |
| Size (bytes) | 526,357,440 | 112,806,720 |
| Size | 502.0 MB | 107.6 MB |
| Events in quadrant A | 3,700,684 | 718,041 |
| Events in quadrant B | 3,882,248 | 742,665 |
| Events in quadrant C | 3,761,486 | 721,121 |
| Events in quadrant D | 4,057,757 | 683,272 |
| Mode SS | |||
|---|---|---|---|
| Quadrant | BADHDUFLAG | Total packets | Discarded packets |
| A | 0 | 164 | 0 |
| B | 0 | 164 | 0 |
| C | 0 | 164 | 0 |
| D | 0 | 164 | 0 |
| Mode M0 | |||
|---|---|---|---|
| Quadrant | BADHDUFLAG | Total packets | Discarded packets |
| A | 0 | 16406 | 3 |
| B | 0 | 16764 | 2 |
| C | 0 | 16353 | 2 |
| D | 0 | 17562 | 2 |
| Mode M9 | |||
|---|---|---|---|
| Quadrant | BADHDUFLAG | Total packets | Discarded packets |
| A | 0 | 12 | 0 |
| B | 0 | 12 | 0 |
| C | 0 | 12 | 0 |
| D | 0 | 12 | 0 |
| Quadrant | Total seconds | Saturated seconds | Saturation percentage |
|---|---|---|---|
| A | 7927 | 41 | 0.517220% |
| B | 7927 | 88 | 1.110130% |
| C | 7927 | 41 | 0.517220% |
| D | 7927 | 70 | 0.883058% |
Noise dominated data is calculated using 1-second bins in cleaned event files. If a bin has >2000 counts, and if more than 50% of those come from <1% of pixels, then it is considered to be noise-dominated and hence unusable.
| Quadrant | # 1 sec bins | Bins with >0 counts | Bins with >2000 counts | High rate bins dominated by noise | Noise dominated (total time) | Noise dominated (detector-on time) | Marked lightcurve |
|---|---|---|---|---|---|---|---|
| A | 9138 | 7930 | 1 | 1 | 0.01% | 0.01% | 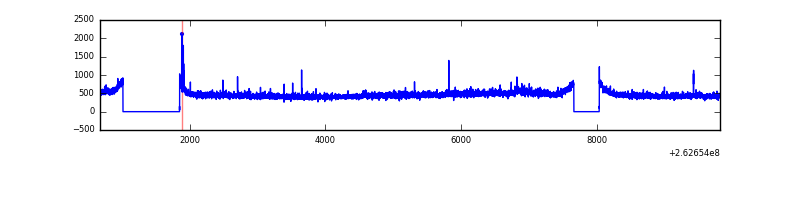 |
| B | 9138 | 7930 | 12 | 12 | 0.13% | 0.15% | 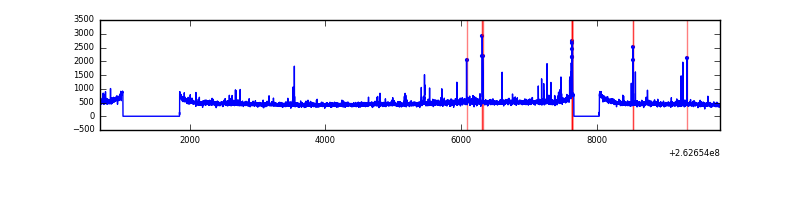 |
| C | 9138 | 7930 | 0 | 0 | 0.00% | 0.00% | 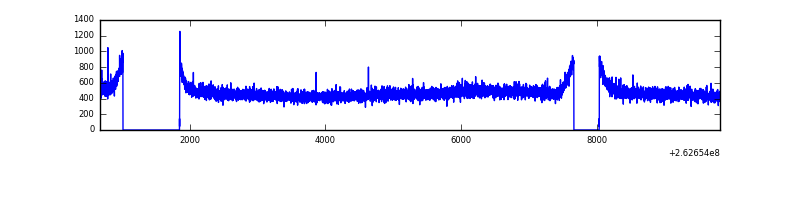 |
| D | 9138 | 7930 | 44 | 44 | 0.48% | 0.55% | 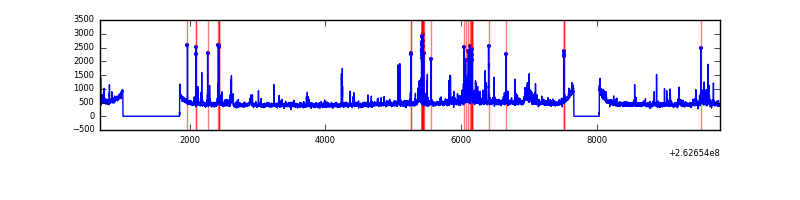 |
Top three noisy pixels from each quadrant. If the there are fewer than three noisy pixels in the level2.evt file, extra rows are filled as -1
| Pixel properties | Quadrant properties | ||||||
|---|---|---|---|---|---|---|---|
| Quadrant | DetID | PixID | Counts | Sigma | Mean | Median | Sigma |
| A | 1 | 162 | 29474 | 149.62 | 937 | 917 | 190.9 |
| A | 8 | 15 | 26178 | 132.35 | 937 | 917 | 190.9 |
| A | 14 | 111 | 15813 | 78.05 | 937 | 917 | 190.9 |
| B | 3 | 64 | 51170 | 282.7 | 947 | 923 | 177.7 |
| B | 0 | 189 | 38449 | 211.13 | 947 | 923 | 177.7 |
| B | 10 | 245 | 30072 | 164.0 | 947 | 923 | 177.7 |
| C | 3 | 233 | 123741 | 570.19 | 927 | 933 | 215.4 |
| C | 8 | 128 | 11236 | 47.84 | 927 | 933 | 215.4 |
| C | 13 | 61 | 6725 | 26.89 | 927 | 933 | 215.4 |
| D | 9 | 68 | 137646 | 619.36 | 913 | 885 | 220.8 |
| D | 13 | 189 | 134908 | 606.96 | 913 | 885 | 220.8 |
| D | 1 | 52 | 66138 | 295.52 | 913 | 885 | 220.8 |
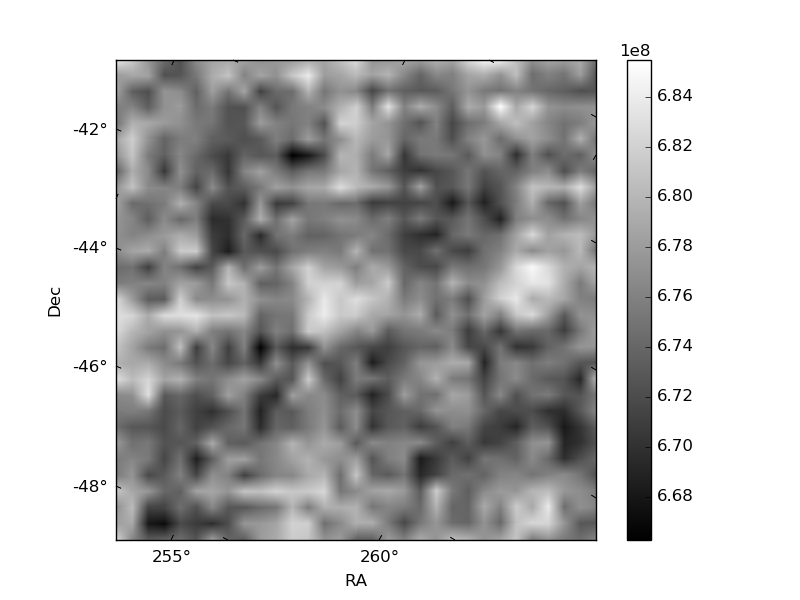
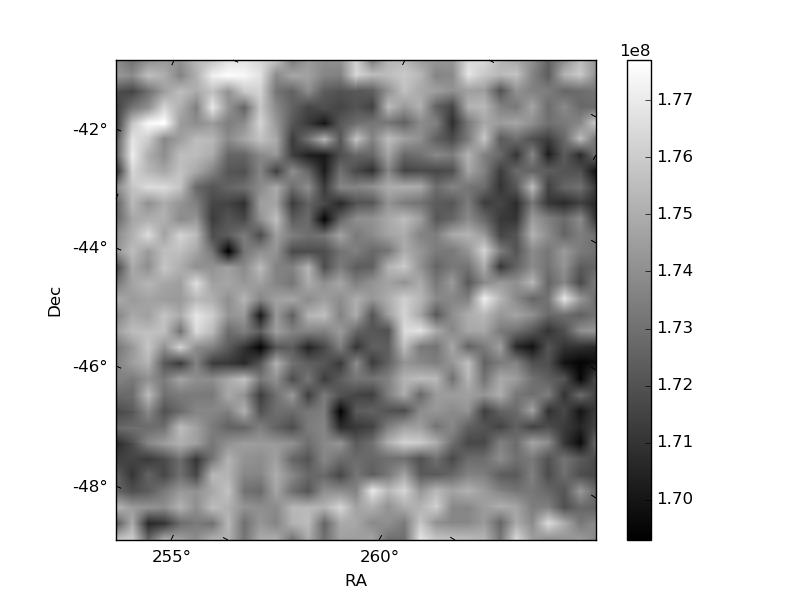
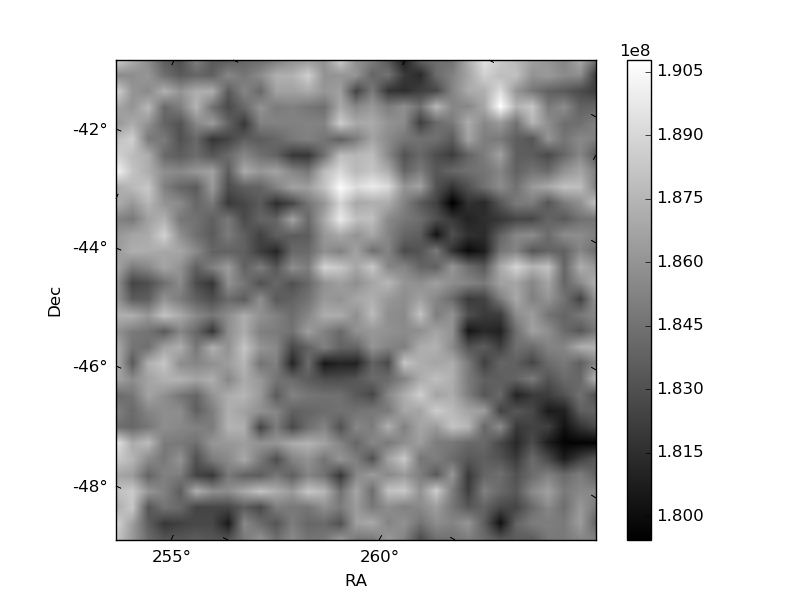
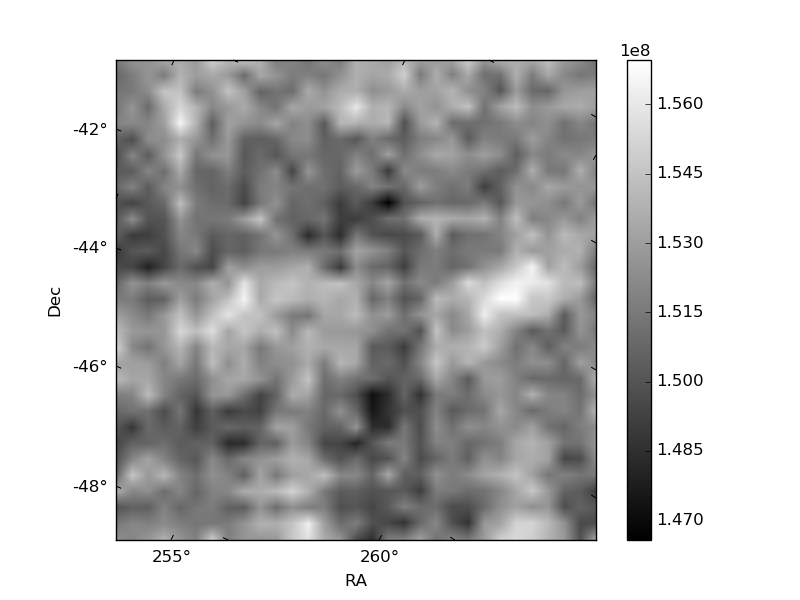
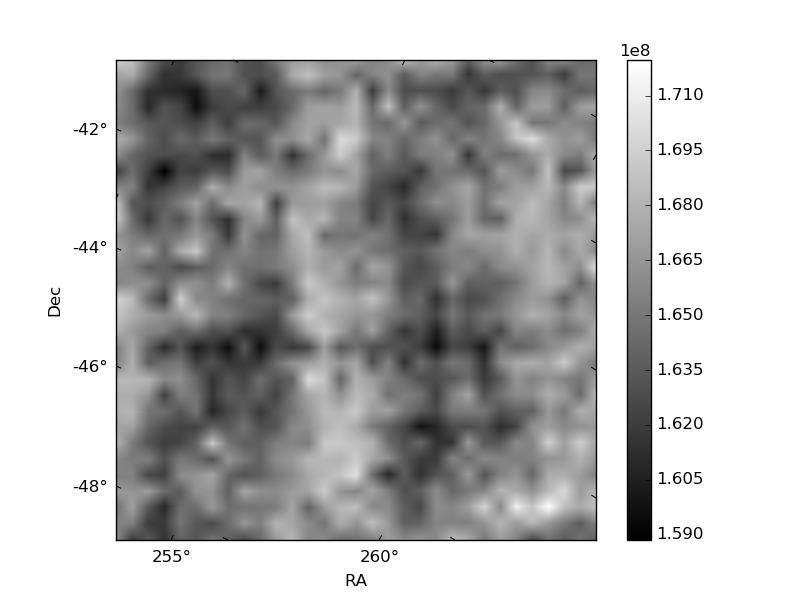
Histogram calculated using DETX and DETY for each event in the final _common_clean file
| Quadrant A |  |
 |
Quadrant B |
|---|---|---|---|
| Quadrant D |  |
 |
Quadrant C |
| Plot type | Count rate plots | Images |
|---|---|---|
| Comparison with Poisson distribution Blue bars denote a histogram of data divided into 1 sec bins. Red curve is a Poisson curve with rate = median count rate of data. |
 |
 |
| Quadrant-wise count rates Data is divided into 100 sec bins |
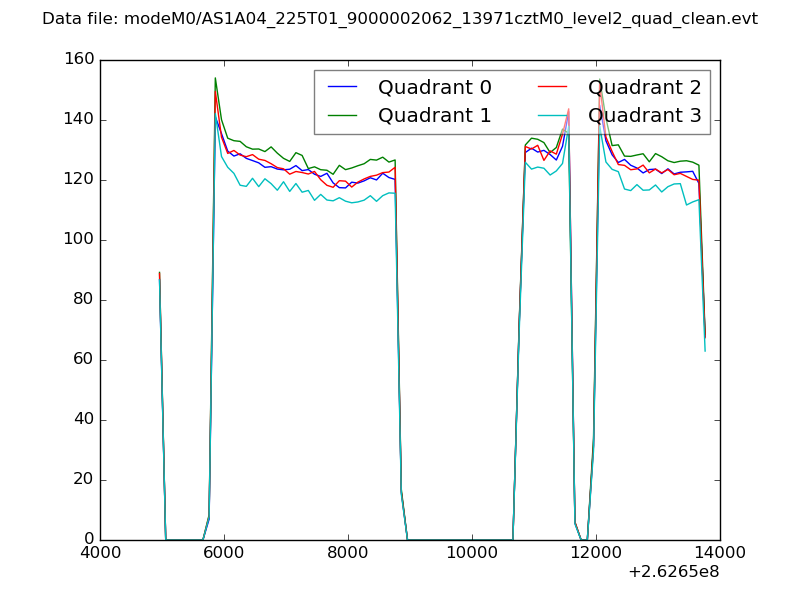 |
|
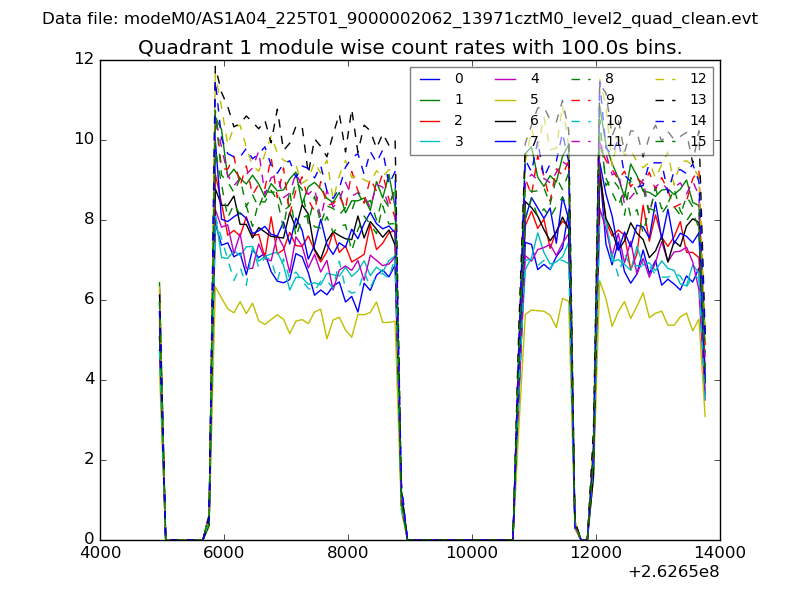
| Module-wise count rates for Quadrant A Data is divided into 100 sec bins |
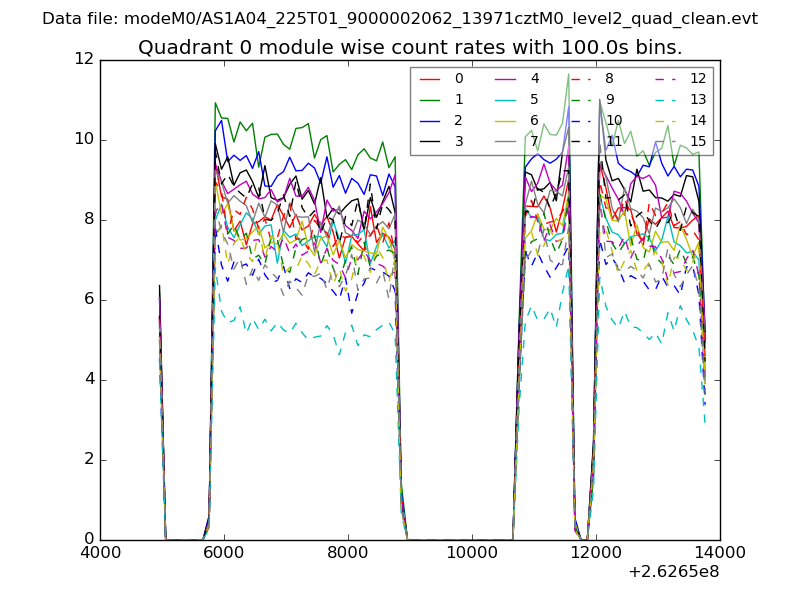 |
 |
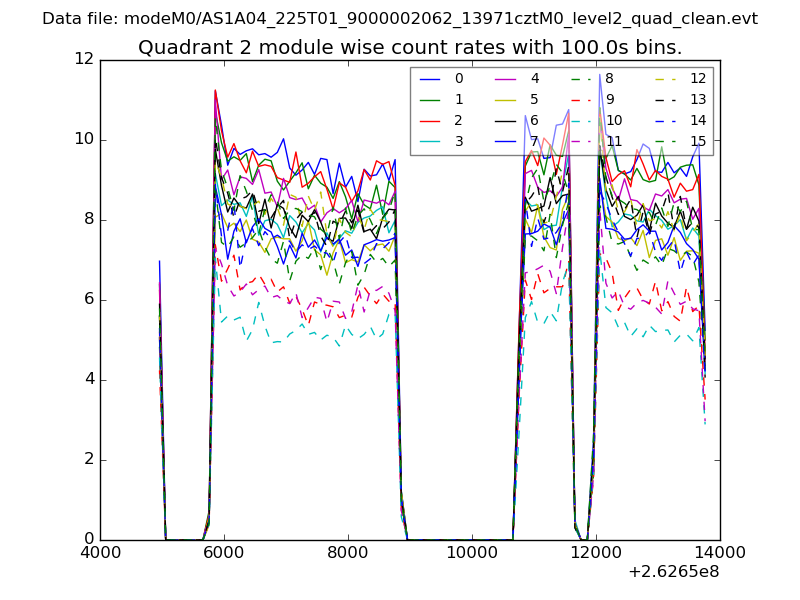
| Module-wise count rates for Quadrant B Data is divided into 100 sec bins |
 |
 |
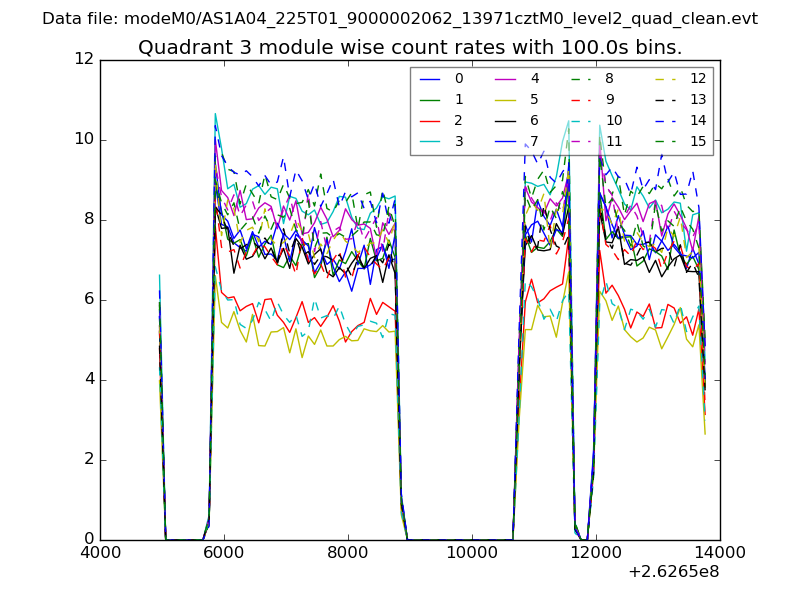
| Module-wise count rates for Quadrant C Data is divided into 100 sec bins |
 |
 |
| Module-wise count rates for Quadrant D Data is divided into 100 sec bins |
 |
 |
| Parameter | Plot |
|---|---|
| CZT HV Monitor | 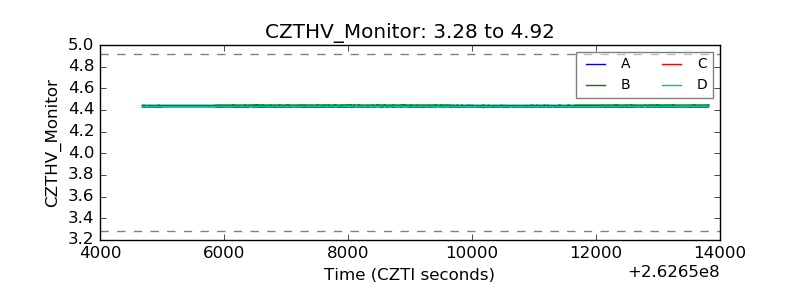 |
| D_VDD | 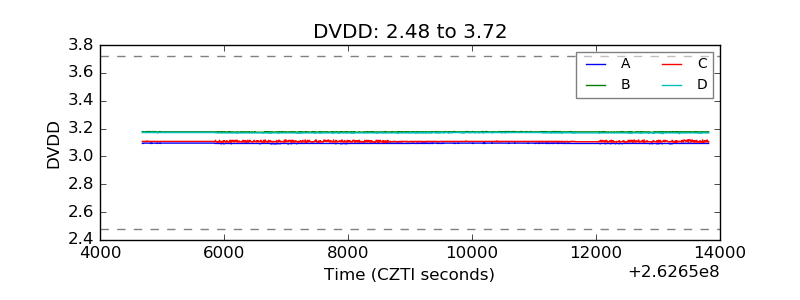 |
| Temperature 1 | 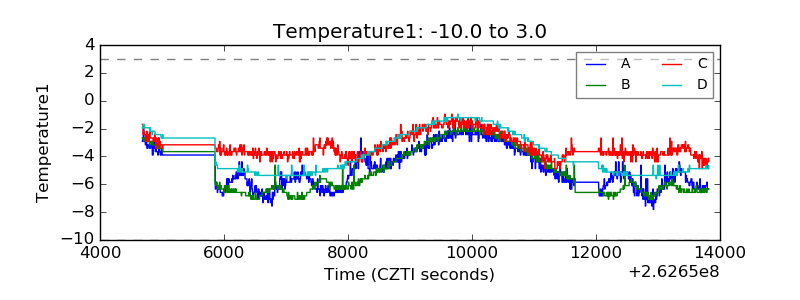 |
| Veto HV Monitor |  |
| Veto LLD | 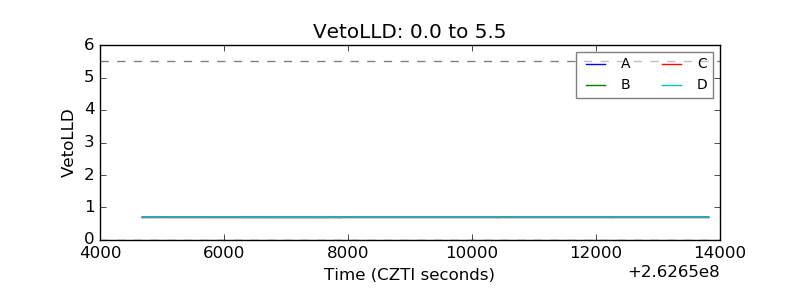 |
| Alpha Counter | 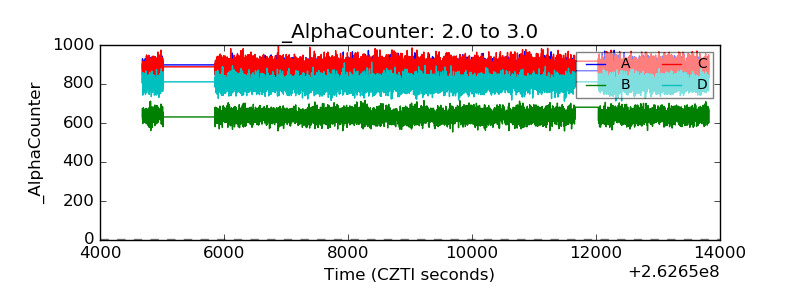 |
| _CPM_Rate | 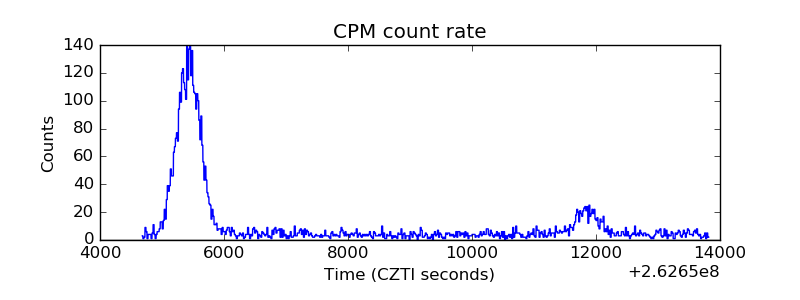 |
| CZT Counter | 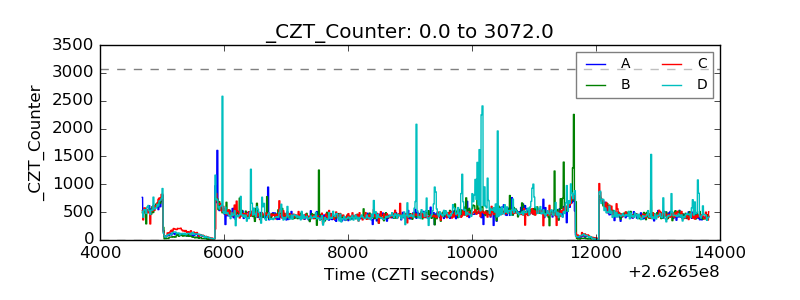 |
| +2.5 Volts monitor |  |
| +5 Volts monitor | 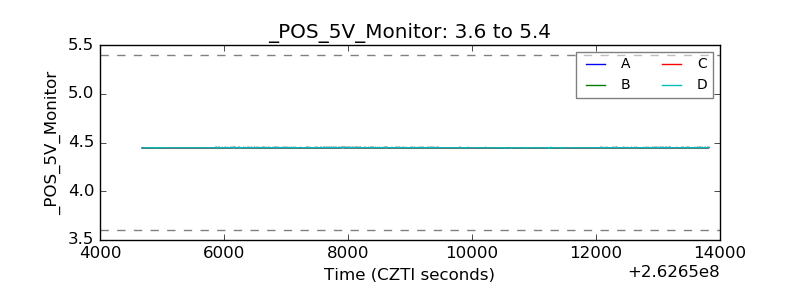 |
| _ROLL_ROT | 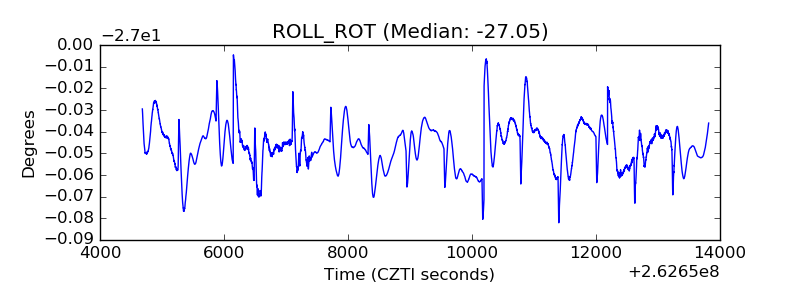 |
| _Roll_DEC |  |
| _Roll_RA | 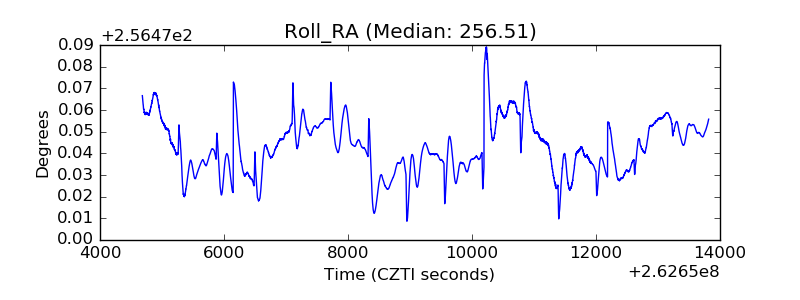 |
| Veto Counter | 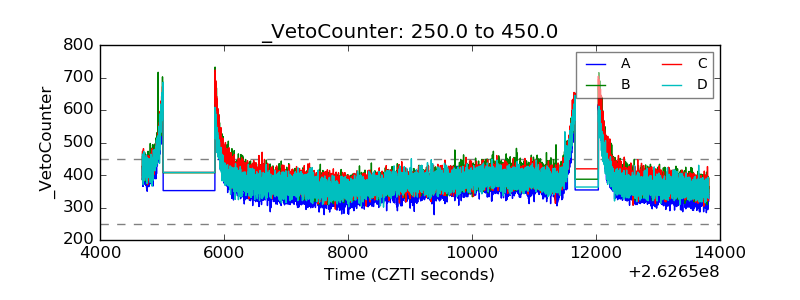 |