| Param | Original file | Final file |
|---|---|---|
| Filename | modeM0/AS1A04_225T01_9000002062_13976cztM0_level2.evt | modeM0/AS1A04_225T01_9000002062_13976cztM0_level2_quad_clean.evt |
| Size (bytes) | 135,239,040 | 38,779,200 |
| Size | 129.0 MB | 37.0 MB |
| Events in quadrant A | 938,585 | 257,277 |
| Events in quadrant B | 1,011,859 | 265,585 |
| Events in quadrant C | 987,438 | 257,593 |
| Events in quadrant D | 1,015,404 | 244,449 |
| Mode SS | |||
|---|---|---|---|
| Quadrant | BADHDUFLAG | Total packets | Discarded packets |
| A | 0 | 44 | 0 |
| B | 0 | 44 | 0 |
| C | 0 | 44 | 0 |
| D | 0 | 44 | 0 |
| Mode M0 | |||
|---|---|---|---|
| Quadrant | BADHDUFLAG | Total packets | Discarded packets |
| A | 0 | 4288 | 1 |
| B | 0 | 4423 | 1 |
| C | 0 | 4305 | 1 |
| D | 0 | 4485 | 1 |
| Mode M9 | |||
|---|---|---|---|
| Quadrant | BADHDUFLAG | Total packets | Discarded packets |
| A | 0 | 4 | 0 |
| B | 0 | 4 | 0 |
| C | 0 | 4 | 0 |
| D | 0 | 4 | 0 |
| Quadrant | Total seconds | Saturated seconds | Saturation percentage |
|---|---|---|---|
| A | 2052 | 16 | 0.779727% |
| B | 2052 | 54 | 2.631579% |
| C | 2052 | 25 | 1.218324% |
| D | 2052 | 25 | 1.218324% |
Noise dominated data is calculated using 1-second bins in cleaned event files. If a bin has >2000 counts, and if more than 50% of those come from <1% of pixels, then it is considered to be noise-dominated and hence unusable.
| Quadrant | # 1 sec bins | Bins with >0 counts | Bins with >2000 counts | High rate bins dominated by noise | Noise dominated (total time) | Noise dominated (detector-on time) | Marked lightcurve |
|---|---|---|---|---|---|---|---|
| A | 2428 | 2054 | 0 | 0 | 0.00% | 0.00% | 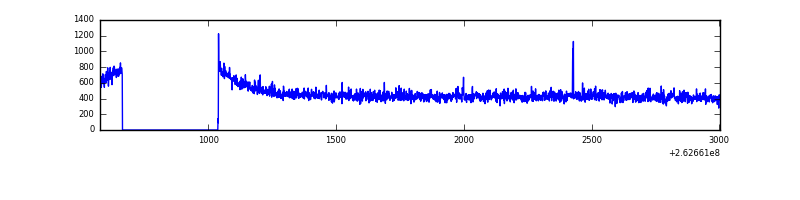 |
| B | 2428 | 2054 | 8 | 8 | 0.33% | 0.39% | 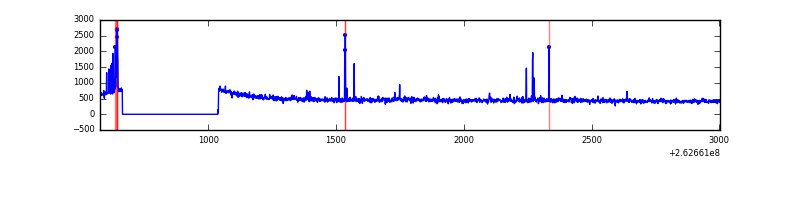 |
| C | 2428 | 2054 | 0 | 0 | 0.00% | 0.00% | 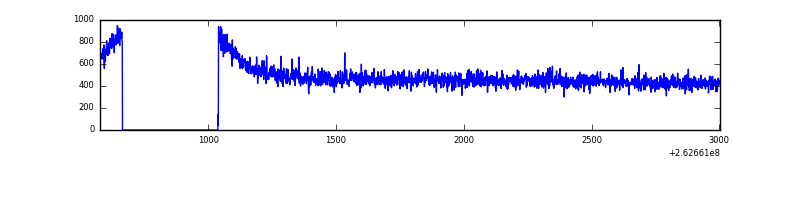 |
| D | 2428 | 2054 | 2 | 2 | 0.08% | 0.10% | 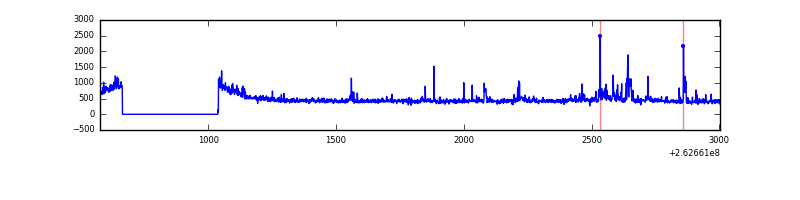 |
Top three noisy pixels from each quadrant. If the there are fewer than three noisy pixels in the level2.evt file, extra rows are filled as -1
| Pixel properties | Quadrant properties | ||||||
|---|---|---|---|---|---|---|---|
| Quadrant | DetID | PixID | Counts | Sigma | Mean | Median | Sigma |
| A | 1 | 162 | 5560 | 105.12 | 239 | 233 | 50.7 |
| A | 8 | 15 | 4443 | 83.08 | 239 | 233 | 50.7 |
| A | 4 | 2 | 3486 | 64.19 | 239 | 233 | 50.7 |
| B | 3 | 64 | 29995 | 621.16 | 243 | 236 | 47.9 |
| B | 4 | 80 | 13466 | 276.15 | 243 | 236 | 47.9 |
| B | 0 | 189 | 6580 | 132.42 | 243 | 236 | 47.9 |
| C | 3 | 233 | 33333 | 569.81 | 242 | 243 | 58.1 |
| C | 8 | 128 | 4616 | 75.3 | 242 | 243 | 58.1 |
| C | 8 | 112 | 2294 | 35.32 | 242 | 243 | 58.1 |
| D | 13 | 189 | 27229 | 460.73 | 236 | 229 | 58.6 |
| D | 2 | 14 | 25526 | 431.67 | 236 | 229 | 58.6 |
| D | 7 | 80 | 18460 | 311.1 | 236 | 229 | 58.6 |
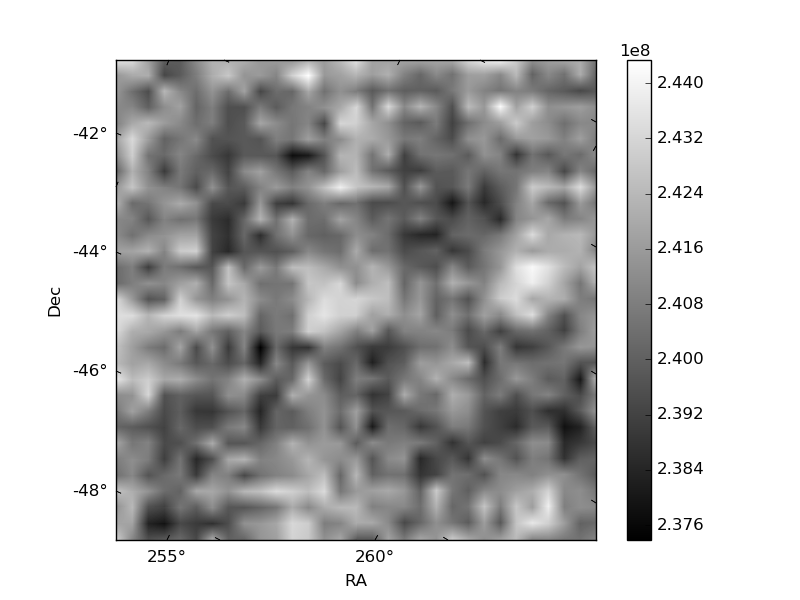
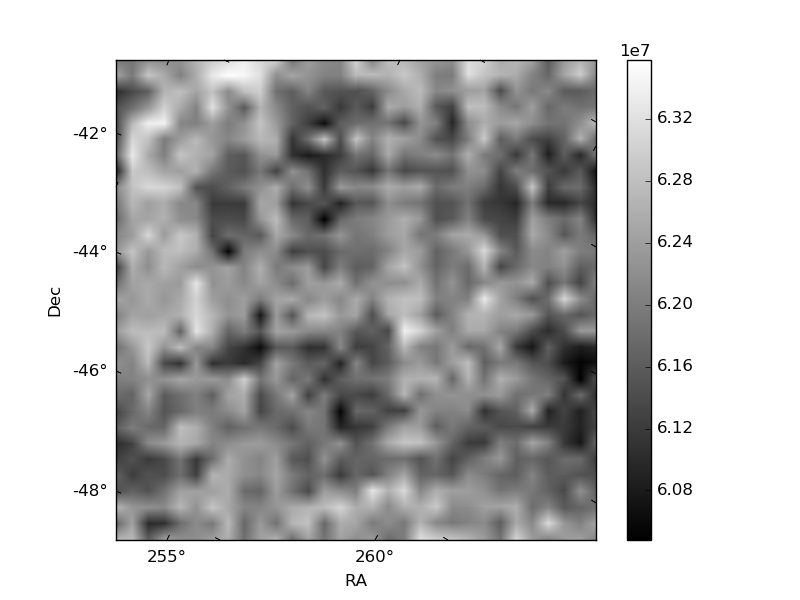
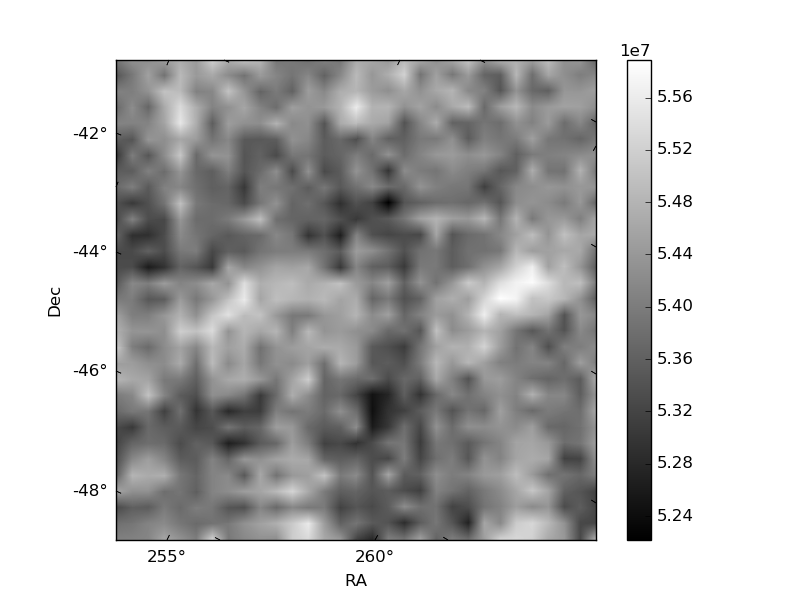
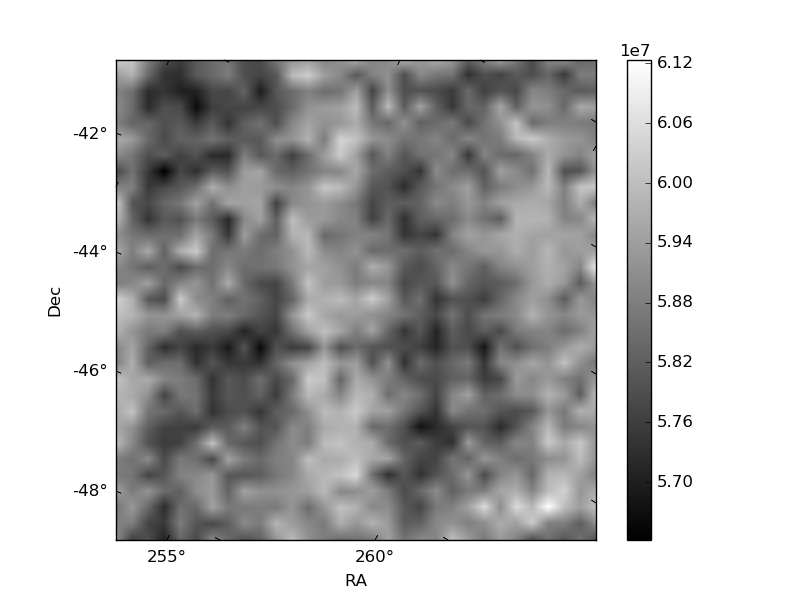
Histogram calculated using DETX and DETY for each event in the final _common_clean file
| Quadrant A | 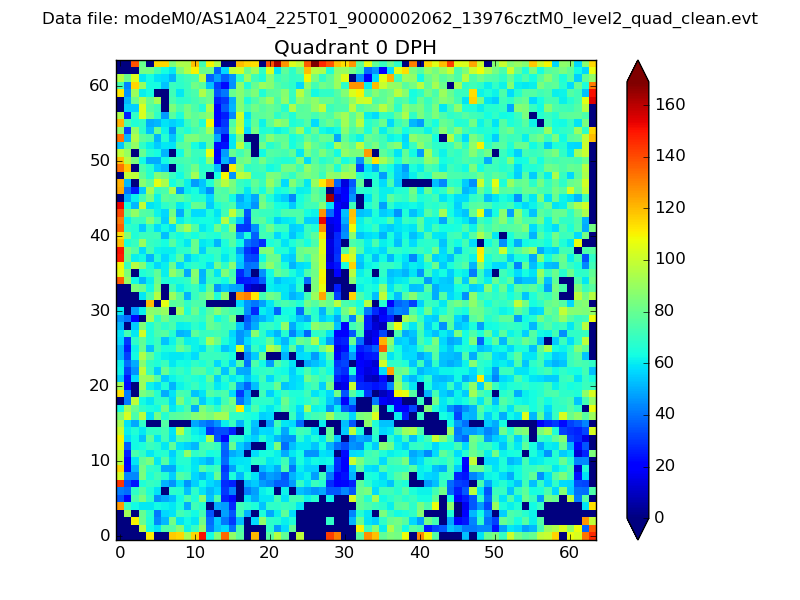 |
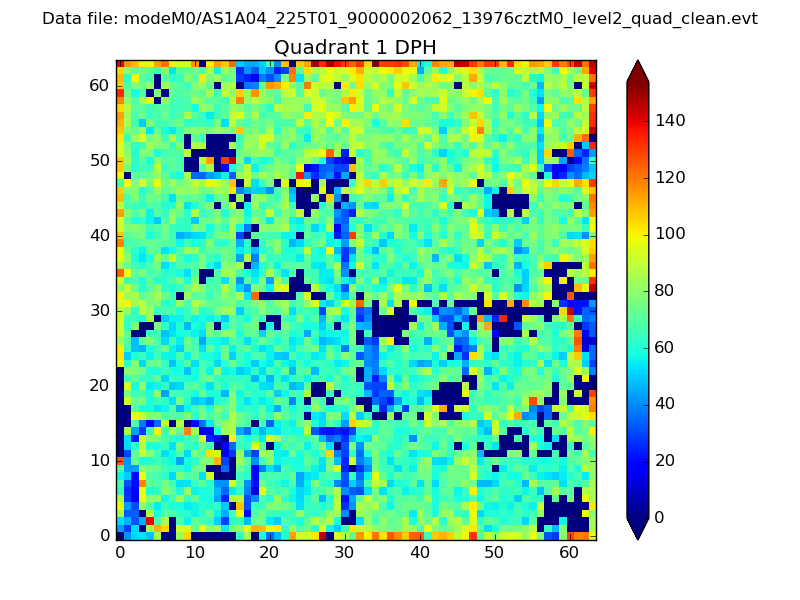 |
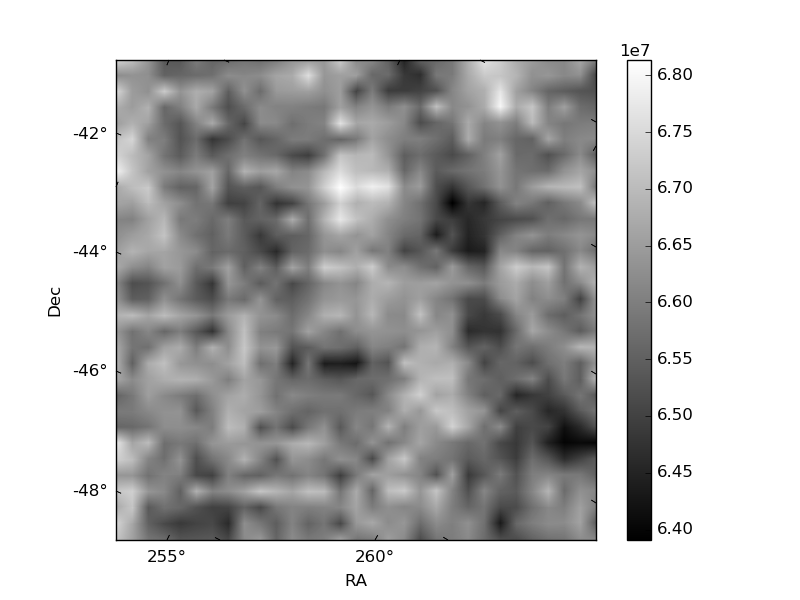
Quadrant B |
|---|---|---|---|
| Quadrant D | 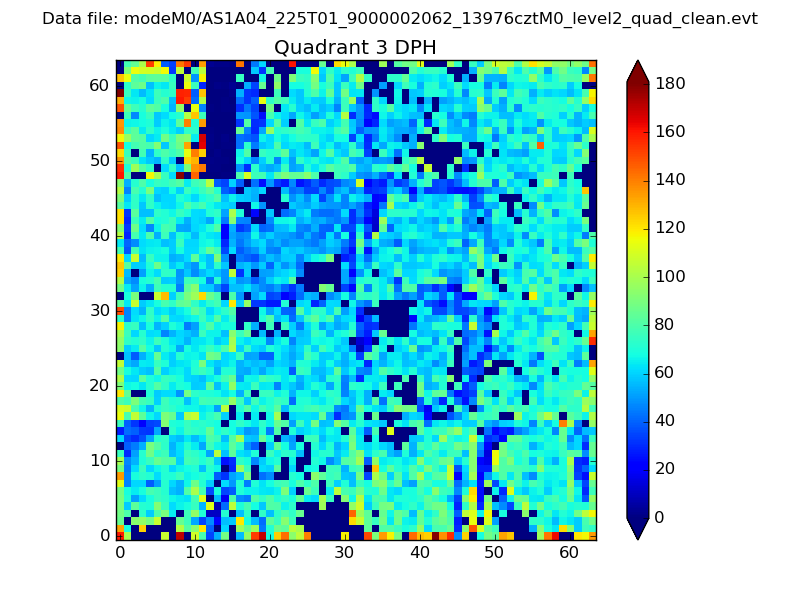 |
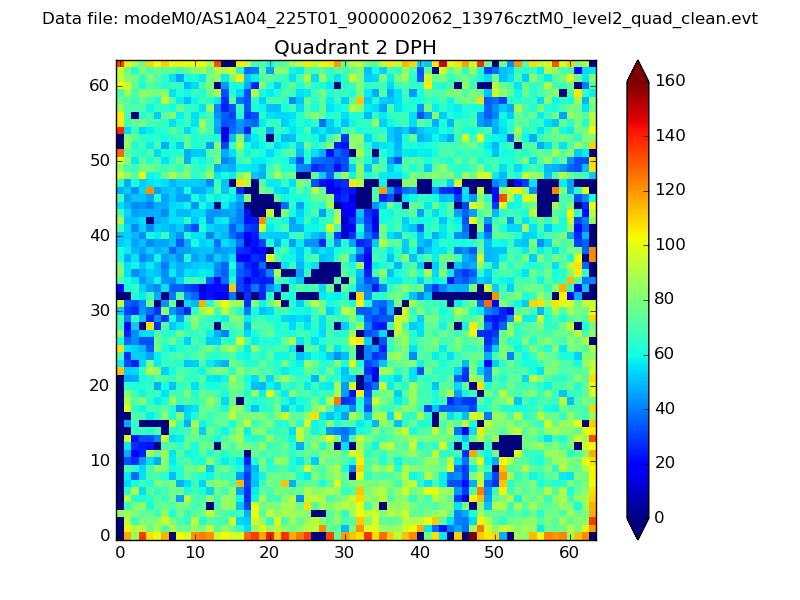 |
Quadrant C |
| Plot type | Count rate plots | Images |
|---|---|---|
| Comparison with Poisson distribution Blue bars denote a histogram of data divided into 1 sec bins. Red curve is a Poisson curve with rate = median count rate of data. |
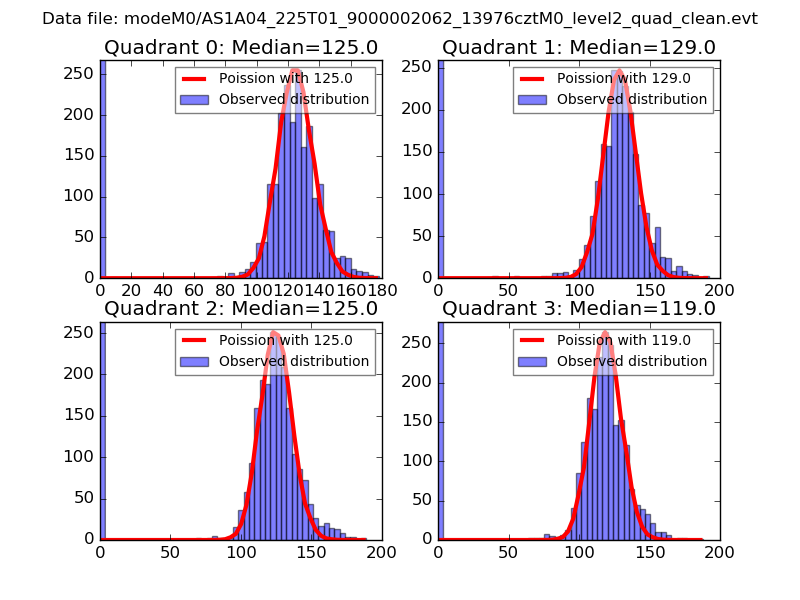 |
 |
| Quadrant-wise count rates Data is divided into 100 sec bins |
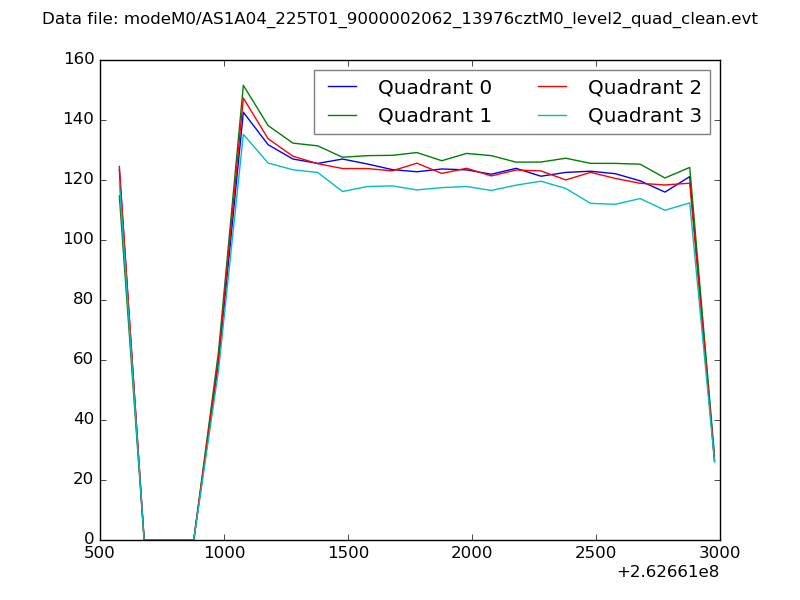 |
|
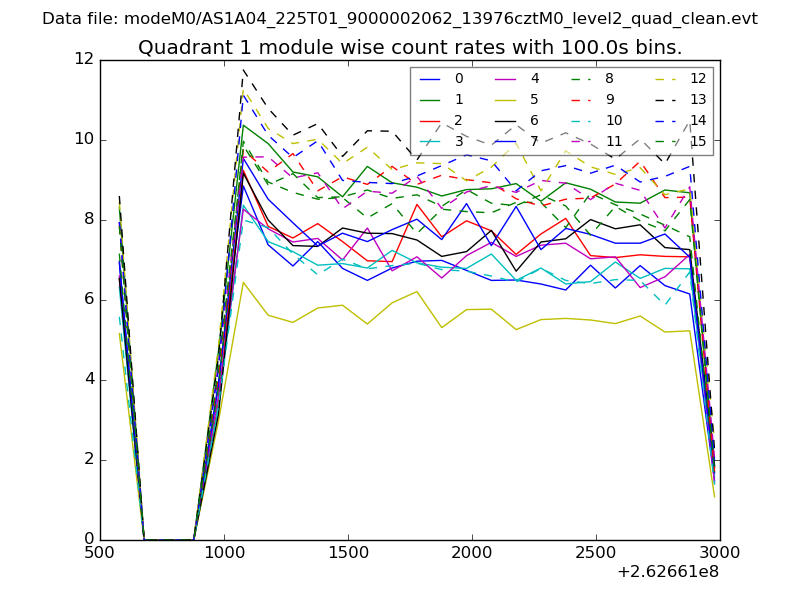
| Module-wise count rates for Quadrant A Data is divided into 100 sec bins |
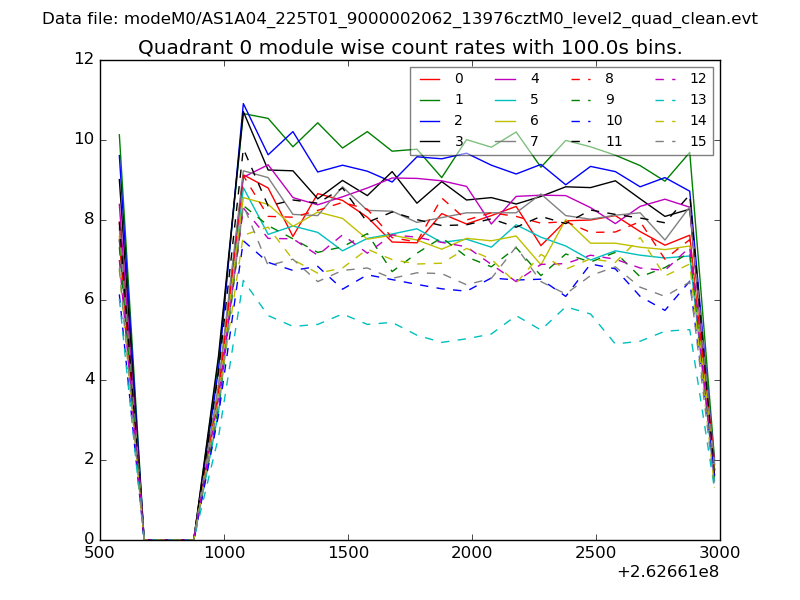 |
 |
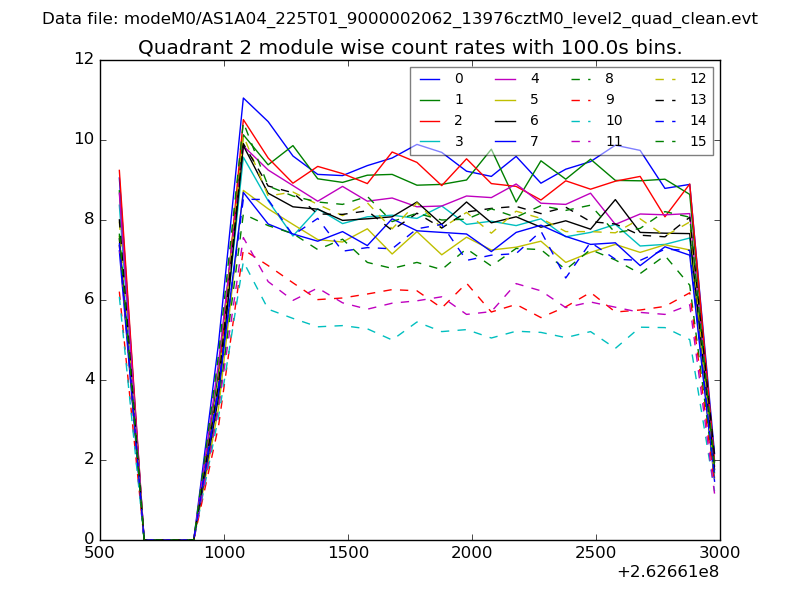
| Module-wise count rates for Quadrant B Data is divided into 100 sec bins |
 |
 |
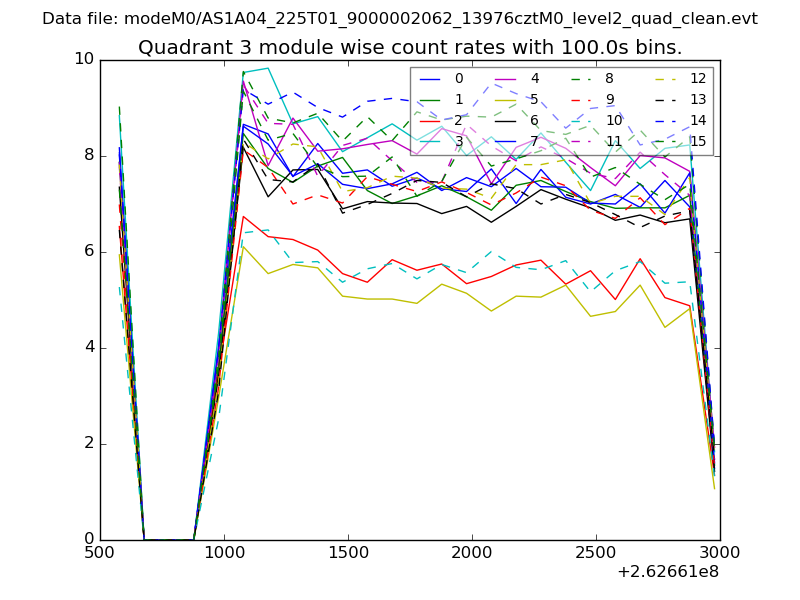
| Module-wise count rates for Quadrant C Data is divided into 100 sec bins |
 |
 |
| Module-wise count rates for Quadrant D Data is divided into 100 sec bins |
 |
 |
| Parameter | Plot |
|---|---|
| CZT HV Monitor | 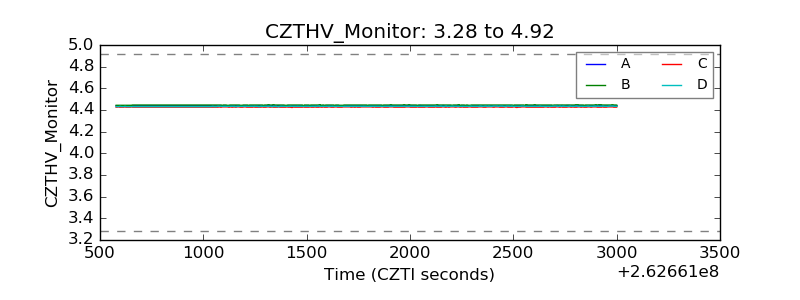 |
| D_VDD | 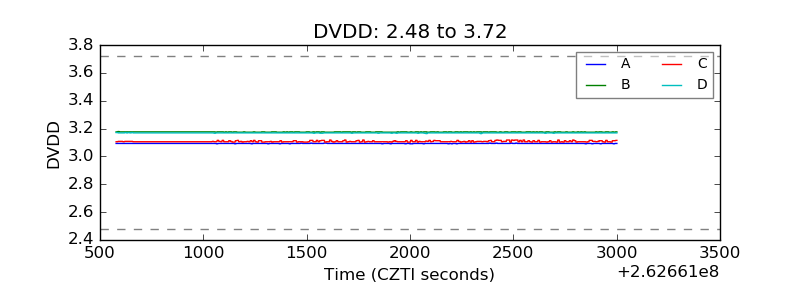 |
| Temperature 1 | 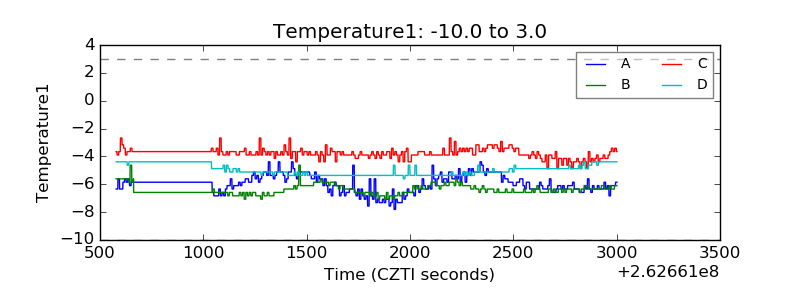 |
| Veto HV Monitor | 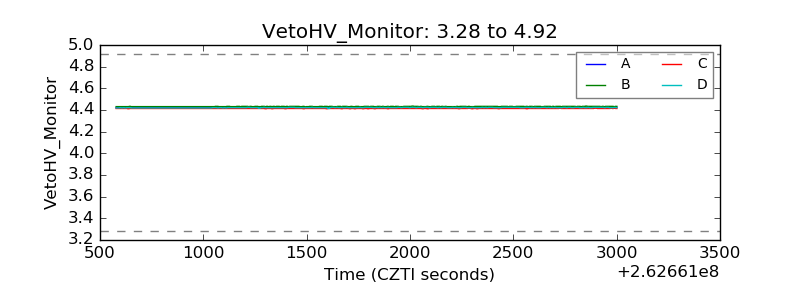 |
| Veto LLD | 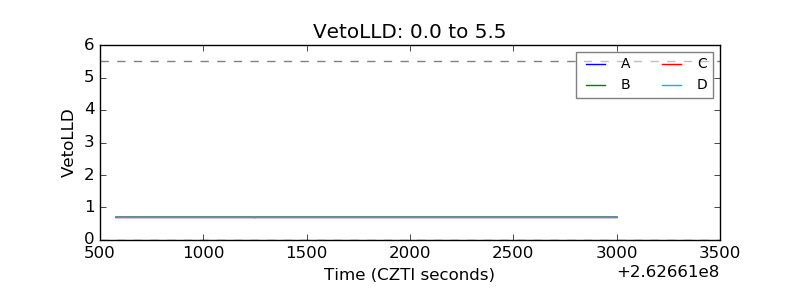 |
| Alpha Counter | 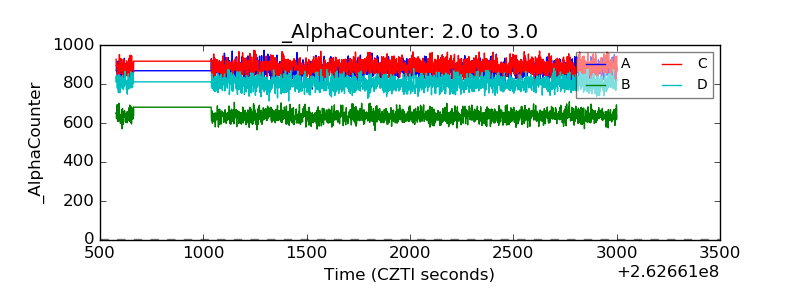 |
| _CPM_Rate | 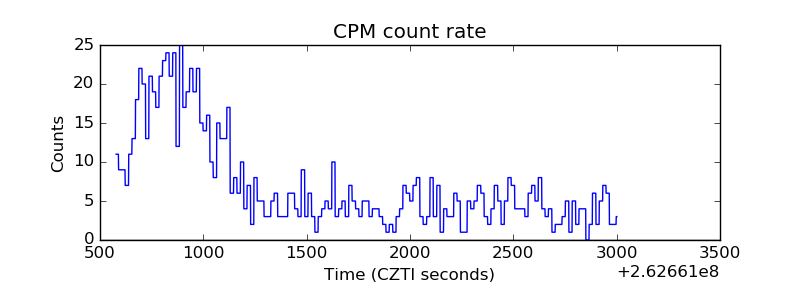 |
| CZT Counter | 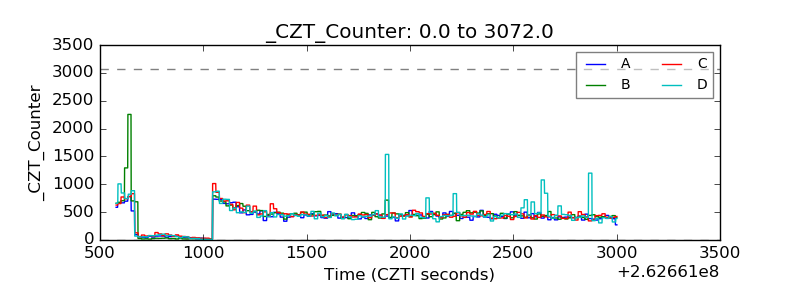 |
| +2.5 Volts monitor |  |
| +5 Volts monitor |  |
| _ROLL_ROT | 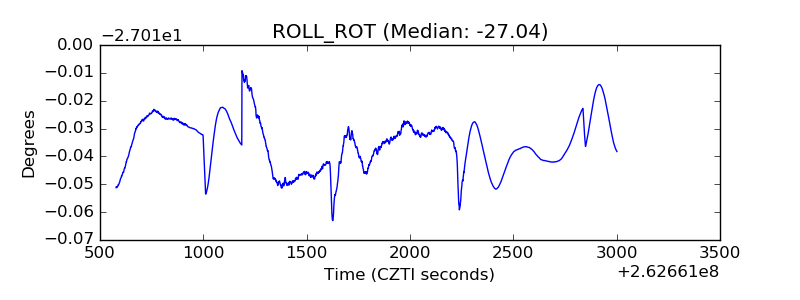 |
| _Roll_DEC | 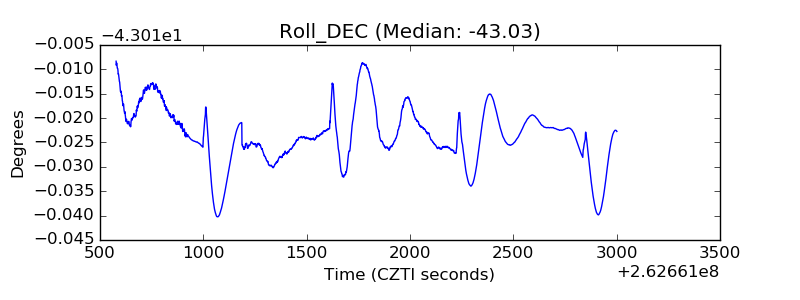 |
| _Roll_RA | 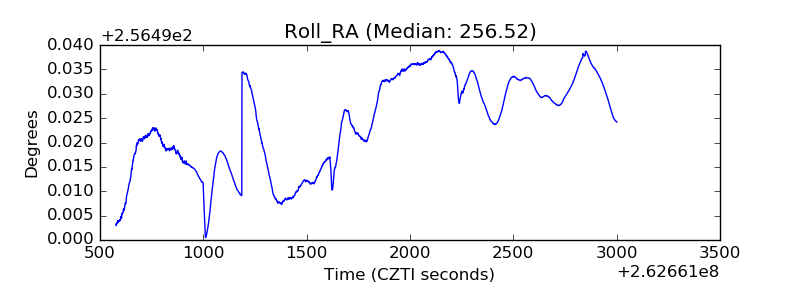 |
| Veto Counter | 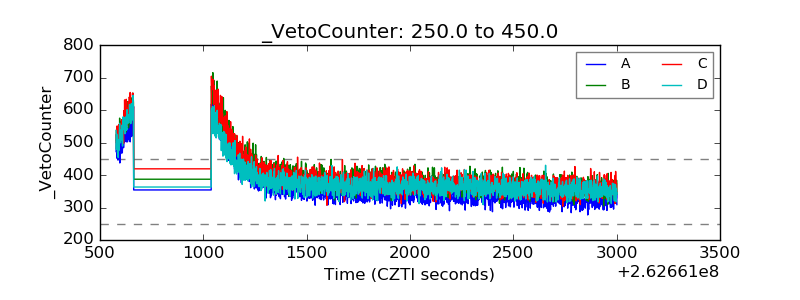 |