| Param | Original file | Final file |
|---|---|---|
| Filename | modeM0/AS1A04_122T01_9000002064cztM0_level2.fits | modeM0/AS1A04_122T01_9000002064cztM0_level2_quad_clean.evt |
| Size (bytes) | 969,007,680 | 1,018,566,720 |
| Size | 924.1 MB | 971.4 MB |
| Events in quadrant A | 5,932,866 | 6,272,565 |
| Events in quadrant B | 5,781,338 | 6,709,465 |
| Events in quadrant C | 5,803,854 | 5,794,994 |
| Events in quadrant D | 4,871,914 | 5,118,289 |
| Mode M9 | |||
|---|---|---|---|
| Quadrant | BADHDUFLAG | Total packets | Discarded packets |
| A | 0 | 131 | 0 |
| B | 0 | 131 | 0 |
| C | 0 | 131 | 0 |
| D | 0 | 131 | 0 |
| Mode SS | |||
|---|---|---|---|
| Quadrant | BADHDUFLAG | Total packets | Discarded packets |
| A | 0 | 2058 | 0 |
| B | 0 | 2058 | 0 |
| C | 0 | 2058 | 0 |
| D | 0 | 2058 | 0 |
| Mode M0 | |||
|---|---|---|---|
| Quadrant | BADHDUFLAG | Total packets | Discarded packets |
| A | 0 | 215357 | 0 |
| B | 0 | 218363 | 0 |
| C | 0 | 213416 | 0 |
| D | 0 | 289027 | 0 |
| Quadrant | Total seconds | Saturated seconds | Saturation percentage |
|---|---|---|---|
| A | 101460 | 1709 | 1.684408% |
| B | 101461 | 1884 | 1.856871% |
| C | 101461 | 1089 | 1.073319% |
| D | 101461 | 5591 | 5.510492% |
Noise dominated data is calculated using 1-second bins in cleaned event files. If a bin has >2000 counts, and if more than 50% of those come from <1% of pixels, then it is considered to be noise-dominated and hence unusable.
| Quadrant | # 1 sec bins | Bins with >0 counts | Bins with >2000 counts | High rate bins dominated by noise | Noise dominated (total time) | Noise dominated (detector-on time) | Marked lightcurve |
|---|---|---|---|---|---|---|---|
| A | 114576 | 101455 | 0 | 0 | 0.00% | 0.00% |  |
| B | 114576 | 101457 | 0 | 0 | 0.00% | 0.00% |  |
| C | 114575 | 101460 | 0 | 0 | 0.00% | 0.00% | 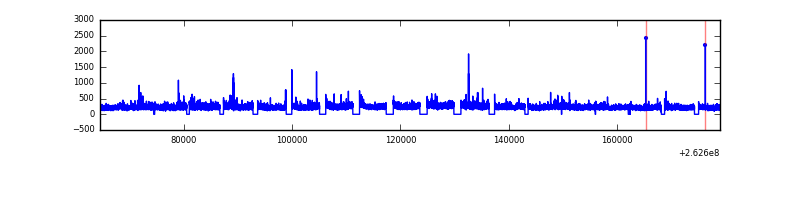 |
| D | 114576 | 101417 | 0 | 0 | 0.00% | 0.00% |  |
Top three noisy pixels from each quadrant. If the there are fewer than three noisy pixels in the level2.evt file, extra rows are filled as -1
| Pixel properties | Quadrant properties | ||||||
|---|---|---|---|---|---|---|---|
| Quadrant | DetID | PixID | Counts | Sigma | Mean | Median | Sigma |
| A | 14 | 188 | 6062 | 12.02 | 1540 | 1441 | 384.5 |
| A | 0 | 29 | 5893 | 11.58 | 1540 | 1441 | 384.5 |
| A | 14 | 204 | 5016 | 9.3 | 1540 | 1441 | 384.5 |
| B | 2 | 9 | 4953 | 11.71 | 1525 | 1456 | 298.5 |
| B | 14 | 254 | 3834 | 7.97 | 1525 | 1456 | 298.5 |
| B | 3 | 17 | 3815 | 7.9 | 1525 | 1456 | 298.5 |
| C | 12 | 241 | 4086 | 6.65 | 1534 | 1424 | 400.2 |
| C | 7 | 111 | 3928 | 6.26 | 1534 | 1424 | 400.2 |
| C | 2 | 191 | 3897 | 6.18 | 1534 | 1424 | 400.2 |
| D | 6 | 231 | 3588 | 6.22 | 1389 | 1256 | 375.2 |
| D | 3 | 14 | 3508 | 6.0 | 1389 | 1256 | 375.2 |
| D | 7 | 5 | 3410 | 5.74 | 1389 | 1256 | 375.2 |
Histogram calculated using DETX and DETY for each event in the final _common_clean file
| Quadrant A |  |
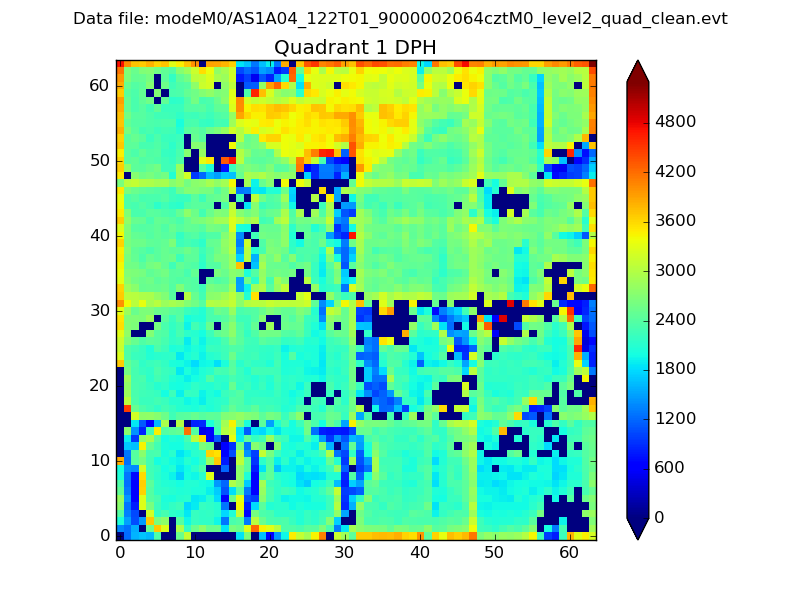 |
Quadrant B |
|---|---|---|---|
| Quadrant D |  |
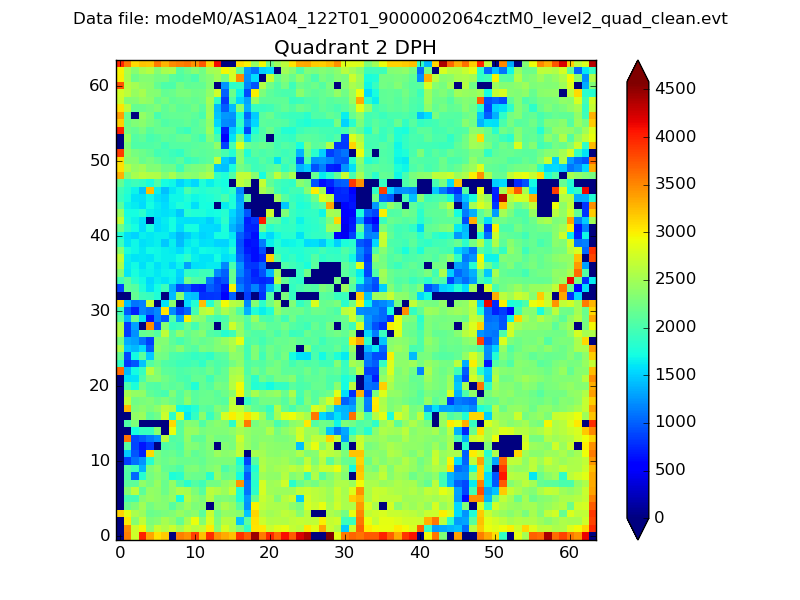 |
Quadrant C |
| Plot type | Count rate plots | Images |
|---|---|---|
| Comparison with Poisson distribution Blue bars denote a histogram of data divided into 1 sec bins. Red curve is a Poisson curve with rate = median count rate of data. |
 |
 |
| Quadrant-wise count rates Data is divided into 100 sec bins |
 |
|
| Module-wise count rates for Quadrant A Data is divided into 100 sec bins |
 |
 |
| Module-wise count rates for Quadrant B Data is divided into 100 sec bins |
 |
 |
| Module-wise count rates for Quadrant C Data is divided into 100 sec bins |
 |
 |
| Module-wise count rates for Quadrant D Data is divided into 100 sec bins |
 |
 |
| Parameter | Plot |
|---|---|
| CZT HV Monitor |  |
| D_VDD |  |
| Temperature 1 |  |
| Veto HV Monitor |  |
| Veto LLD |  |
| Alpha Counter |  |
| _CPM_Rate | 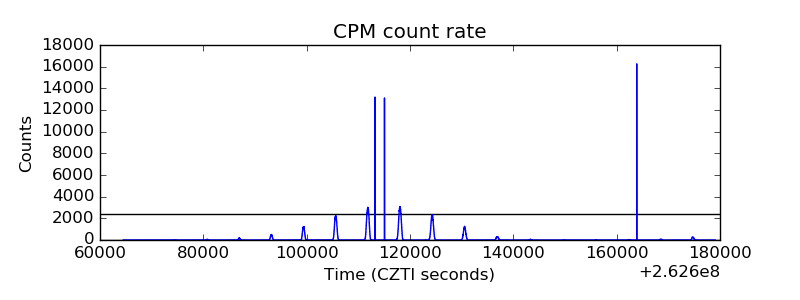 |
| CZT Counter |  |
| +2.5 Volts monitor |  |
| +5 Volts monitor |  |
| _ROLL_ROT |  |
| _Roll_DEC |  |
| _Roll_RA |  |
| Veto Counter |  |