| Param | Original file | Final file |
|---|---|---|
| Filename | modeM0/AS1A04_122T01_9000002064_13976cztM0_level2.evt | modeM0/AS1A04_122T01_9000002064_13976cztM0_level2_quad_clean.evt |
| Size (bytes) | 2,066,520,960 | 347,800,320 |
| Size | 1.9 GB | 331.7 MB |
| Events in quadrant A | 14,683,205 | 2,159,199 |
| Events in quadrant B | 14,548,009 | 2,317,652 |
| Events in quadrant C | 14,279,419 | 2,112,498 |
| Events in quadrant D | 17,155,741 | 1,990,466 |
| Mode M9 | |||
|---|---|---|---|
| Quadrant | BADHDUFLAG | Total packets | Discarded packets |
| A | 0 | 22 | 0 |
| B | 0 | 22 | 0 |
| C | 0 | 22 | 0 |
| D | 0 | 22 | 0 |
| Mode SS | |||
|---|---|---|---|
| Quadrant | BADHDUFLAG | Total packets | Discarded packets |
| A | 0 | 574 | 0 |
| B | 0 | 574 | 0 |
| C | 0 | 574 | 0 |
| D | 0 | 574 | 0 |
| Mode M0 | |||
|---|---|---|---|
| Quadrant | BADHDUFLAG | Total packets | Discarded packets |
| A | 0 | 61291 | 4 |
| B | 0 | 60616 | 3 |
| C | 0 | 59464 | 3 |
| D | 0 | 69577 | 3 |
| Quadrant | Total seconds | Saturated seconds | Saturation percentage |
|---|---|---|---|
| A | 28413 | 697 | 2.453102% |
| B | 28413 | 636 | 2.238412% |
| C | 28413 | 384 | 1.351494% |
| D | 28413 | 897 | 3.157006% |
Noise dominated data is calculated using 1-second bins in cleaned event files. If a bin has >2000 counts, and if more than 50% of those come from <1% of pixels, then it is considered to be noise-dominated and hence unusable.
| Quadrant | # 1 sec bins | Bins with >0 counts | Bins with >2000 counts | High rate bins dominated by noise | Noise dominated (total time) | Noise dominated (detector-on time) | Marked lightcurve |
|---|---|---|---|---|---|---|---|
| A | 30629 | 28418 | 84 | 84 | 0.27% | 0.30% | 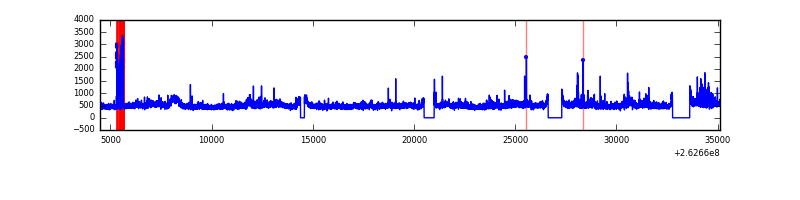 |
| B | 30629 | 28418 | 66 | 66 | 0.22% | 0.23% | 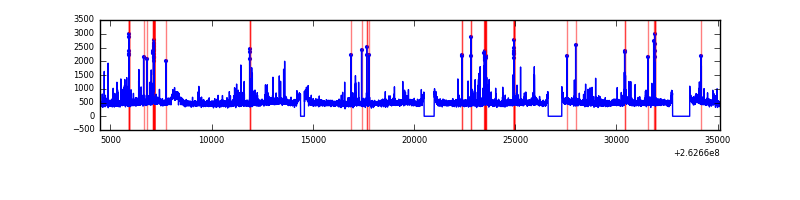 |
| C | 30629 | 28418 | 1 | 1 | 0.00% | 0.00% | 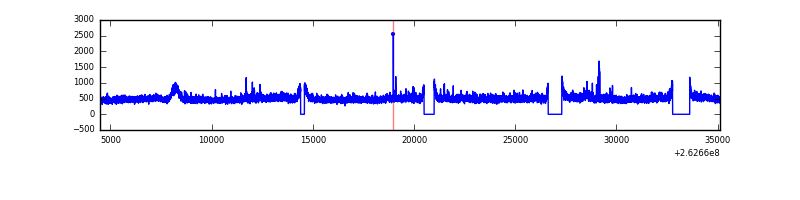 |
| D | 30629 | 28418 | 438 | 438 | 1.43% | 1.54% | 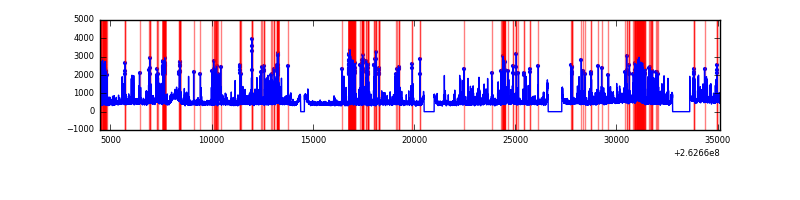 |
Top three noisy pixels from each quadrant. If the there are fewer than three noisy pixels in the level2.evt file, extra rows are filled as -1
| Pixel properties | Quadrant properties | ||||||
|---|---|---|---|---|---|---|---|
| Quadrant | DetID | PixID | Counts | Sigma | Mean | Median | Sigma |
| A | 8 | 15 | 857810 | 1230.47 | 3418 | 3341 | 694.4 |
| A | 14 | 111 | 274336 | 390.24 | 3418 | 3341 | 694.4 |
| A | 4 | 2 | 260607 | 370.47 | 3418 | 3341 | 694.4 |
| B | 3 | 64 | 165069 | 245.94 | 3465 | 3384 | 657.4 |
| B | 0 | 189 | 160328 | 238.73 | 3465 | 3384 | 657.4 |
| B | 10 | 245 | 135859 | 201.51 | 3465 | 3384 | 657.4 |
| C | 3 | 233 | 1222775 | 1581.73 | 3338 | 3350 | 770.9 |
| C | 13 | 61 | 24153 | 26.98 | 3338 | 3350 | 770.9 |
| C | 8 | 128 | 20631 | 22.41 | 3338 | 3350 | 770.9 |
| D | 13 | 122 | 1259607 | 1511.46 | 3287 | 3211 | 831.2 |
| D | 1 | 52 | 1217715 | 1461.06 | 3287 | 3211 | 831.2 |
| D | 8 | 195 | 443083 | 529.17 | 3287 | 3211 | 831.2 |
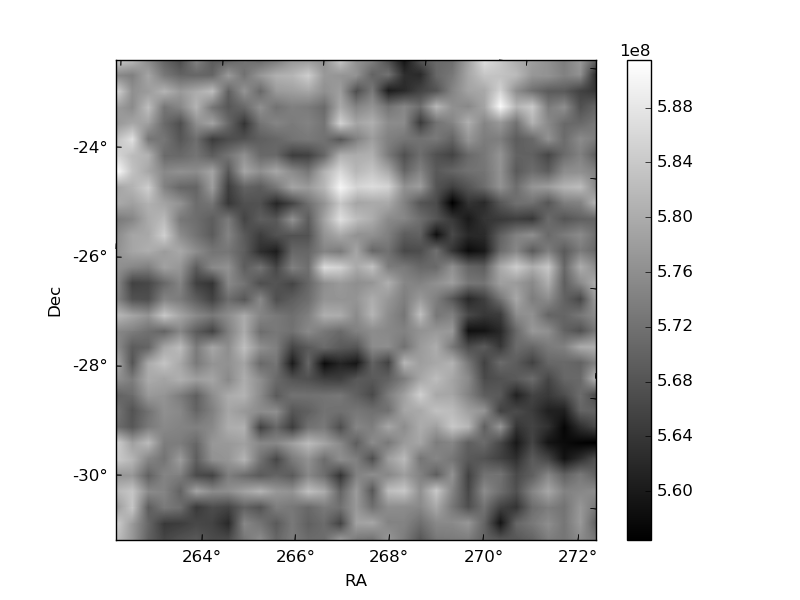
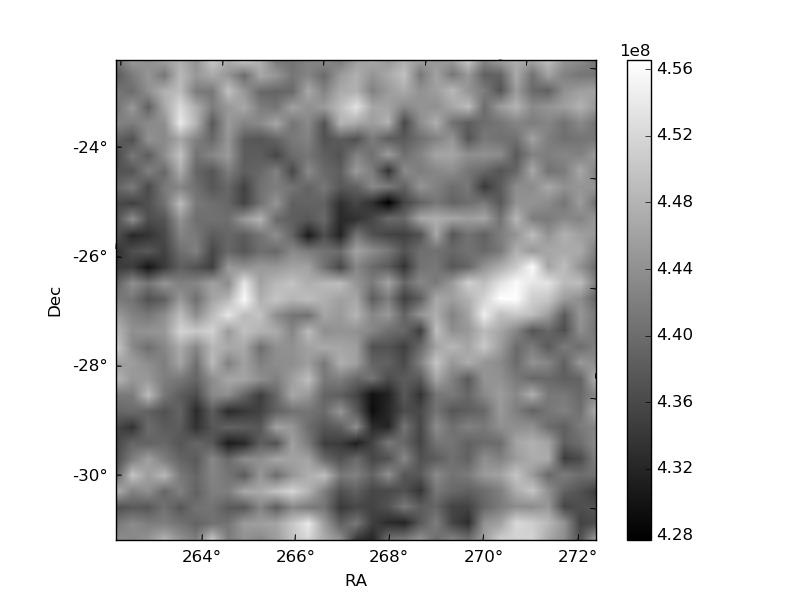
Histogram calculated using DETX and DETY for each event in the final _common_clean file
| Quadrant A | 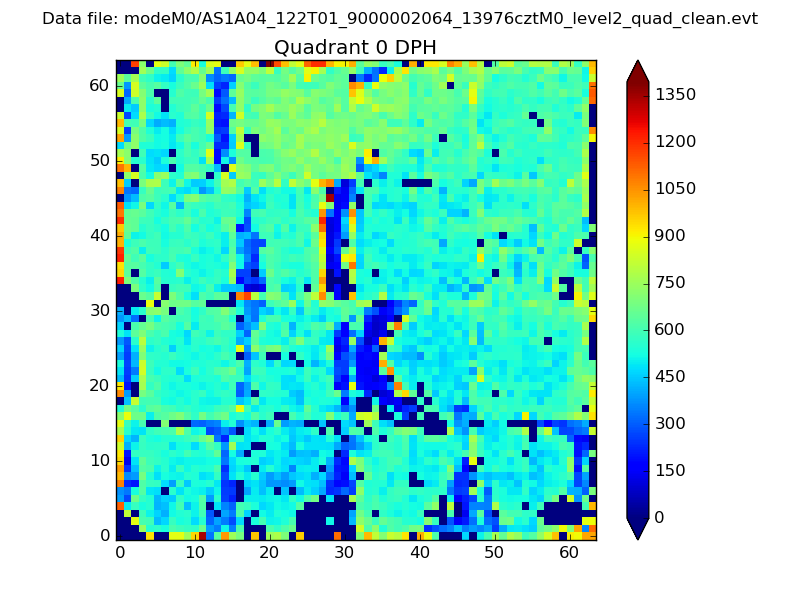 |
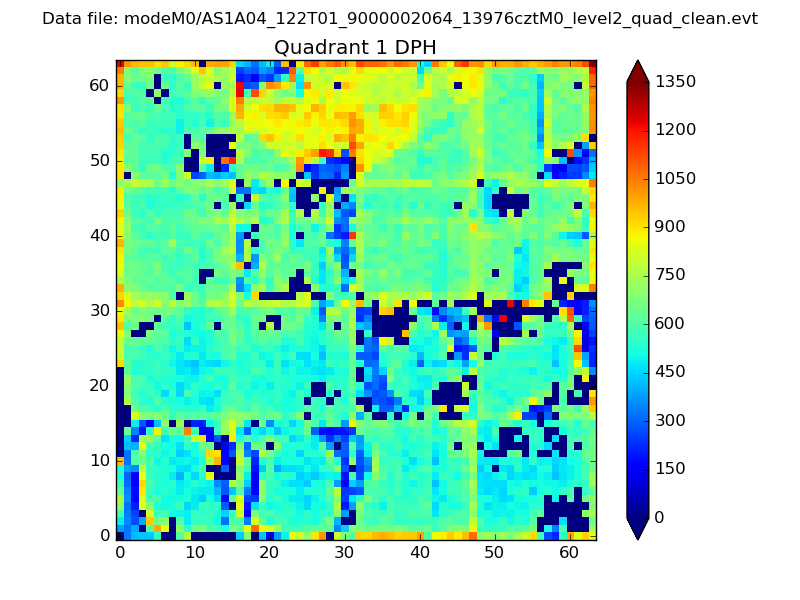 |
Quadrant B |
|---|---|---|---|
| Quadrant D | 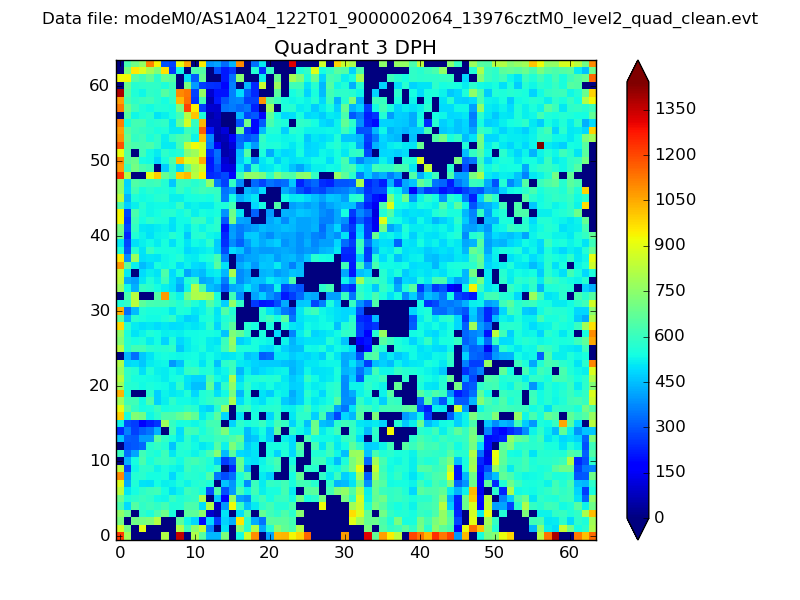 |
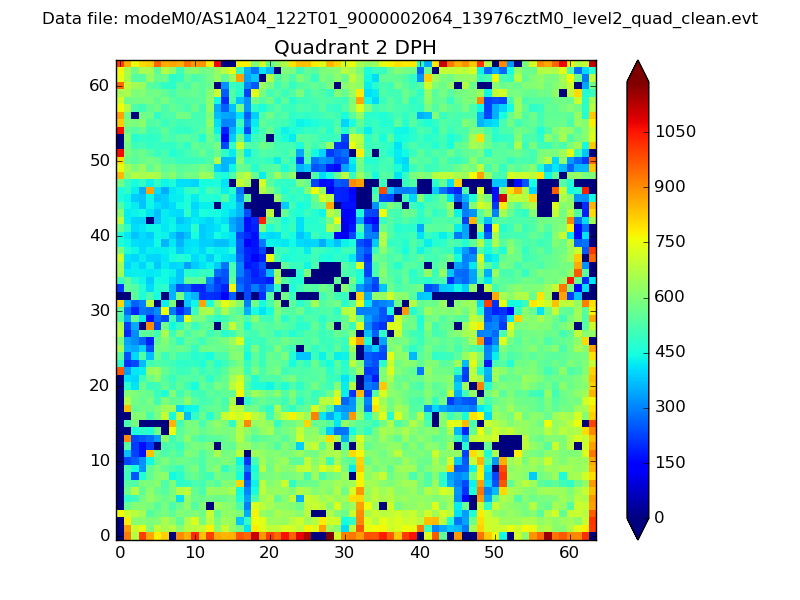 |
Quadrant C |
| Plot type | Count rate plots | Images |
|---|---|---|
| Comparison with Poisson distribution Blue bars denote a histogram of data divided into 1 sec bins. Red curve is a Poisson curve with rate = median count rate of data. |
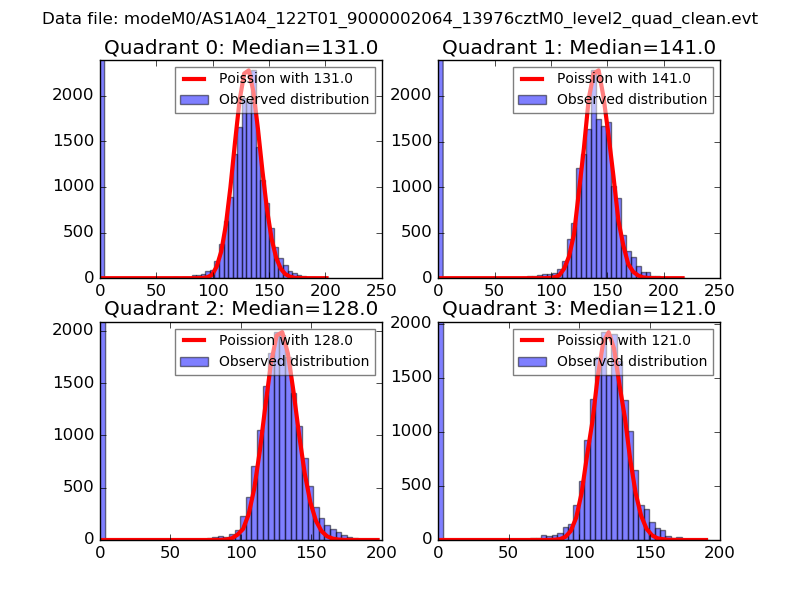 |
 |
| Quadrant-wise count rates Data is divided into 100 sec bins |
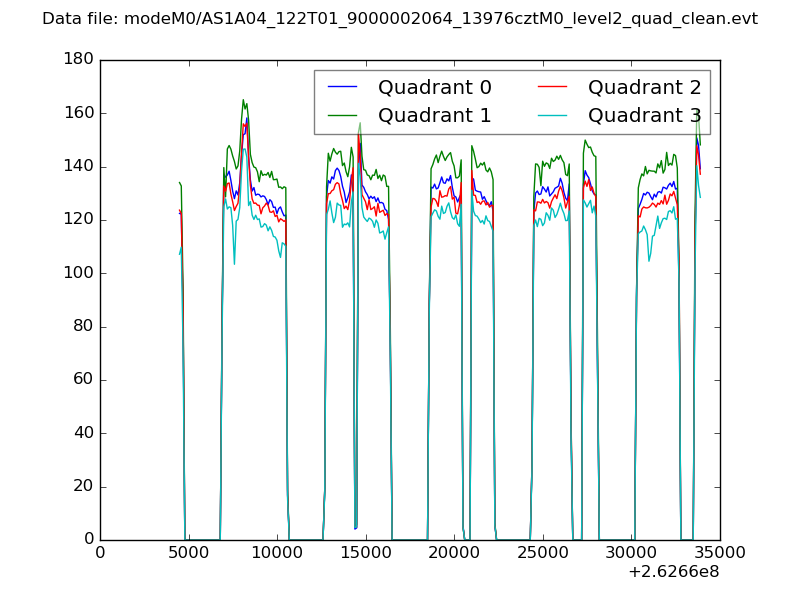 |
|
| Module-wise count rates for Quadrant A Data is divided into 100 sec bins |
 |
 |
| Module-wise count rates for Quadrant B Data is divided into 100 sec bins |
 |
 |
| Module-wise count rates for Quadrant C Data is divided into 100 sec bins |
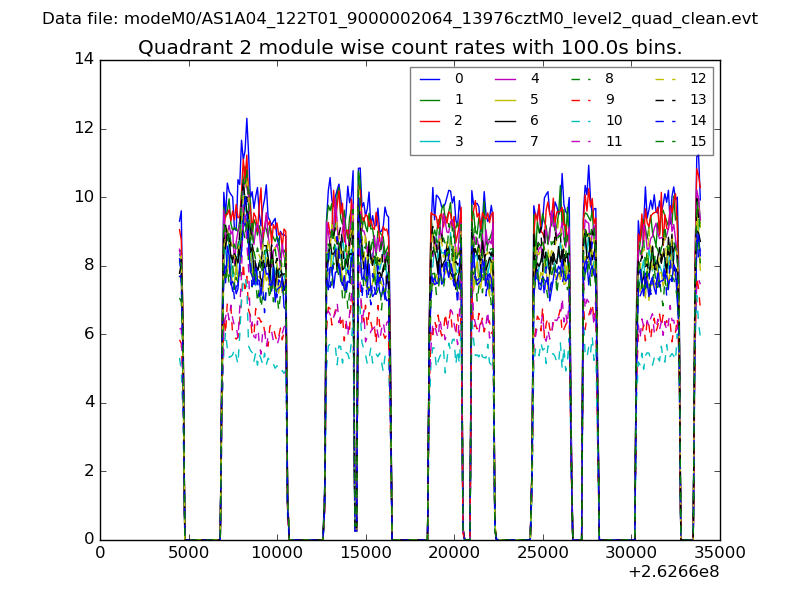 |
 |
| Module-wise count rates for Quadrant D Data is divided into 100 sec bins |
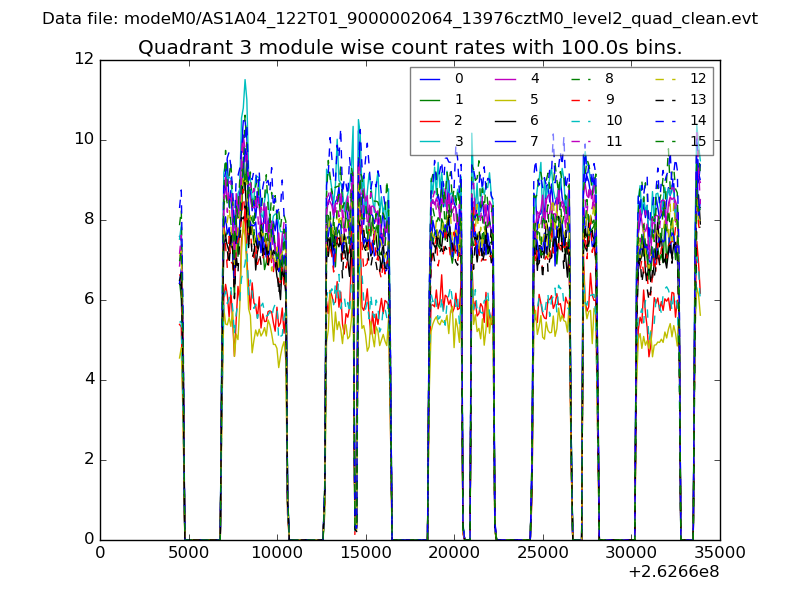 |
 |
| Parameter | Plot |
|---|---|
| CZT HV Monitor | 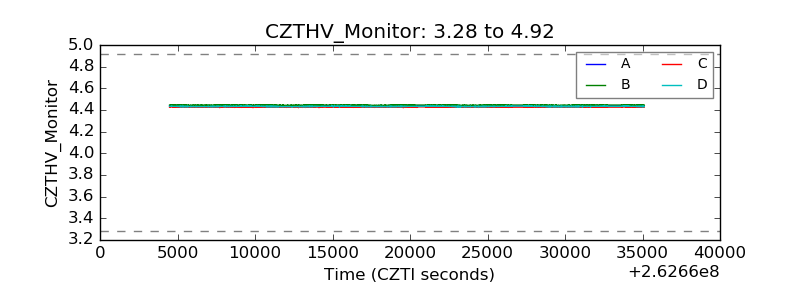 |
| D_VDD | 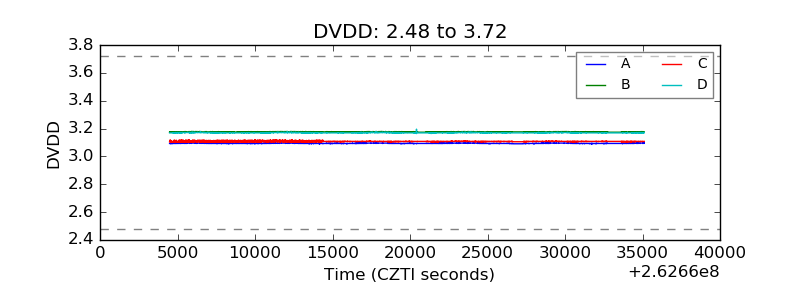 |
| Temperature 1 | 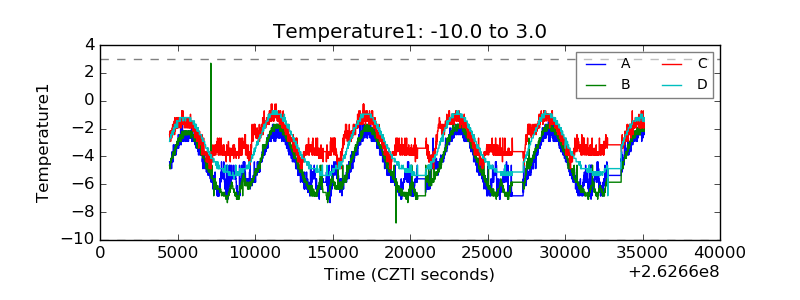 |
| Veto HV Monitor | 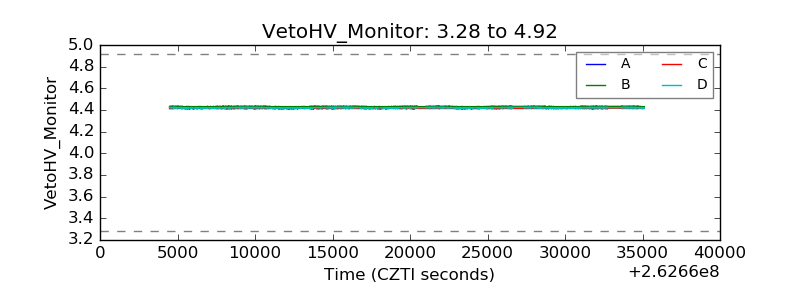 |
| Veto LLD |  |
| Alpha Counter | 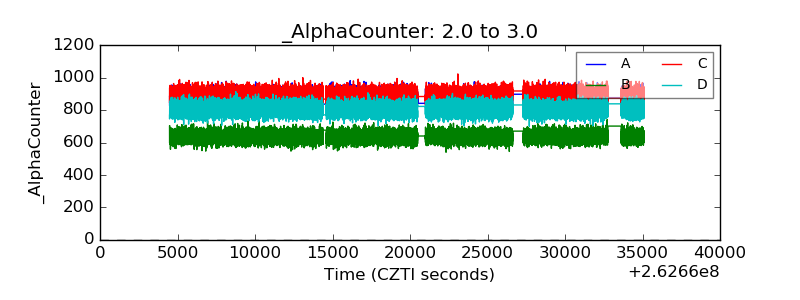 |
| _CPM_Rate | 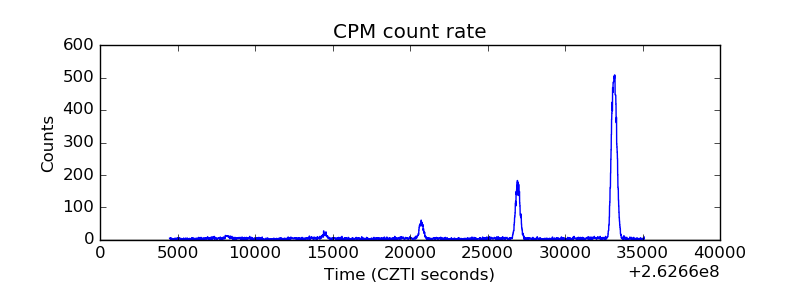 |
| CZT Counter | 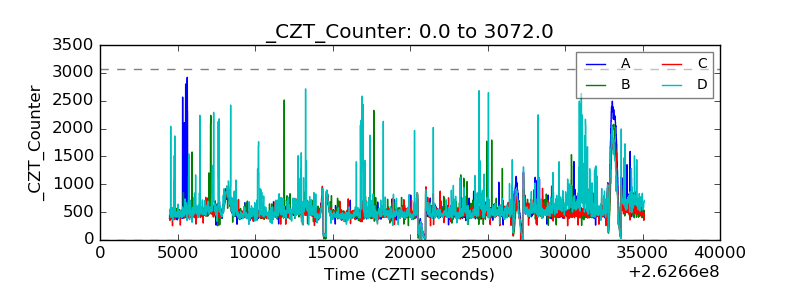 |
| +2.5 Volts monitor |  |
| +5 Volts monitor | 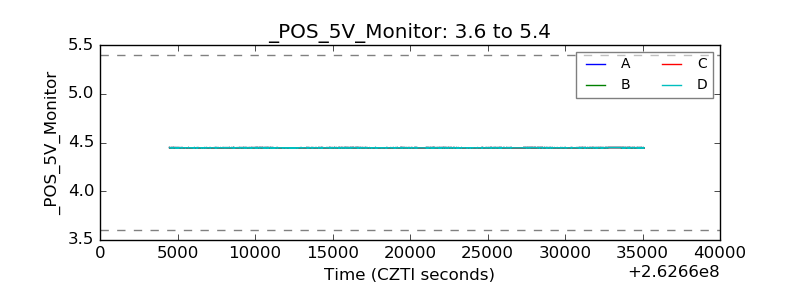 |
| _ROLL_ROT | 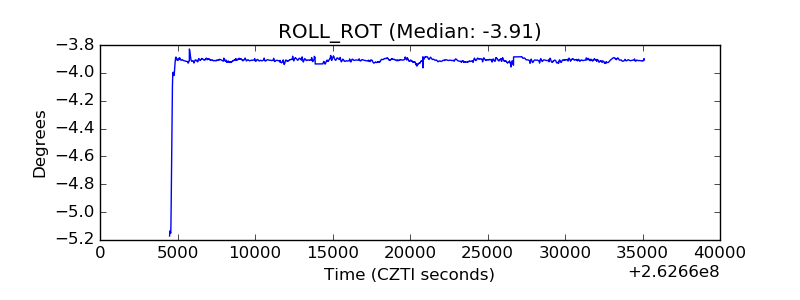 |
| _Roll_DEC | 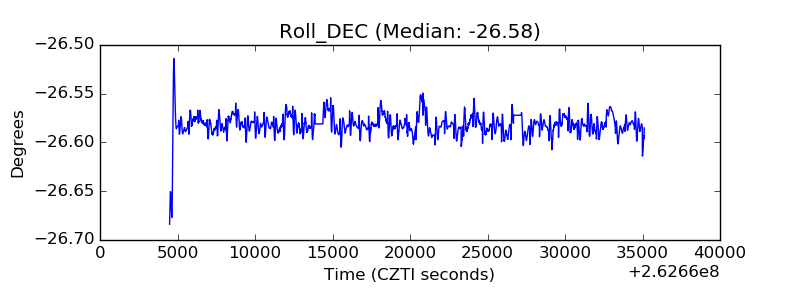 |
| _Roll_RA | 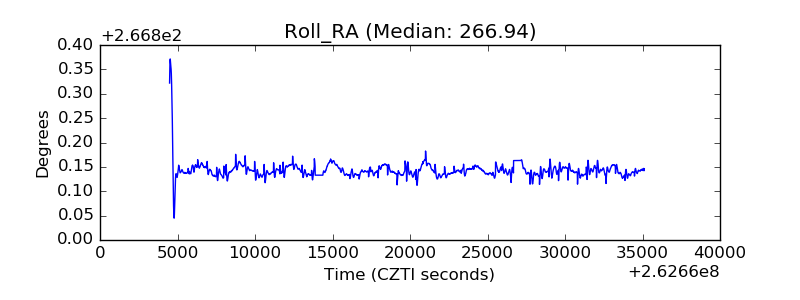 |
| Veto Counter | 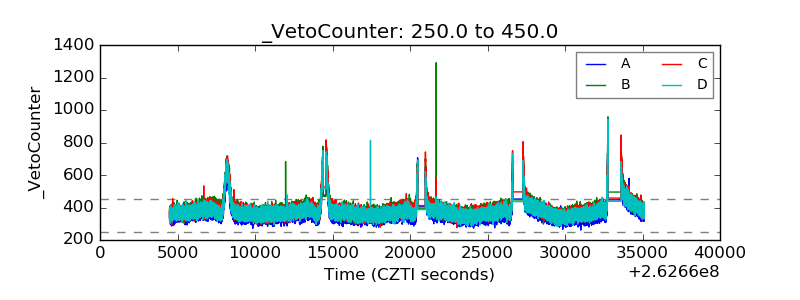 |