| Param | Original file | Final file |
|---|---|---|
| Filename | modeM0/AS1A04_122T01_9000002064_13977cztM0_level2.evt | modeM0/AS1A04_122T01_9000002064_13977cztM0_level2_quad_clean.evt |
| Size (bytes) | 557,844,480 | 69,681,600 |
| Size | 532.0 MB | 66.5 MB |
| Events in quadrant A | 3,602,037 | 416,449 |
| Events in quadrant B | 3,442,543 | 441,891 |
| Events in quadrant C | 3,361,251 | 403,814 |
| Events in quadrant D | 6,029,351 | 375,165 |
| Mode M9 | |||
|---|---|---|---|
| Quadrant | BADHDUFLAG | Total packets | Discarded packets |
| A | 0 | 16 | 0 |
| B | 0 | 16 | 0 |
| C | 0 | 16 | 0 |
| D | 0 | 17 | 0 |
| Mode SS | |||
|---|---|---|---|
| Quadrant | BADHDUFLAG | Total packets | Discarded packets |
| A | 0 | 138 | 0 |
| B | 0 | 138 | 0 |
| C | 0 | 138 | 0 |
| D | 0 | 138 | 0 |
| Mode M0 | |||
|---|---|---|---|
| Quadrant | BADHDUFLAG | Total packets | Discarded packets |
| A | 0 | 14920 | 3 |
| B | 0 | 14440 | 2 |
| C | 0 | 14140 | 2 |
| D | 0 | 22803 | 2 |
| Quadrant | Total seconds | Saturated seconds | Saturation percentage |
|---|---|---|---|
| A | 6777 | 111 | 1.637893% |
| B | 6777 | 73 | 1.077173% |
| C | 6777 | 34 | 0.501697% |
| D | 6777 | 316 | 4.662830% |
Noise dominated data is calculated using 1-second bins in cleaned event files. If a bin has >2000 counts, and if more than 50% of those come from <1% of pixels, then it is considered to be noise-dominated and hence unusable.
| Quadrant | # 1 sec bins | Bins with >0 counts | Bins with >2000 counts | High rate bins dominated by noise | Noise dominated (total time) | Noise dominated (detector-on time) | Marked lightcurve |
|---|---|---|---|---|---|---|---|
| A | 7808 | 6779 | 2 | 2 | 0.03% | 0.03% | 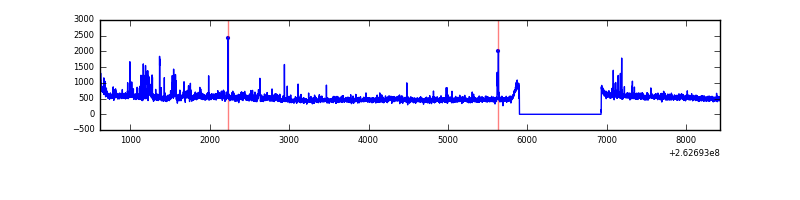 |
| B | 7808 | 6779 | 3 | 3 | 0.04% | 0.04% | 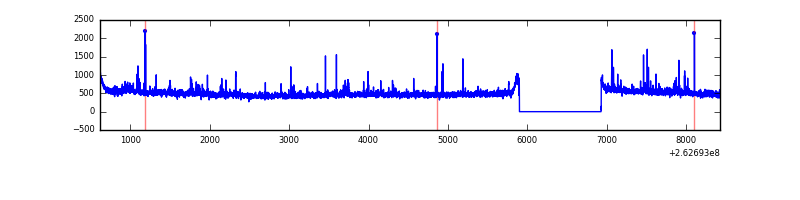 |
| C | 7808 | 6779 | 0 | 0 | 0.00% | 0.00% | 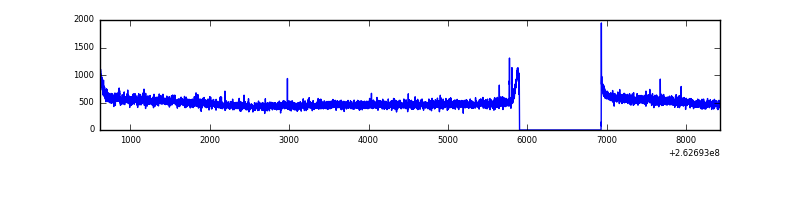 |
| D | 7808 | 6779 | 162 | 162 | 2.07% | 2.39% | 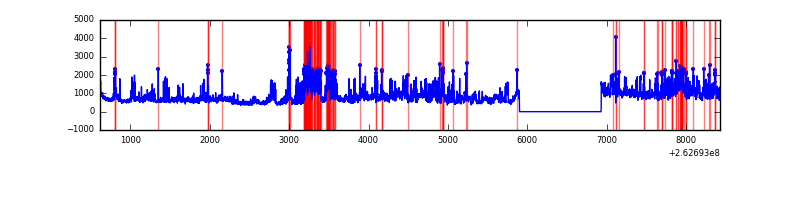 |
Top three noisy pixels from each quadrant. If the there are fewer than three noisy pixels in the level2.evt file, extra rows are filled as -1
| Pixel properties | Quadrant properties | ||||||
|---|---|---|---|---|---|---|---|
| Quadrant | DetID | PixID | Counts | Sigma | Mean | Median | Sigma |
| A | 8 | 15 | 187090 | 1098.89 | 838 | 820 | 169.5 |
| A | 14 | 111 | 127171 | 745.4 | 838 | 820 | 169.5 |
| A | 1 | 162 | 27395 | 156.78 | 838 | 820 | 169.5 |
| B | 0 | 189 | 32931 | 201.04 | 846 | 829 | 159.7 |
| B | 0 | 214 | 28393 | 172.62 | 846 | 829 | 159.7 |
| B | 3 | 209 | 18955 | 113.52 | 846 | 829 | 159.7 |
| C | 3 | 233 | 188947 | 1001.96 | 812 | 816 | 187.8 |
| C | 13 | 61 | 5802 | 26.55 | 812 | 816 | 187.8 |
| C | 14 | 234 | 4515 | 19.7 | 812 | 816 | 187.8 |
| D | 13 | 122 | 2043316 | 10736.47 | 798 | 781 | 190.2 |
| D | 10 | 157 | 496177 | 2604.02 | 798 | 781 | 190.2 |
| D | 1 | 52 | 113121 | 590.51 | 798 | 781 | 190.2 |
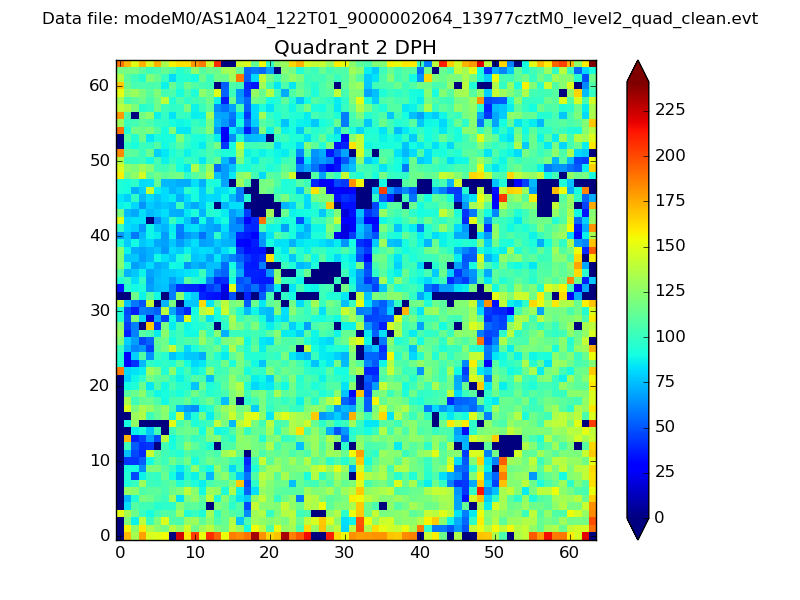
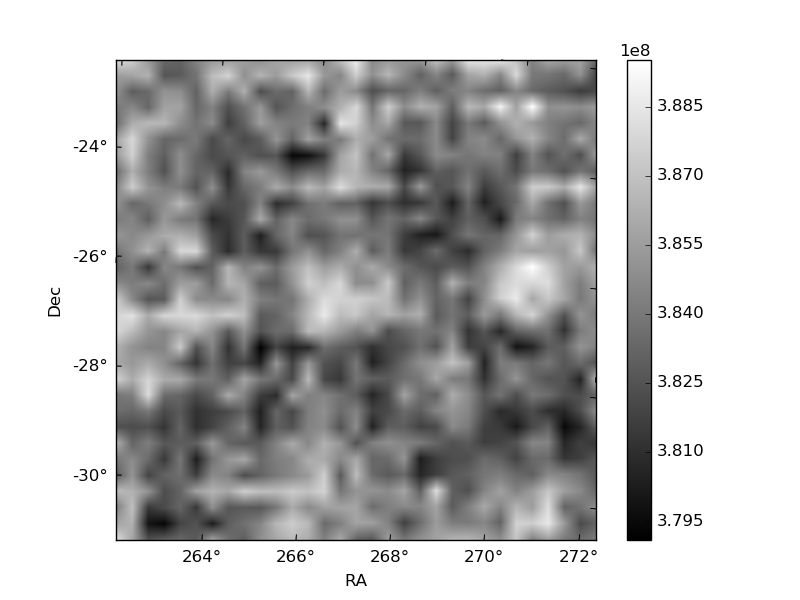
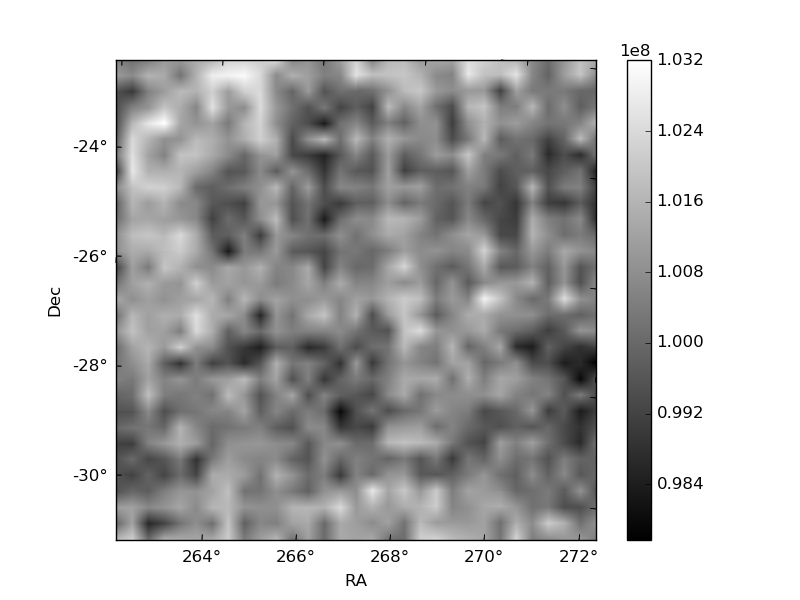
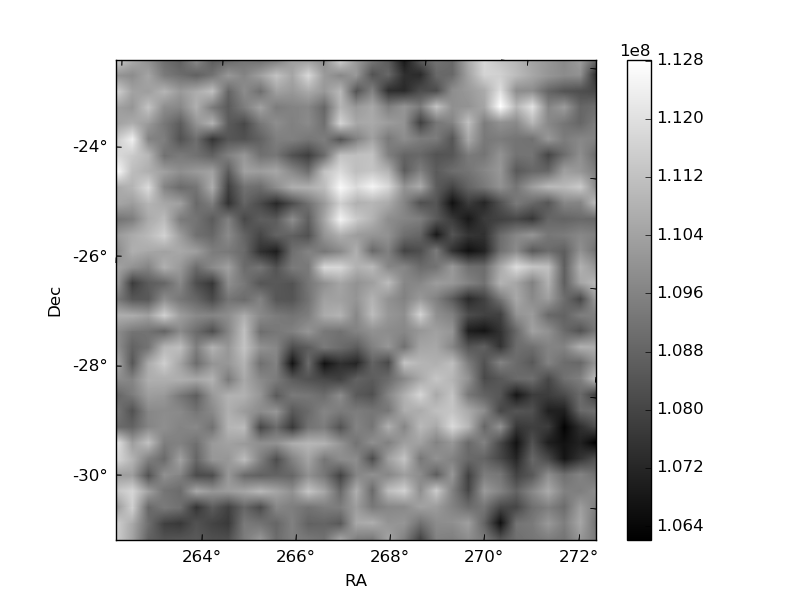
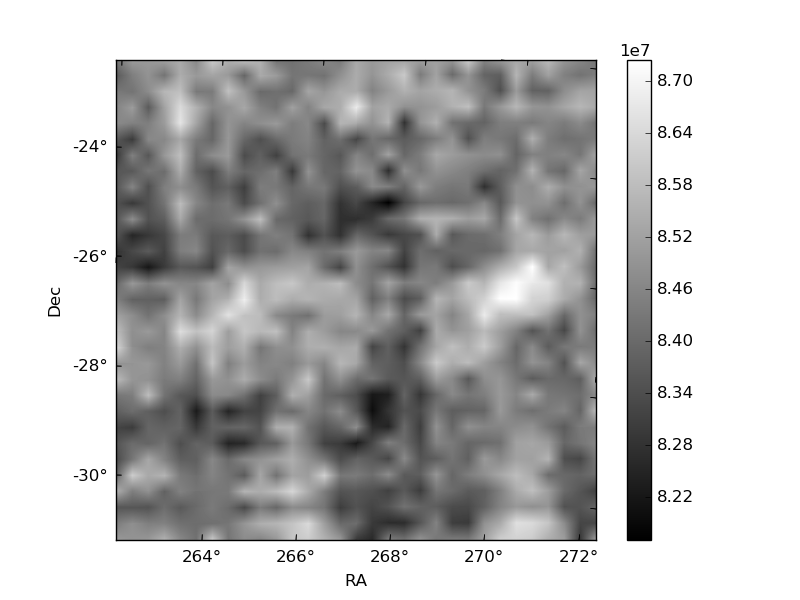
Histogram calculated using DETX and DETY for each event in the final _common_clean file
| Quadrant A | 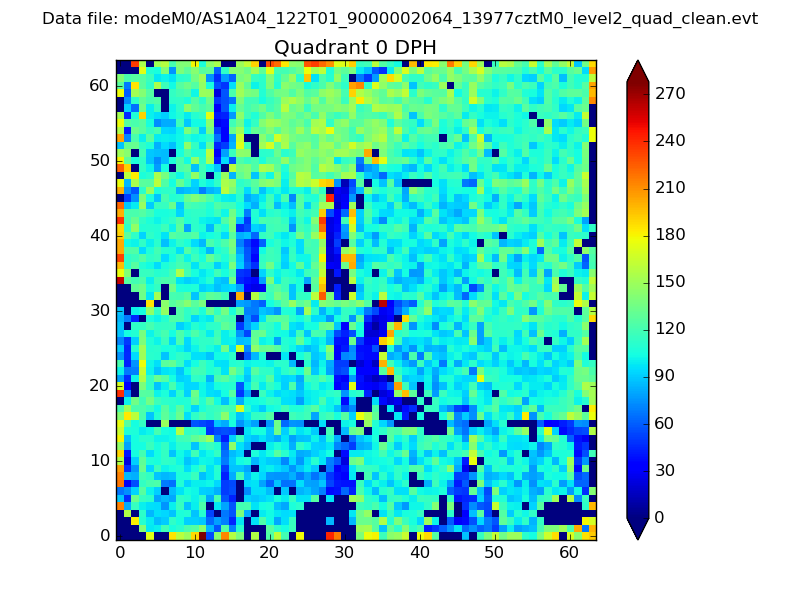 |
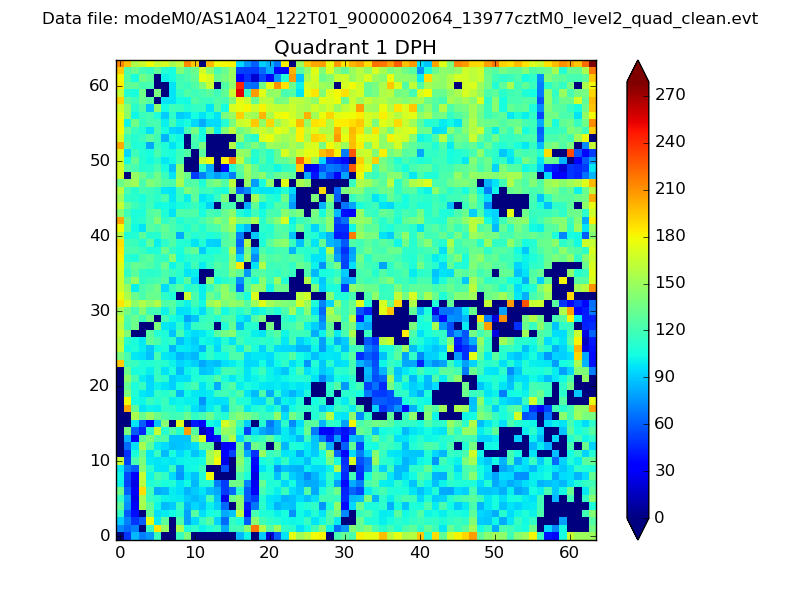 |
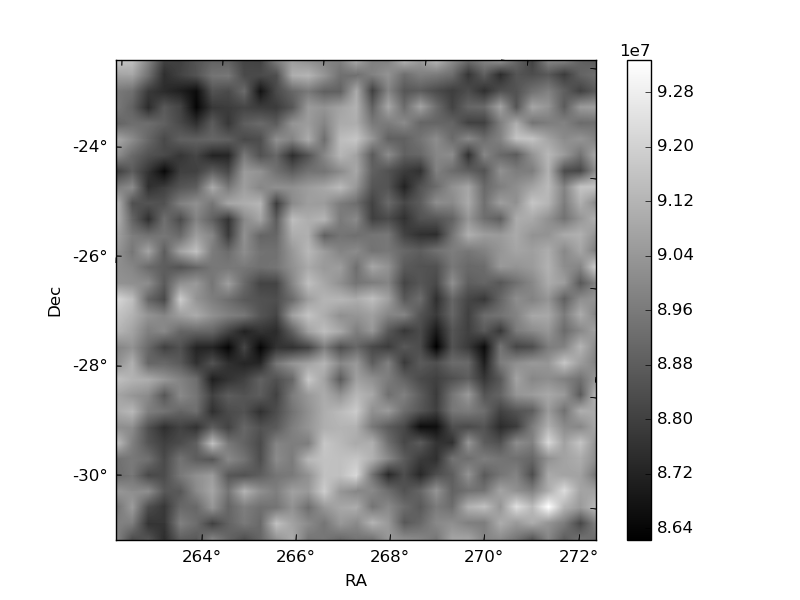
Quadrant B |
|---|---|---|---|
| Quadrant D | 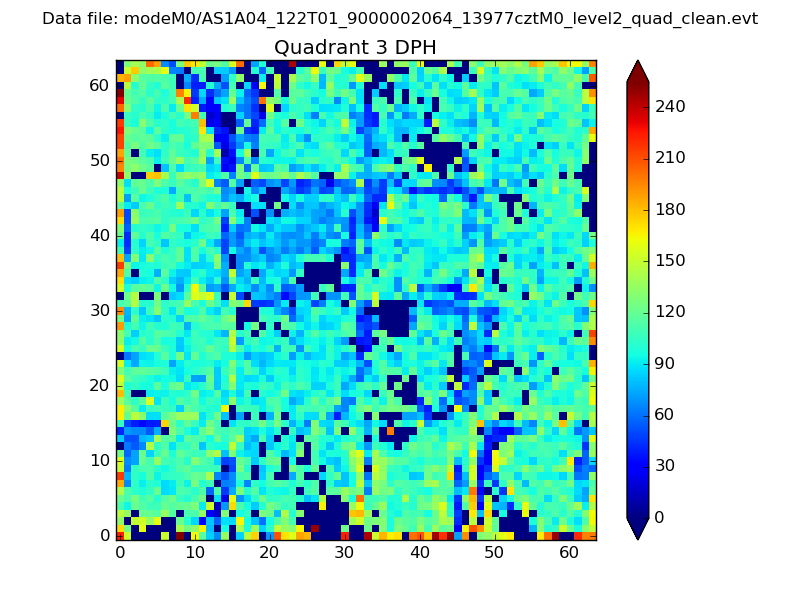 |
 |
Quadrant C |
| Plot type | Count rate plots | Images |
|---|---|---|
| Comparison with Poisson distribution Blue bars denote a histogram of data divided into 1 sec bins. Red curve is a Poisson curve with rate = median count rate of data. |
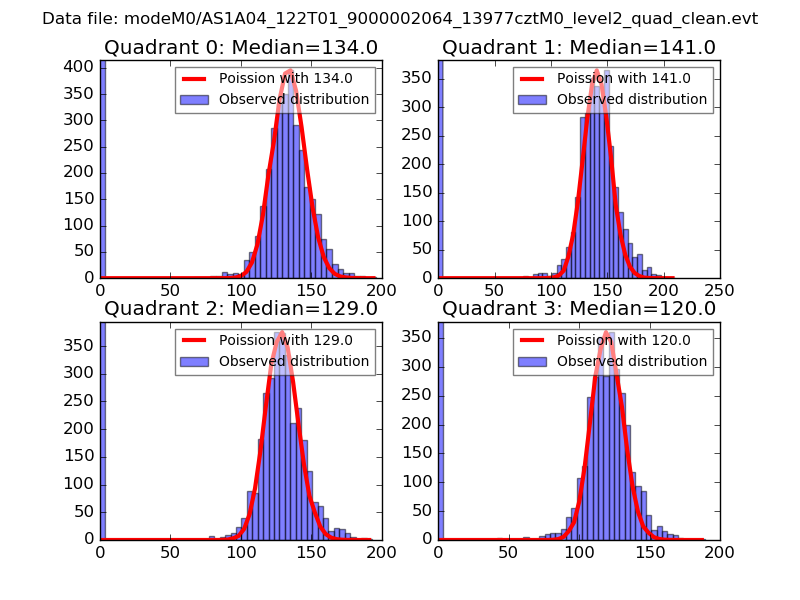 |
 |
| Quadrant-wise count rates Data is divided into 100 sec bins |
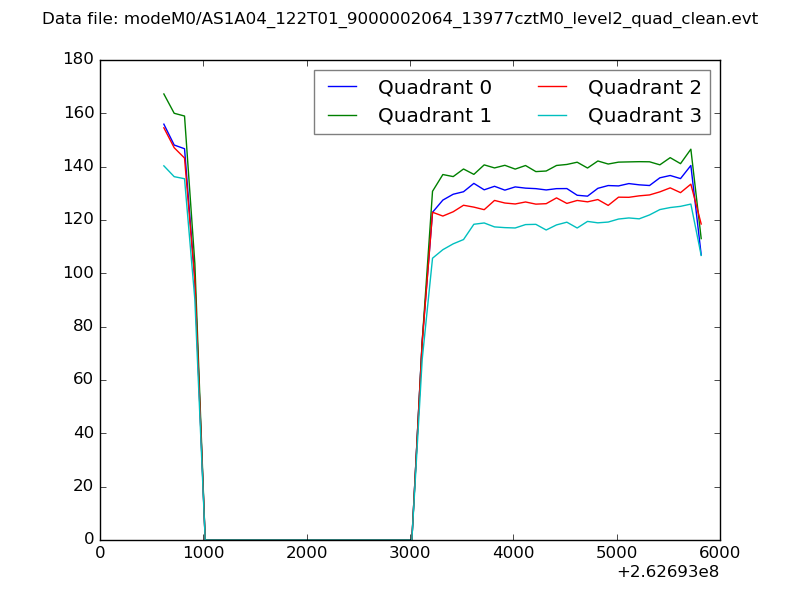 |
|
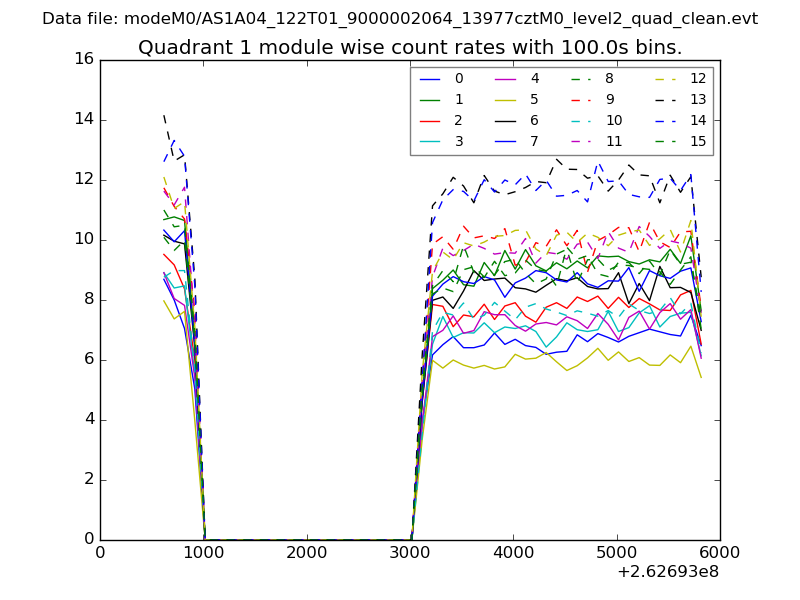
| Module-wise count rates for Quadrant A Data is divided into 100 sec bins |
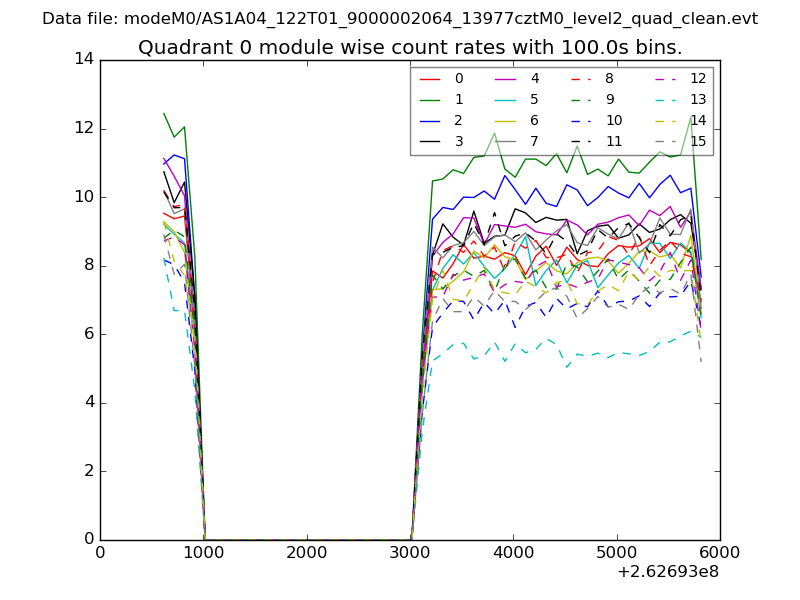 |
 |
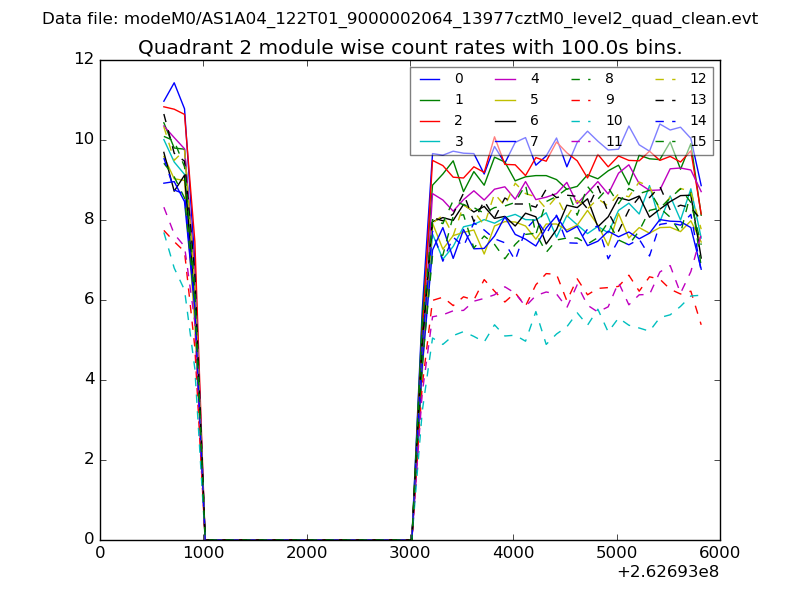
| Module-wise count rates for Quadrant B Data is divided into 100 sec bins |
 |
 |
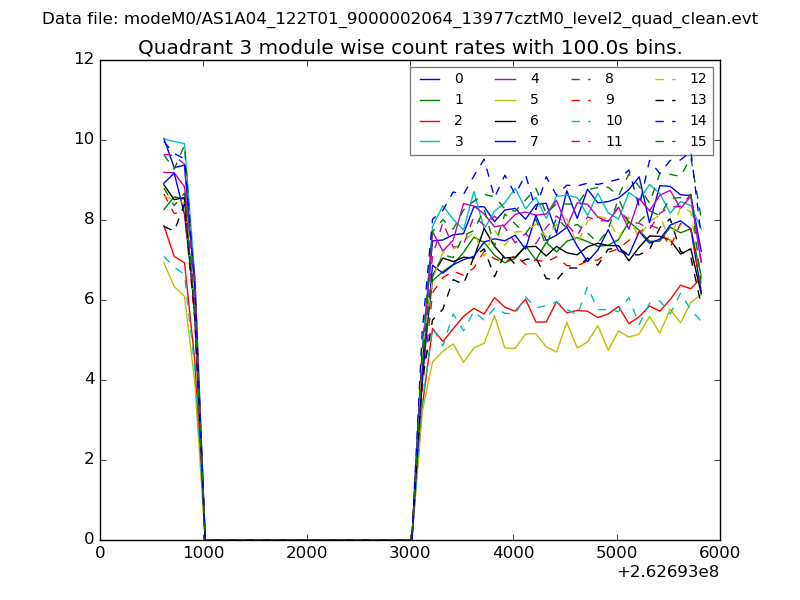
| Module-wise count rates for Quadrant C Data is divided into 100 sec bins |
 |
 |
| Module-wise count rates for Quadrant D Data is divided into 100 sec bins |
 |
 |
| Parameter | Plot |
|---|---|
| CZT HV Monitor | 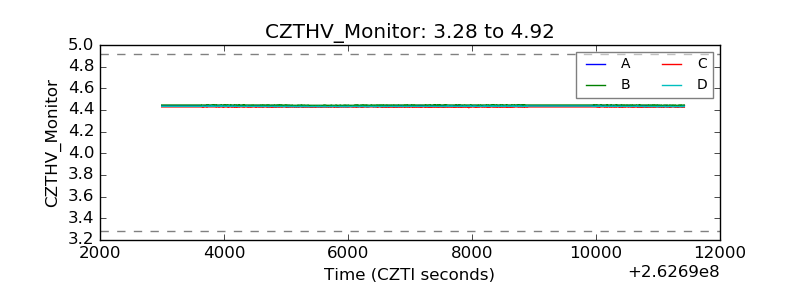 |
| D_VDD | 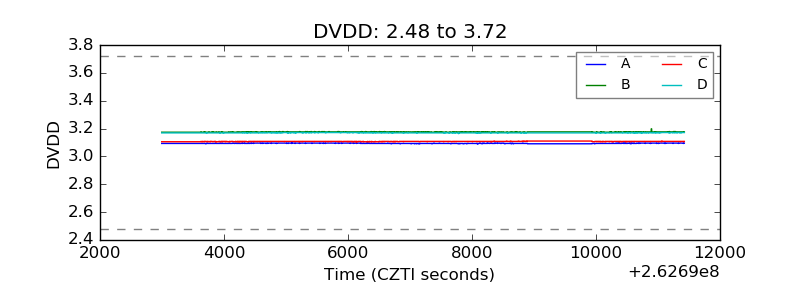 |
| Temperature 1 | 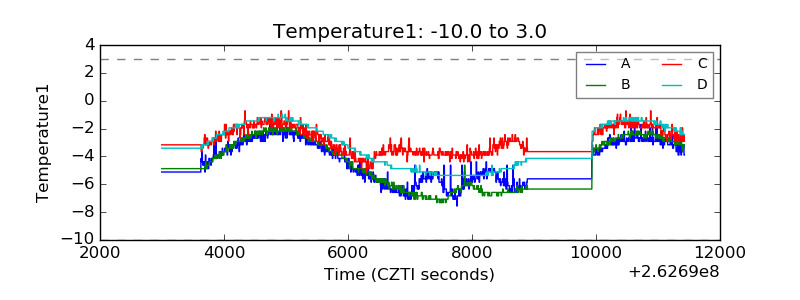 |
| Veto HV Monitor | 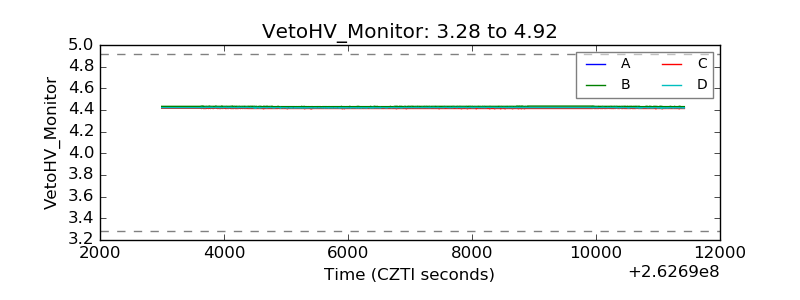 |
| Veto LLD |  |
| Alpha Counter | 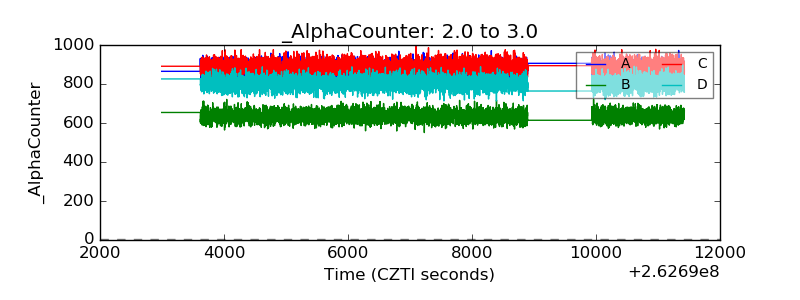 |
| _CPM_Rate | 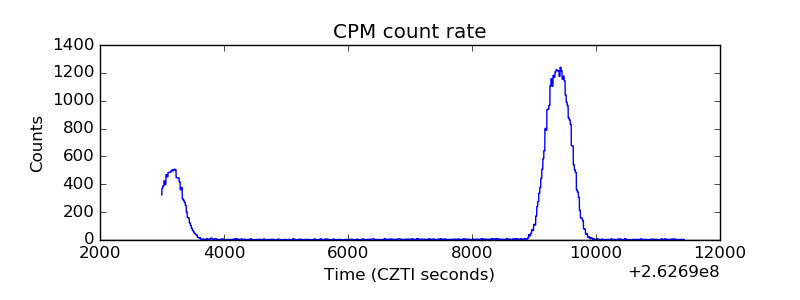 |
| CZT Counter | 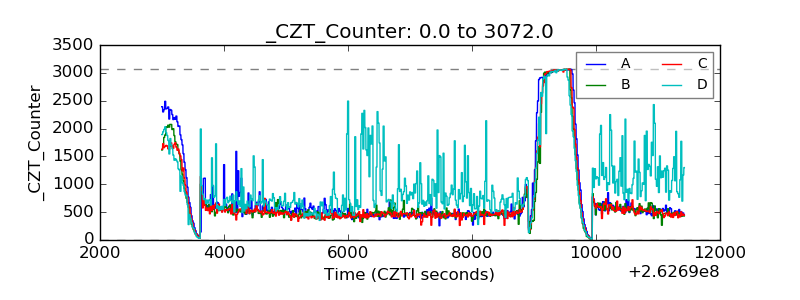 |
| +2.5 Volts monitor |  |
| +5 Volts monitor |  |
| _ROLL_ROT | 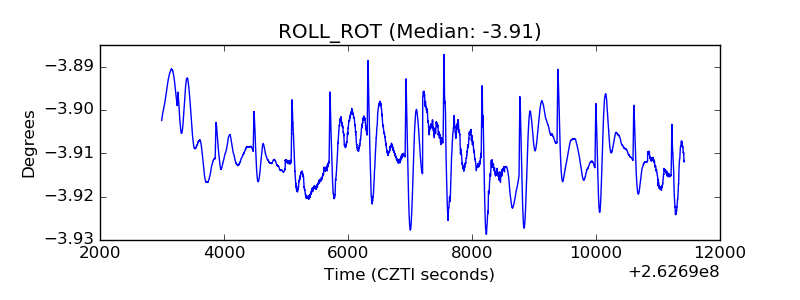 |
| _Roll_DEC | 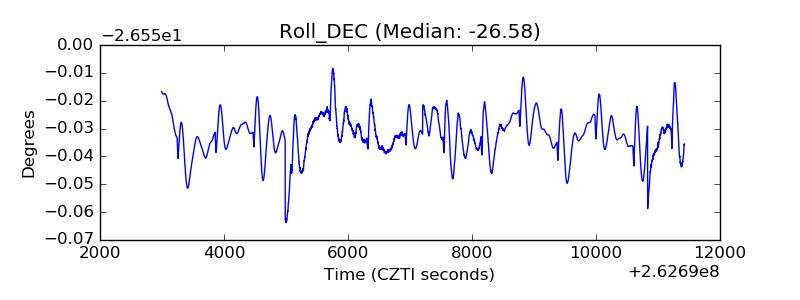 |
| _Roll_RA | 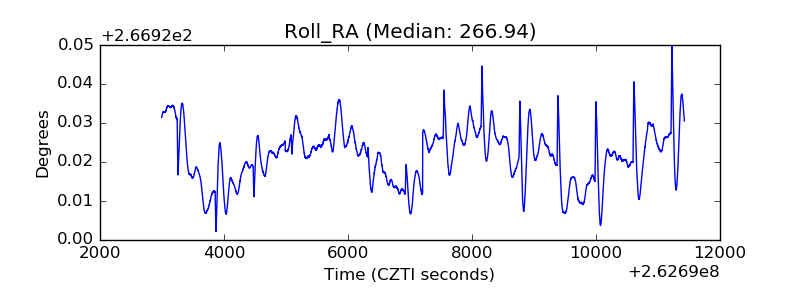 |
| Veto Counter | 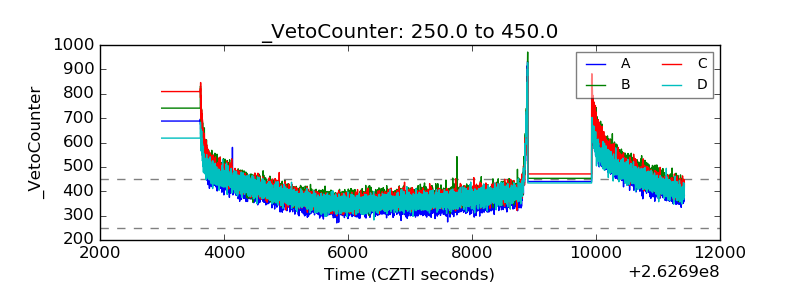 |