| Param | Original file | Final file |
|---|---|---|
| Filename | modeM0/AS1A04_122T01_9000002064_13980cztM0_level2.evt | modeM0/AS1A04_122T01_9000002064_13980cztM0_level2_quad_clean.evt |
| Size (bytes) | 513,123,840 | 76,014,720 |
| Size | 489.4 MB | 72.5 MB |
| Events in quadrant A | 3,311,707 | 473,724 |
| Events in quadrant B | 3,408,797 | 502,826 |
| Events in quadrant C | 3,364,674 | 456,021 |
| Events in quadrant D | 5,031,121 | 432,706 |
| Mode M9 | |||
|---|---|---|---|
| Quadrant | BADHDUFLAG | Total packets | Discarded packets |
| A | 0 | 22 | 0 |
| B | 0 | 22 | 0 |
| C | 0 | 22 | 0 |
| D | 0 | 23 | 0 |
| Mode SS | |||
|---|---|---|---|
| Quadrant | BADHDUFLAG | Total packets | Discarded packets |
| A | 0 | 128 | 0 |
| B | 0 | 128 | 0 |
| C | 0 | 128 | 0 |
| D | 0 | 128 | 0 |
| Mode M0 | |||
|---|---|---|---|
| Quadrant | BADHDUFLAG | Total packets | Discarded packets |
| A | 0 | 13909 | 3 |
| B | 0 | 14080 | 2 |
| C | 0 | 13877 | 2 |
| D | 0 | 19280 | 2 |
| Quadrant | Total seconds | Saturated seconds | Saturation percentage |
|---|---|---|---|
| A | 6248 | 86 | 1.376440% |
| B | 6248 | 89 | 1.424456% |
| C | 6248 | 46 | 0.736236% |
| D | 6248 | 140 | 2.240717% |
Noise dominated data is calculated using 1-second bins in cleaned event files. If a bin has >2000 counts, and if more than 50% of those come from <1% of pixels, then it is considered to be noise-dominated and hence unusable.
| Quadrant | # 1 sec bins | Bins with >0 counts | Bins with >2000 counts | High rate bins dominated by noise | Noise dominated (total time) | Noise dominated (detector-on time) | Marked lightcurve |
|---|---|---|---|---|---|---|---|
| A | 7504 | 6250 | 0 | 0 | 0.00% | 0.00% | 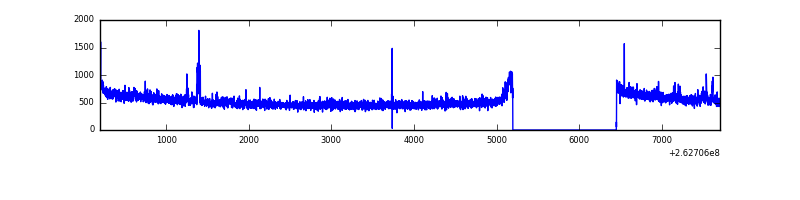 |
| B | 7504 | 6250 | 9 | 9 | 0.12% | 0.14% | 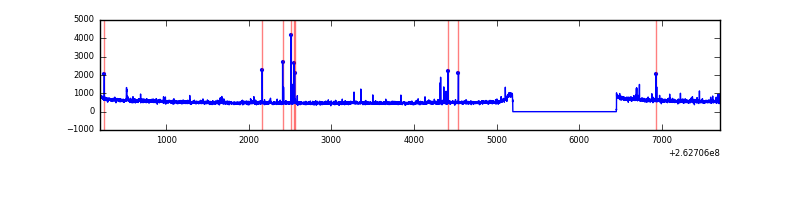 |
| C | 7504 | 6250 | 0 | 0 | 0.00% | 0.00% | 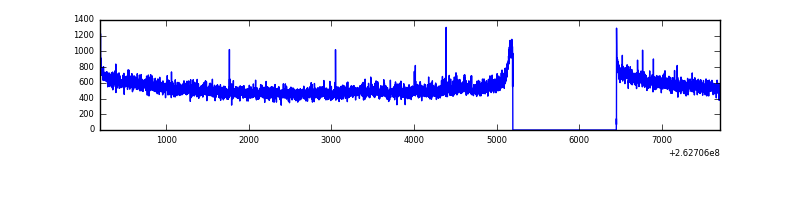 |
| D | 7504 | 6250 | 37 | 37 | 0.49% | 0.59% | 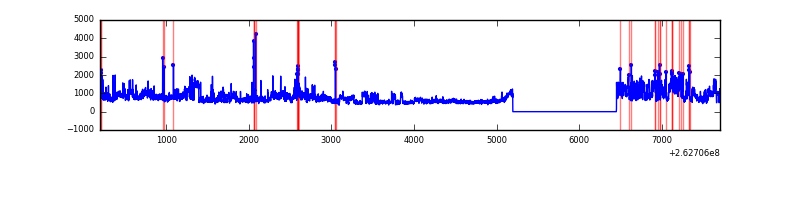 |
Top three noisy pixels from each quadrant. If the there are fewer than three noisy pixels in the level2.evt file, extra rows are filled as -1
| Pixel properties | Quadrant properties | ||||||
|---|---|---|---|---|---|---|---|
| Quadrant | DetID | PixID | Counts | Sigma | Mean | Median | Sigma |
| A | 14 | 111 | 34110 | 198.46 | 834 | 818 | 167.8 |
| A | 8 | 15 | 32181 | 186.96 | 834 | 818 | 167.8 |
| A | 1 | 162 | 16982 | 96.35 | 834 | 818 | 167.8 |
| B | 4 | 80 | 46224 | 290.2 | 843 | 830 | 156.4 |
| B | 0 | 189 | 33211 | 207.01 | 843 | 830 | 156.4 |
| B | 0 | 219 | 20336 | 124.7 | 843 | 830 | 156.4 |
| C | 3 | 233 | 242963 | 1322.32 | 801 | 806 | 183.1 |
| C | 13 | 61 | 5753 | 27.01 | 801 | 806 | 183.1 |
| C | 3 | 202 | 1938 | 6.18 | 801 | 806 | 183.1 |
| D | 10 | 157 | 931795 | 4971.39 | 788 | 770 | 187.3 |
| D | 13 | 122 | 688740 | 3673.55 | 788 | 770 | 187.3 |
| D | 1 | 52 | 146359 | 777.4 | 788 | 770 | 187.3 |
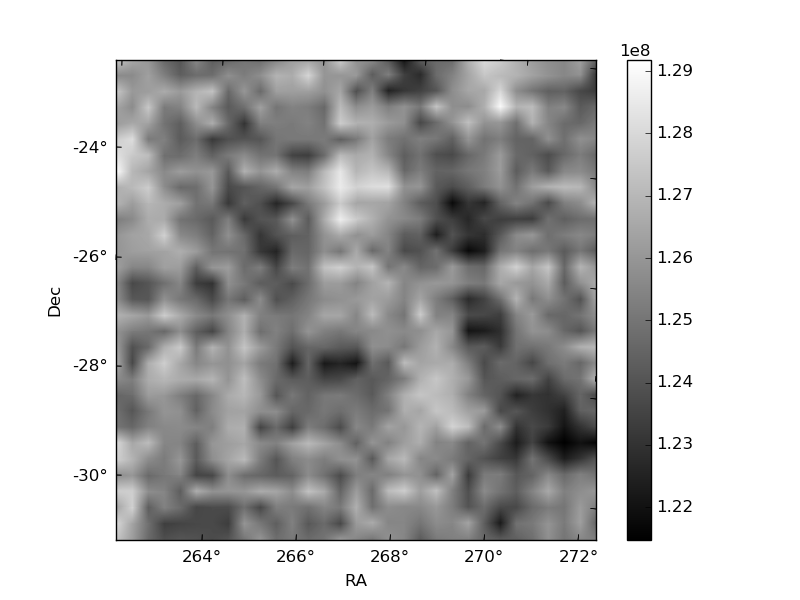
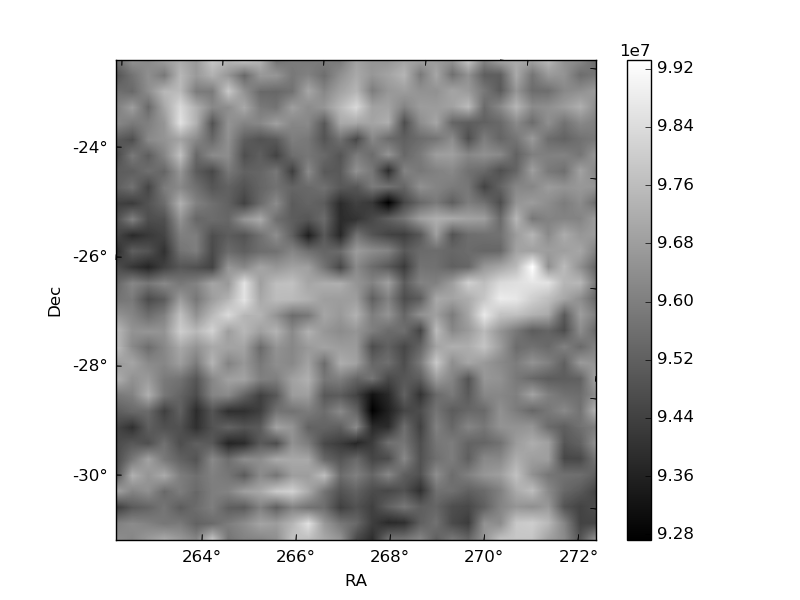
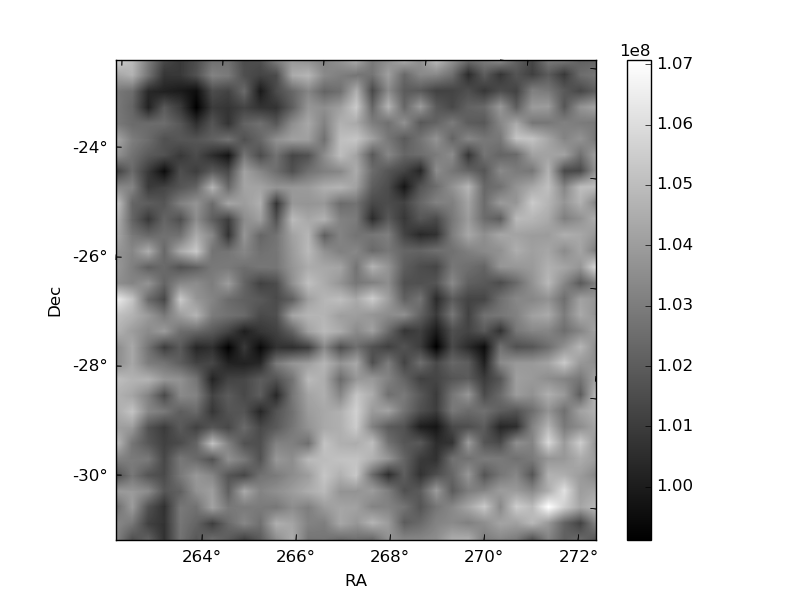
Histogram calculated using DETX and DETY for each event in the final _common_clean file
| Quadrant A | 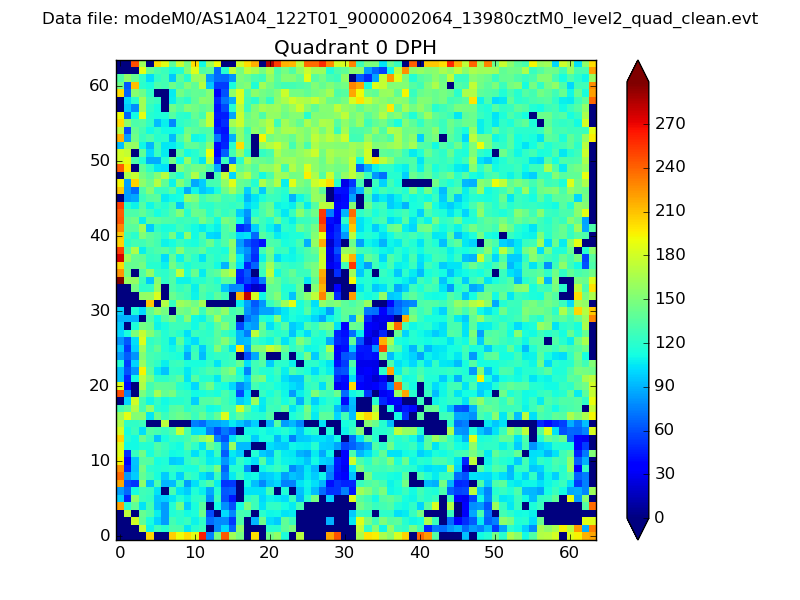 |
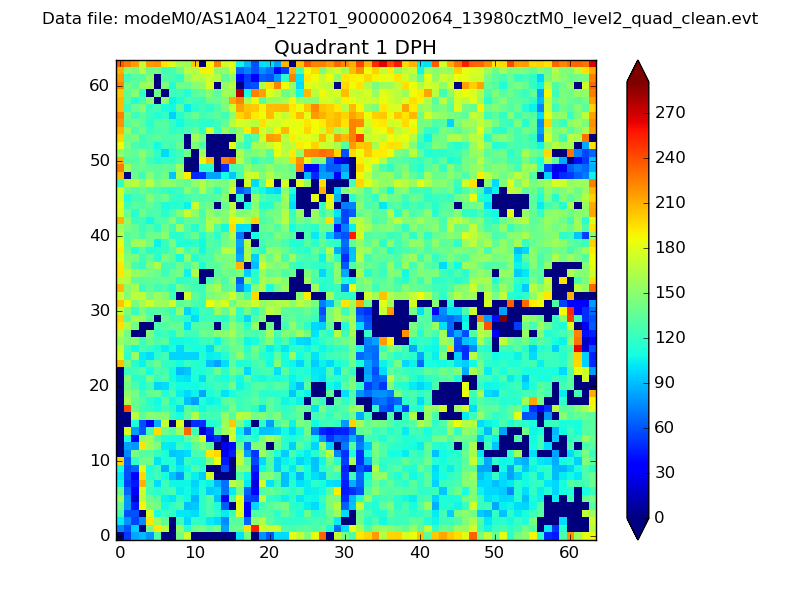 |
Quadrant B |
|---|---|---|---|
| Quadrant D | 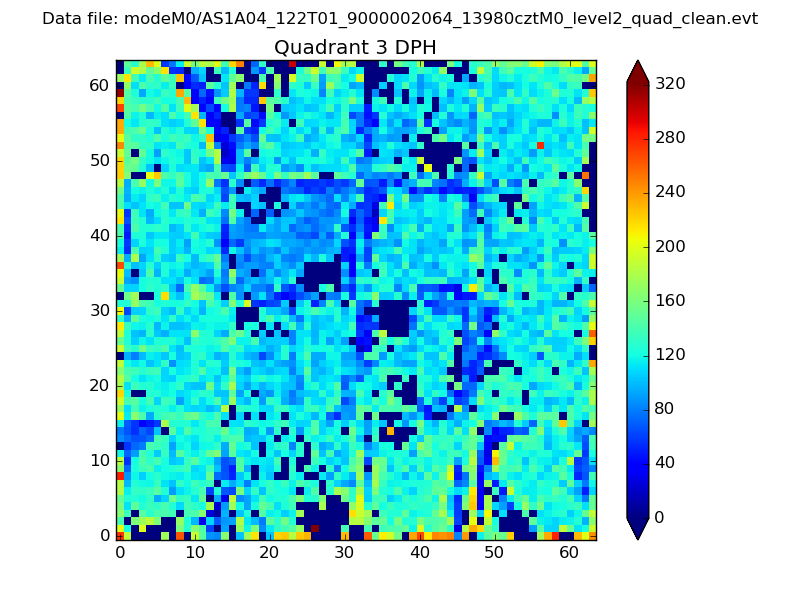 |
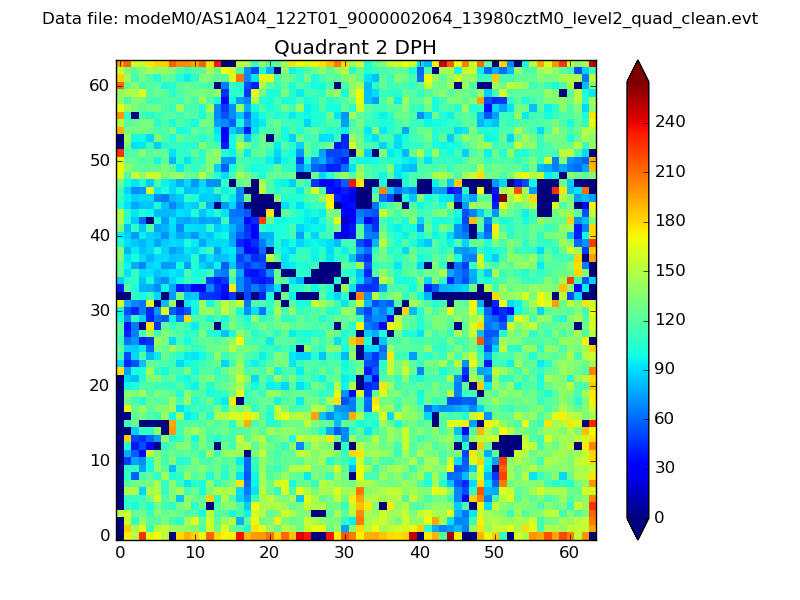 |
Quadrant C |
| Plot type | Count rate plots | Images |
|---|---|---|
| Comparison with Poisson distribution Blue bars denote a histogram of data divided into 1 sec bins. Red curve is a Poisson curve with rate = median count rate of data. |
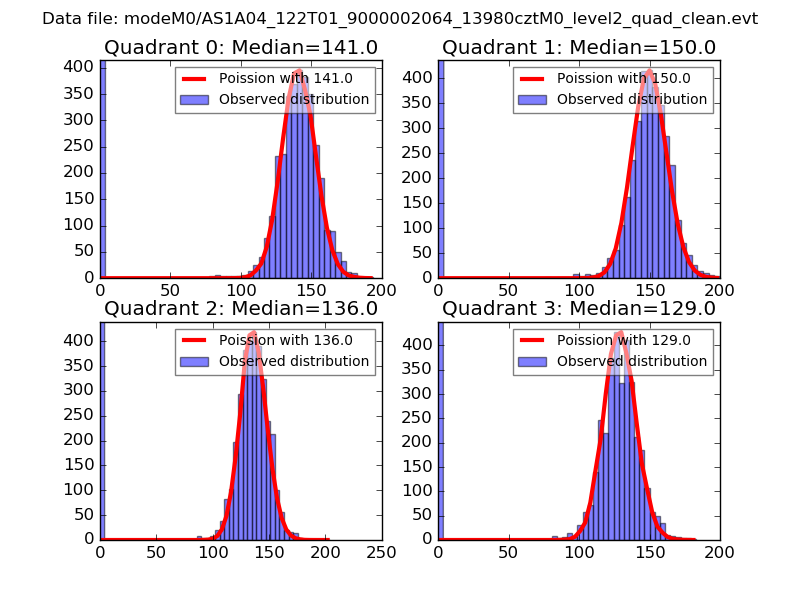 |
 |
| Quadrant-wise count rates Data is divided into 100 sec bins |
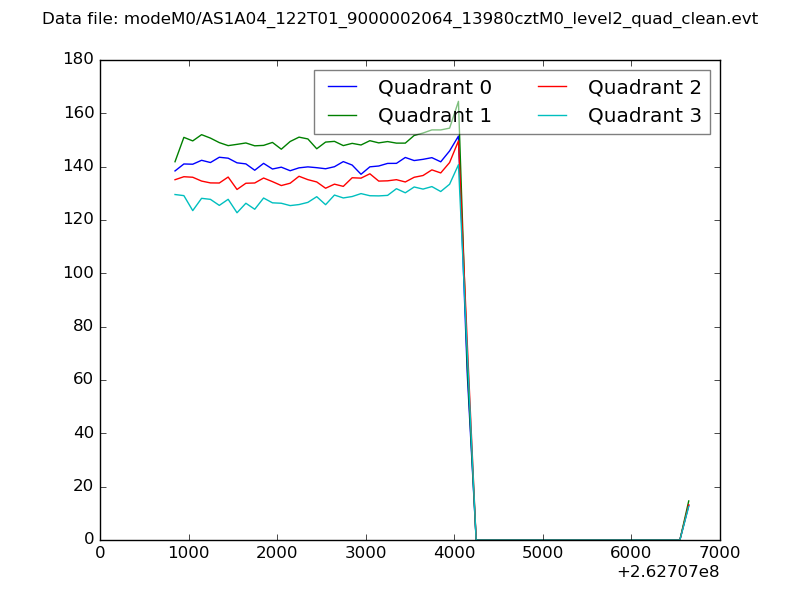 |
|
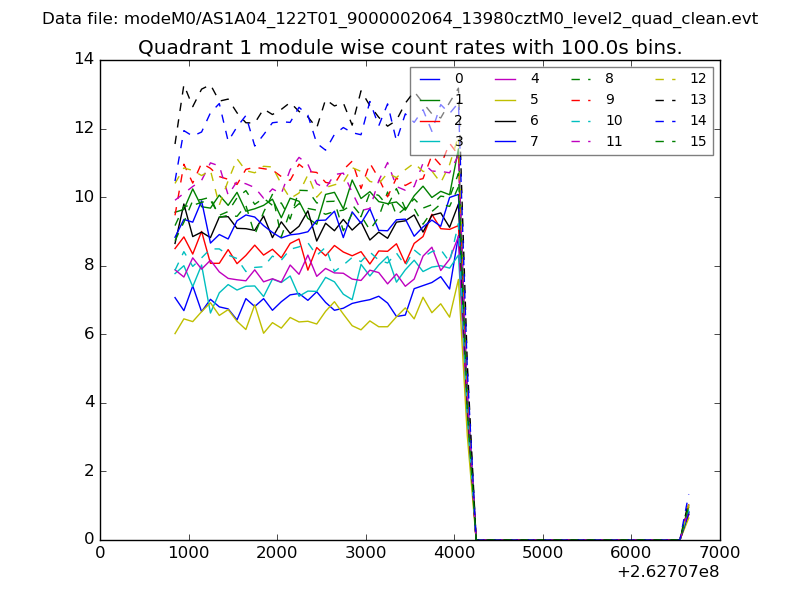
| Module-wise count rates for Quadrant A Data is divided into 100 sec bins |
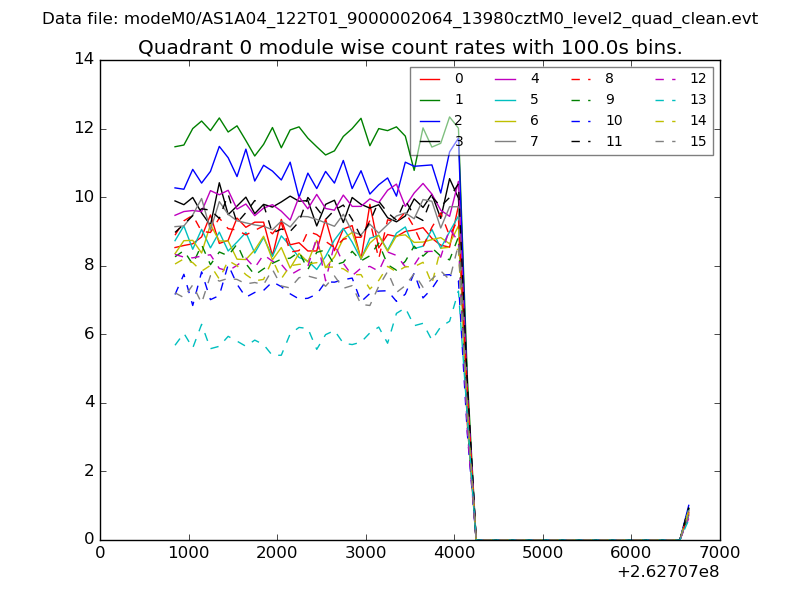 |
 |
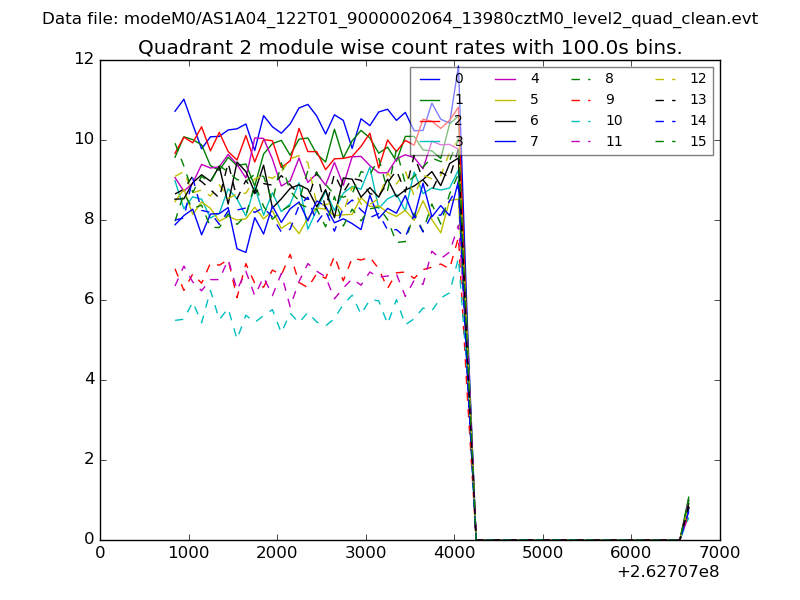
| Module-wise count rates for Quadrant B Data is divided into 100 sec bins |
 |
 |
| Module-wise count rates for Quadrant C Data is divided into 100 sec bins |
 |
 |
| Module-wise count rates for Quadrant D Data is divided into 100 sec bins |
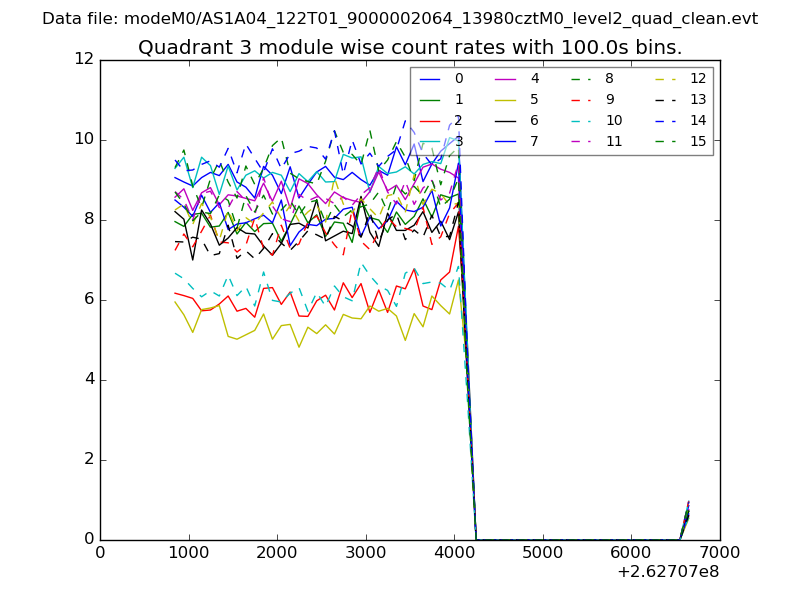 |
 |
| Parameter | Plot |
|---|---|
| CZT HV Monitor | 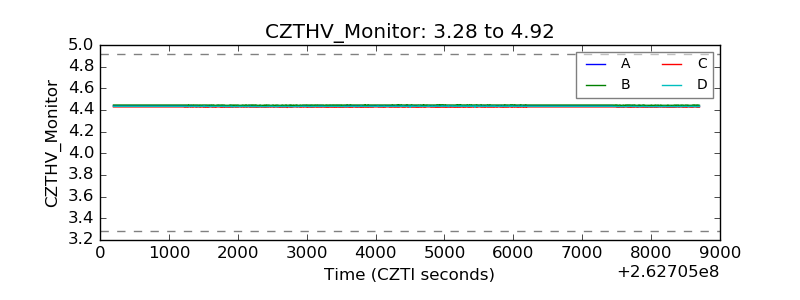 |
| D_VDD |  |
| Temperature 1 | 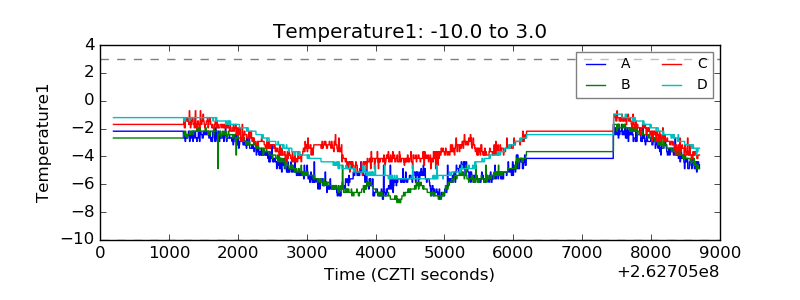 |
| Veto HV Monitor |  |
| Veto LLD | 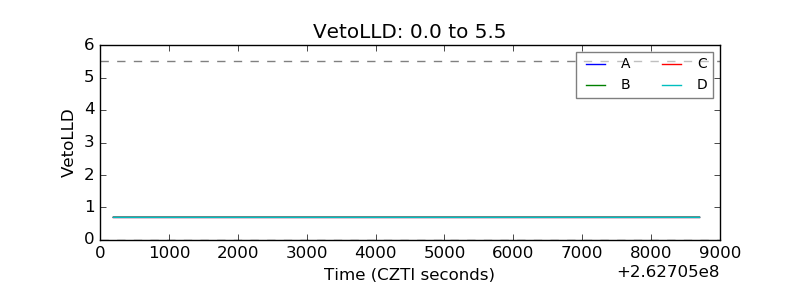 |
| Alpha Counter | 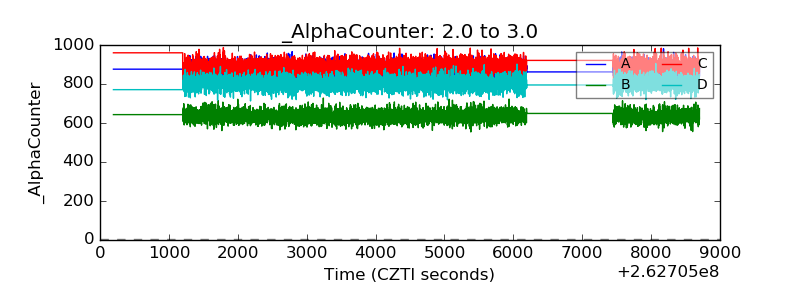 |
| _CPM_Rate | 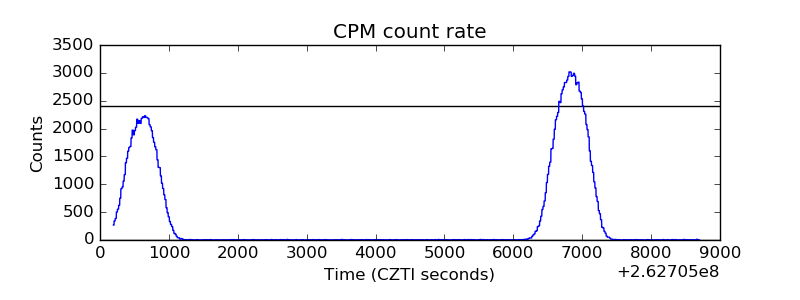 |
| CZT Counter | 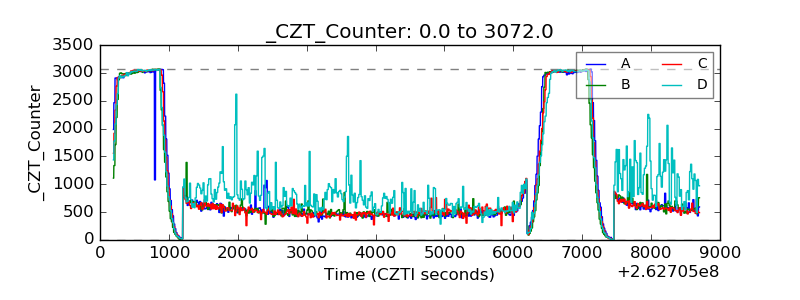 |
| +2.5 Volts monitor |  |
| +5 Volts monitor | 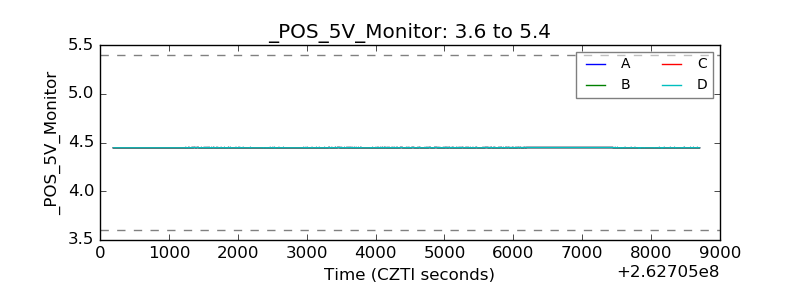 |
| _ROLL_ROT | 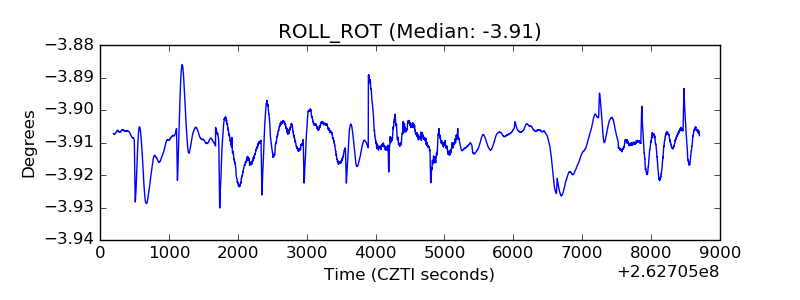 |
| _Roll_DEC | 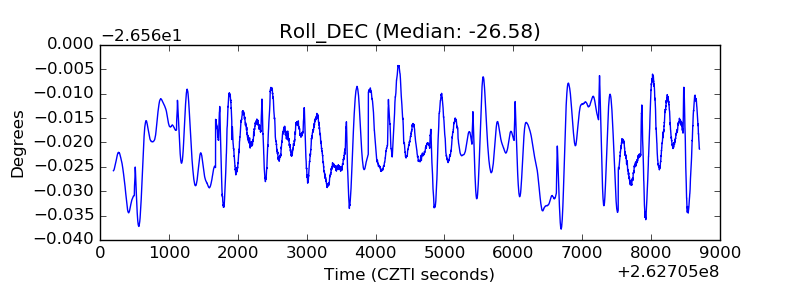 |
| _Roll_RA |  |
| Veto Counter | 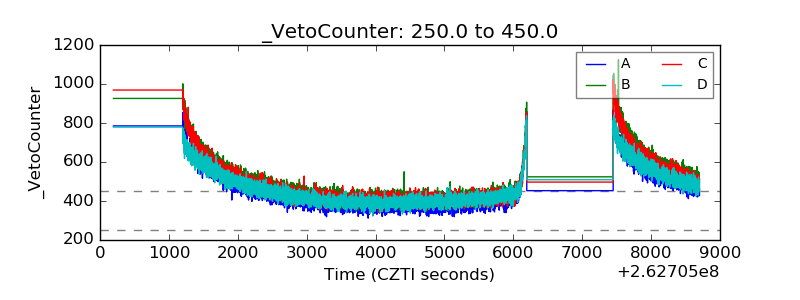 |