| Param | Original file | Final file |
|---|---|---|
| Filename | modeM0/AS1A04_122T01_9000002064_13981cztM0_level2.evt | modeM0/AS1A04_122T01_9000002064_13981cztM0_level2_quad_clean.evt |
| Size (bytes) | 203,359,680 | 38,260,800 |
| Size | 193.9 MB | 36.5 MB |
| Events in quadrant A | 1,351,243 | 266,694 |
| Events in quadrant B | 1,379,473 | 271,714 |
| Events in quadrant C | 1,336,692 | 255,178 |
| Events in quadrant D | 1,926,444 | 192,414 |
| Mode M9 | |||
|---|---|---|---|
| Quadrant | BADHDUFLAG | Total packets | Discarded packets |
| A | 0 | 23 | 11 |
| B | 0 | 24 | 8 |
| C | 0 | 24 | 9 |
| D | 0 | 25 | 7 |
| Mode SS | |||
|---|---|---|---|
| Quadrant | BADHDUFLAG | Total packets | Discarded packets |
| A | 0 | 125 | 61 |
| B | 0 | 122 | 66 |
| C | 0 | 126 | 70 |
| D | 0 | 125 | 75 |
| Mode M0 | |||
|---|---|---|---|
| Quadrant | BADHDUFLAG | Total packets | Discarded packets |
| A | 0 | 13618 | 8070 |
| B | 0 | 14271 | 8697 |
| C | 0 | 13557 | 8134 |
| D | 0 | 23650 | 16505 |
| Quadrant | Total seconds | Saturated seconds | Saturation percentage |
|---|---|---|---|
| A | 2526 | 20 | 0.791766% |
| B | 2415 | 16 | 0.662526% |
| C | 2500 | 7 | 0.280000% |
| D | 1995 | 94 | 4.711779% |
Noise dominated data is calculated using 1-second bins in cleaned event files. If a bin has >2000 counts, and if more than 50% of those come from <1% of pixels, then it is considered to be noise-dominated and hence unusable.
| Quadrant | # 1 sec bins | Bins with >0 counts | Bins with >2000 counts | High rate bins dominated by noise | Noise dominated (total time) | Noise dominated (detector-on time) | Marked lightcurve |
|---|---|---|---|---|---|---|---|
| A | 7309 | 3188 | 0 | 0 | 0.00% | 0.00% | 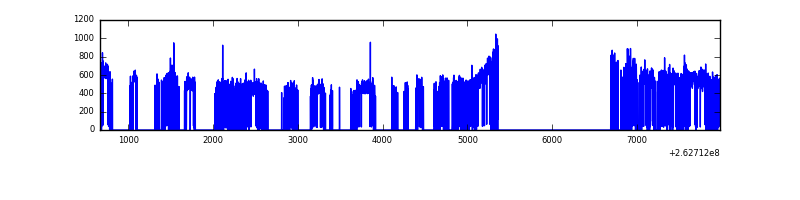 |
| B | 7307 | 3039 | 1 | 1 | 0.01% | 0.03% | 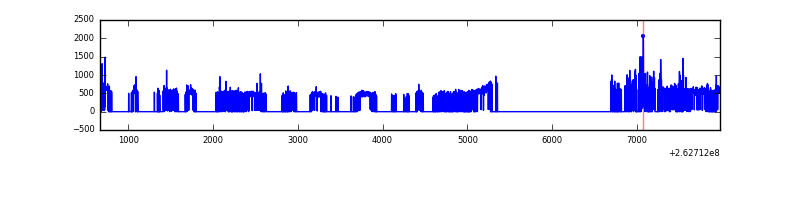 |
| C | 7309 | 3136 | 0 | 0 | 0.00% | 0.00% | 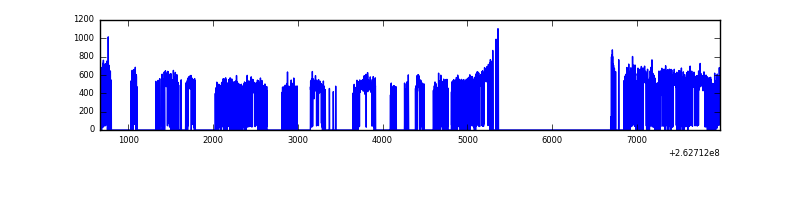 |
| D | 7304 | 2605 | 51 | 51 | 0.70% | 1.96% | 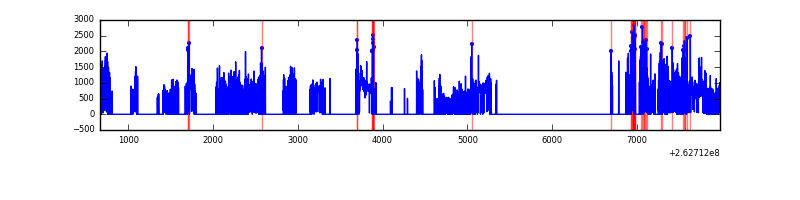 |
Top three noisy pixels from each quadrant. If the there are fewer than three noisy pixels in the level2.evt file, extra rows are filled as -1
| Pixel properties | Quadrant properties | ||||||
|---|---|---|---|---|---|---|---|
| Quadrant | DetID | PixID | Counts | Sigma | Mean | Median | Sigma |
| A | 8 | 15 | 19146 | 267.18 | 342 | 335 | 70.4 |
| A | 1 | 162 | 6715 | 90.62 | 342 | 335 | 70.4 |
| A | 12 | 189 | 5960 | 79.9 | 342 | 335 | 70.4 |
| B | 4 | 142 | 21363 | 335.16 | 330 | 324 | 62.8 |
| B | 3 | 64 | 19098 | 299.08 | 330 | 324 | 62.8 |
| B | 0 | 189 | 17189 | 268.67 | 330 | 324 | 62.8 |
| C | 3 | 233 | 79219 | 1048.23 | 322 | 324 | 75.3 |
| C | 13 | 61 | 2381 | 27.33 | 322 | 324 | 75.3 |
| C | 0 | 207 | 1340 | 13.5 | 322 | 324 | 75.3 |
| D | 13 | 122 | 444665 | 6917.07 | 250 | 244 | 64.2 |
| D | 1 | 52 | 217506 | 3381.52 | 250 | 244 | 64.2 |
| D | 10 | 157 | 207016 | 3218.25 | 250 | 244 | 64.2 |
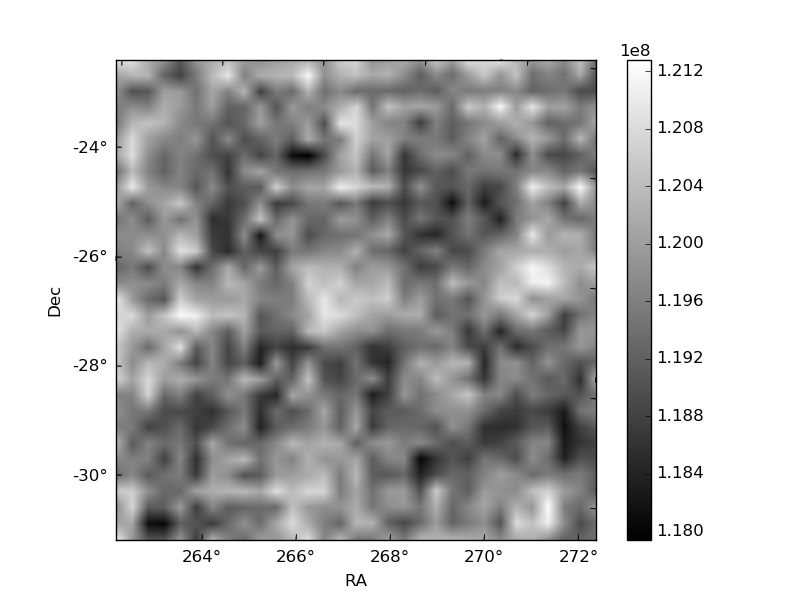
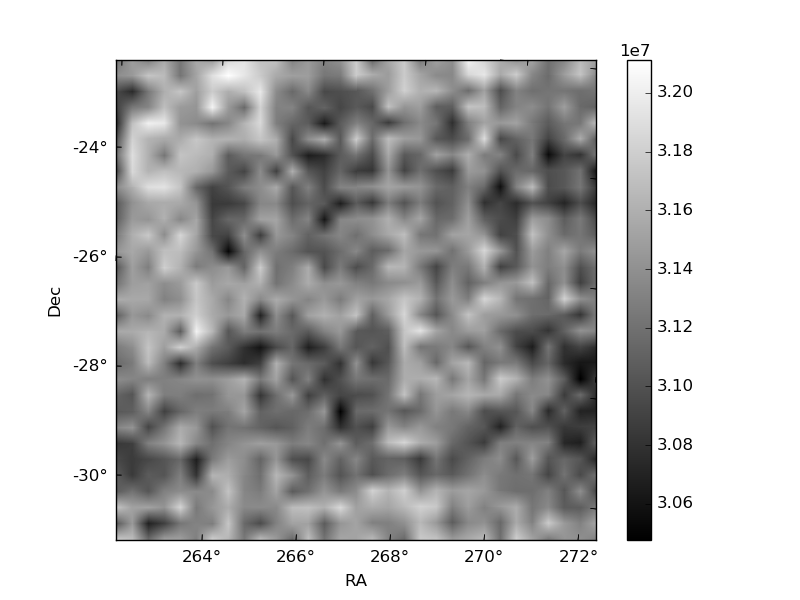
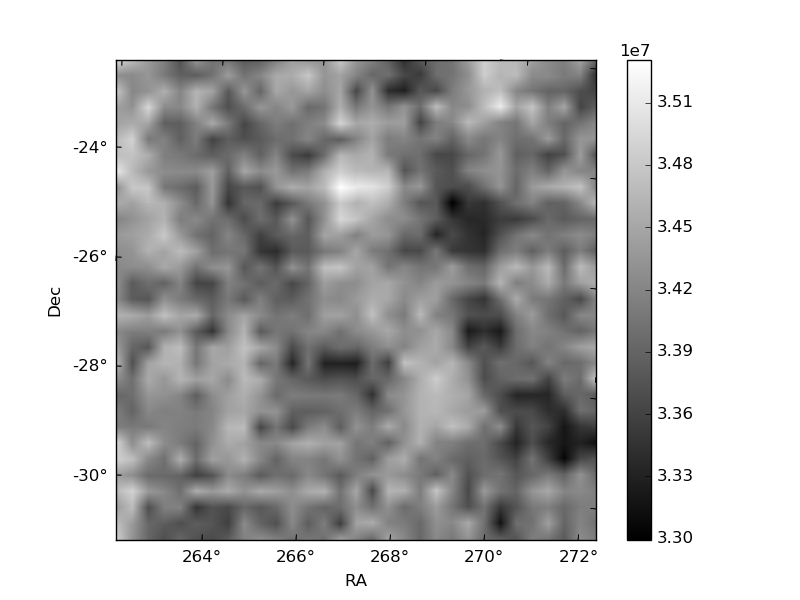
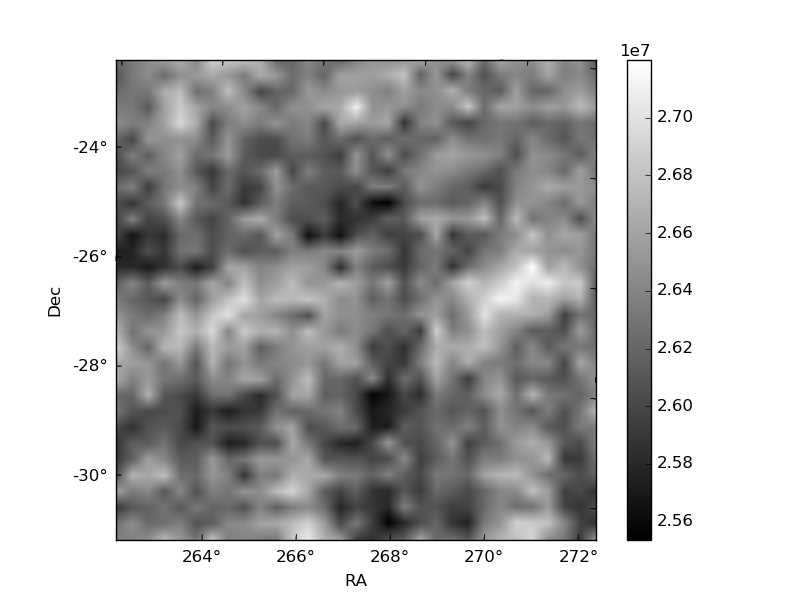
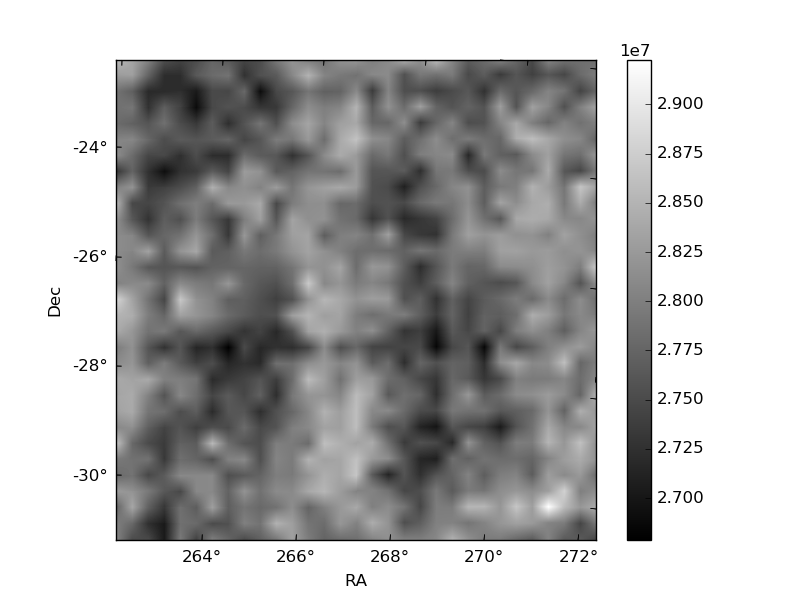
Histogram calculated using DETX and DETY for each event in the final _common_clean file
| Quadrant A | 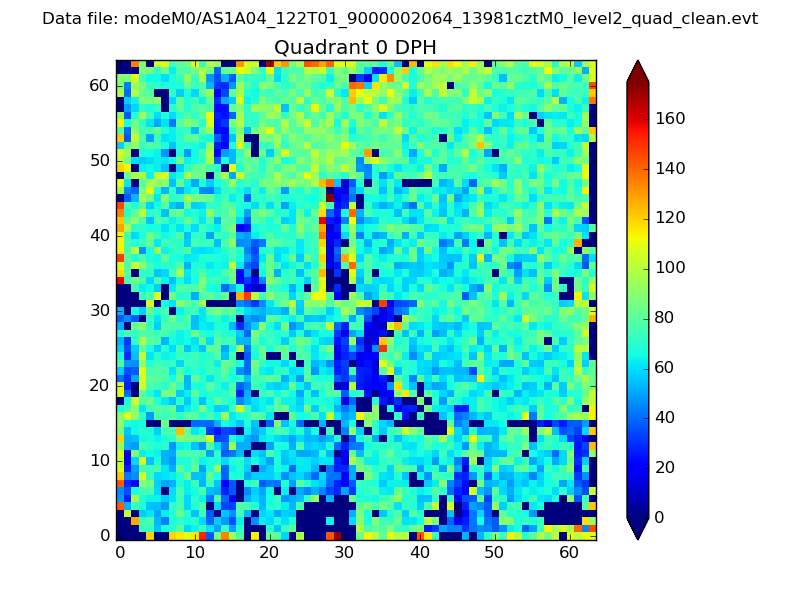 |
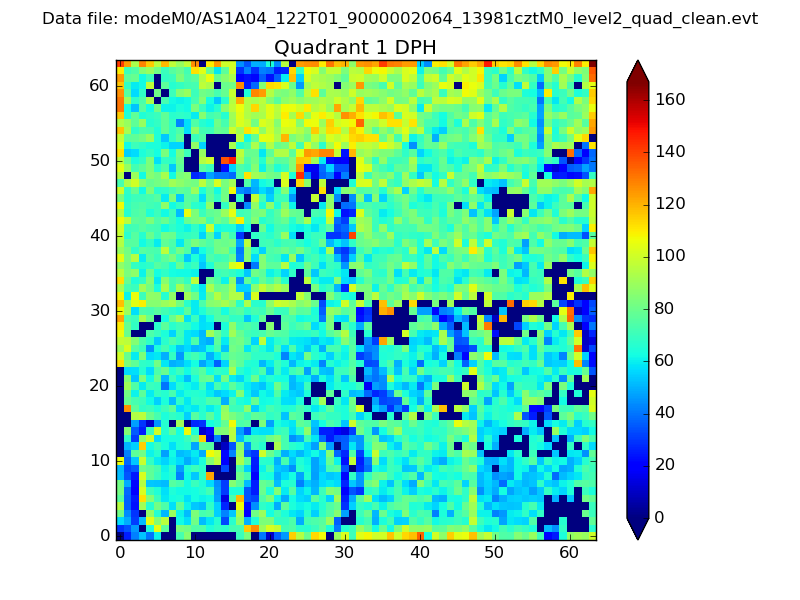 |
Quadrant B |
|---|---|---|---|
| Quadrant D | 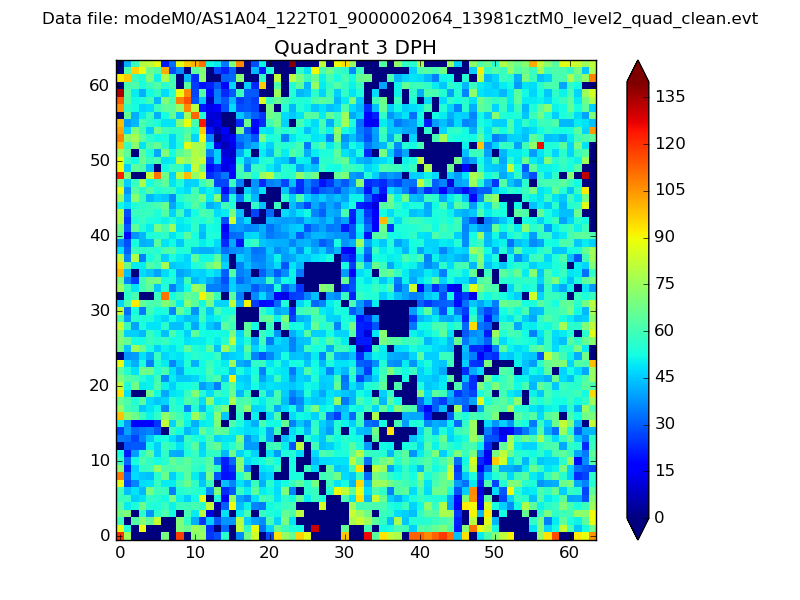 |
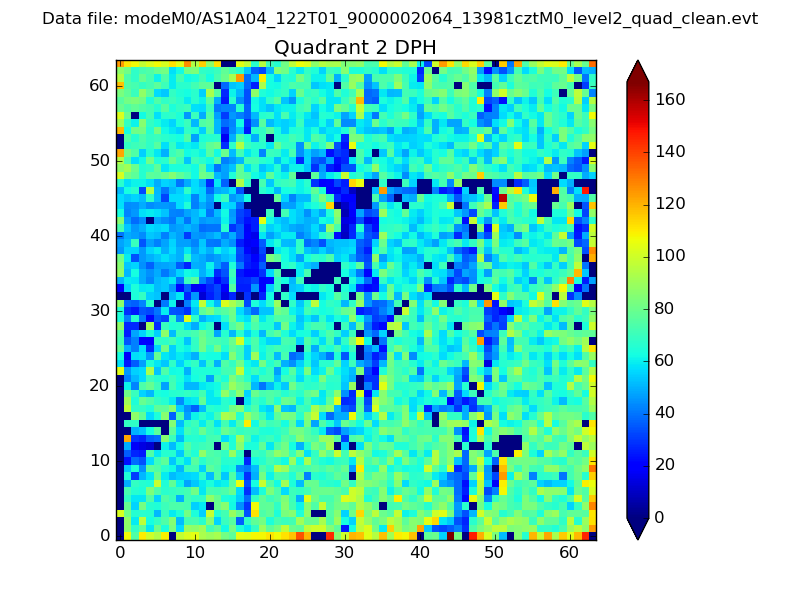 |
Quadrant C |
| Plot type | Count rate plots | Images |
|---|---|---|
| Comparison with Poisson distribution Blue bars denote a histogram of data divided into 1 sec bins. Red curve is a Poisson curve with rate = median count rate of data. |
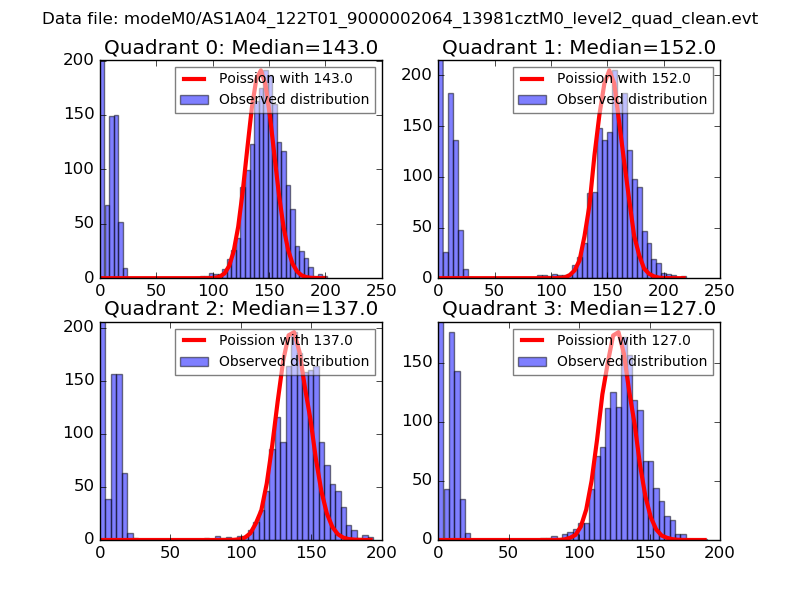 |
 |
| Quadrant-wise count rates Data is divided into 100 sec bins |
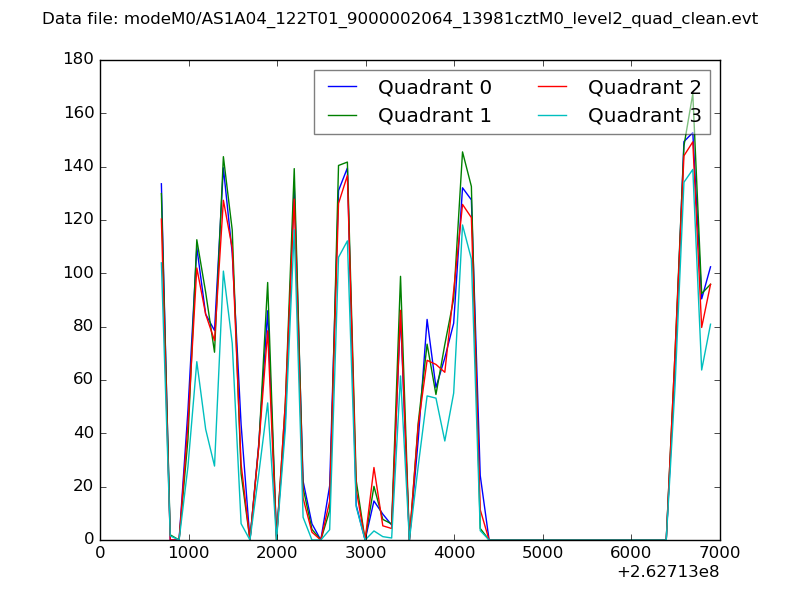 |
|
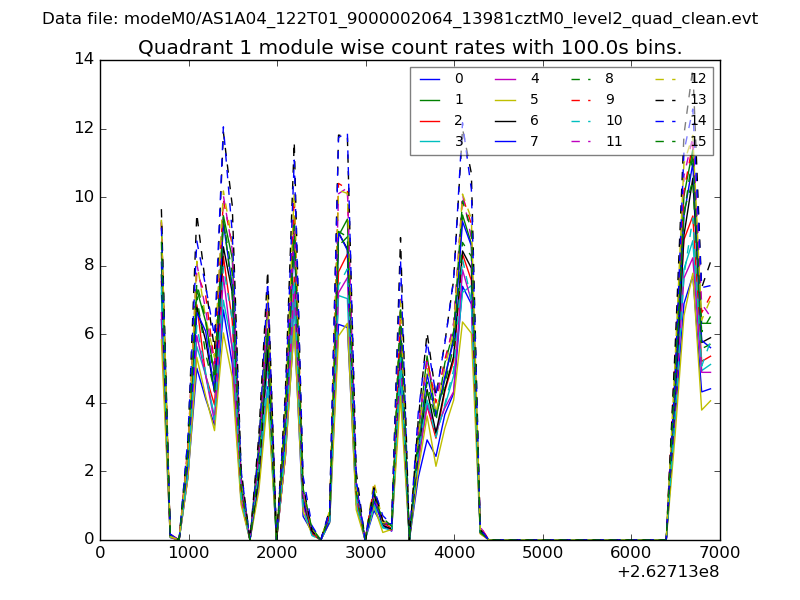
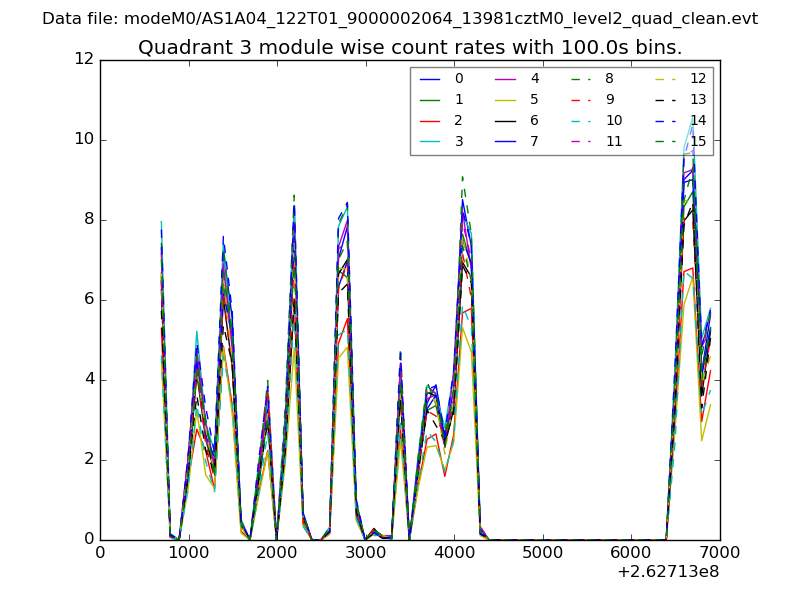
| Module-wise count rates for Quadrant A Data is divided into 100 sec bins |
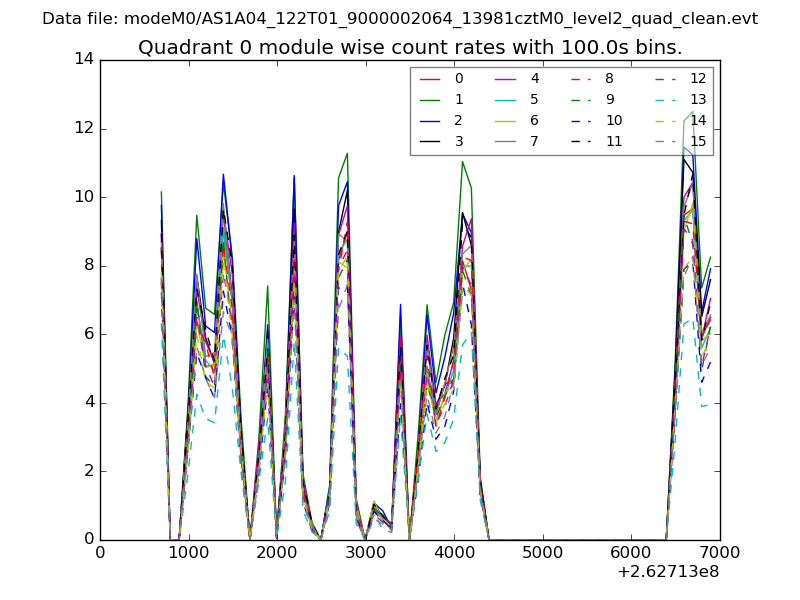 |
 |
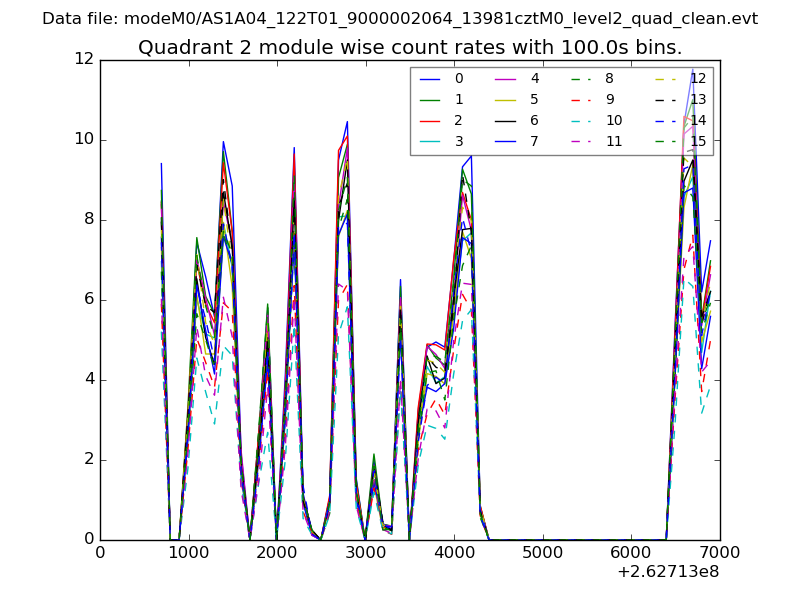
| Module-wise count rates for Quadrant B Data is divided into 100 sec bins |
 |
 |
| Module-wise count rates for Quadrant C Data is divided into 100 sec bins |
 |
 |
| Module-wise count rates for Quadrant D Data is divided into 100 sec bins |
 |
 |
| Parameter | Plot |
|---|---|
| CZT HV Monitor | 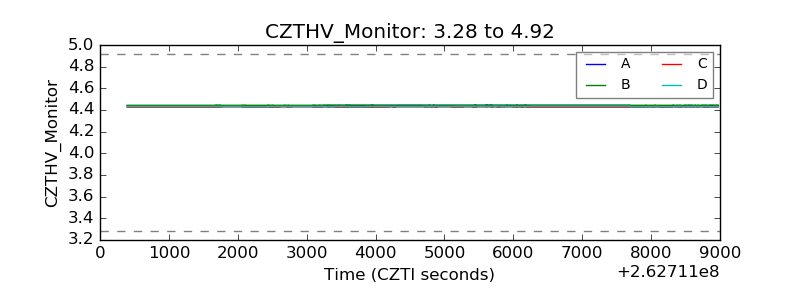 |
| D_VDD | 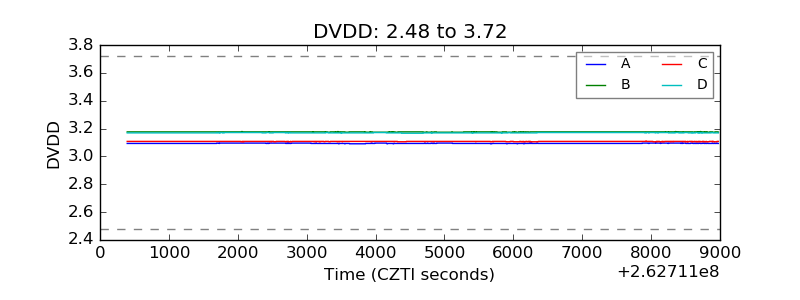 |
| Temperature 1 | 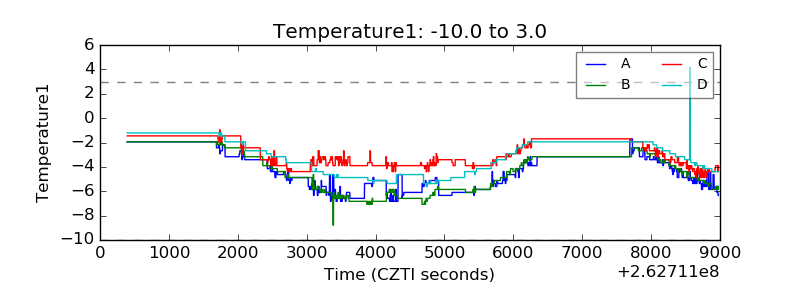 |
| Veto HV Monitor | 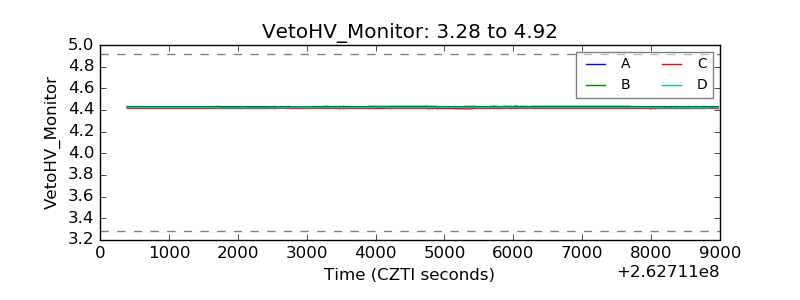 |
| Veto LLD | 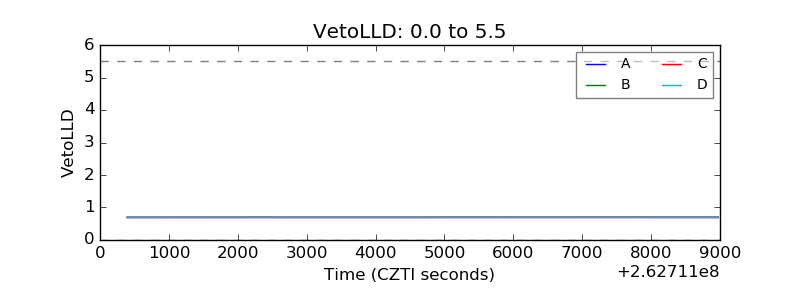 |
| Alpha Counter | 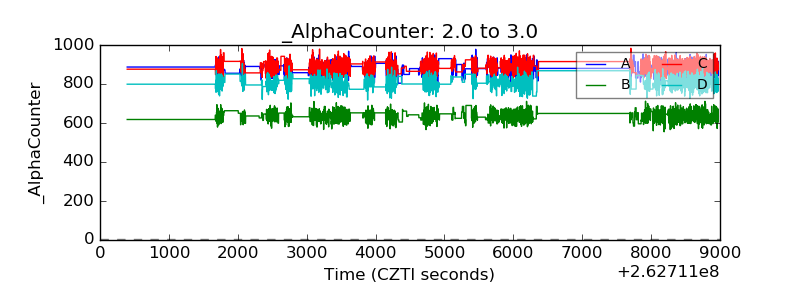 |
| _CPM_Rate | 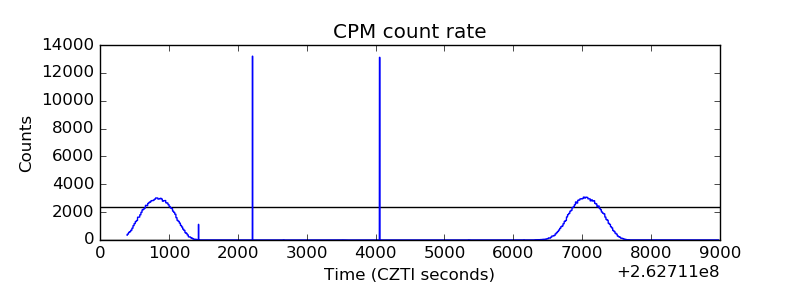 |
| CZT Counter | 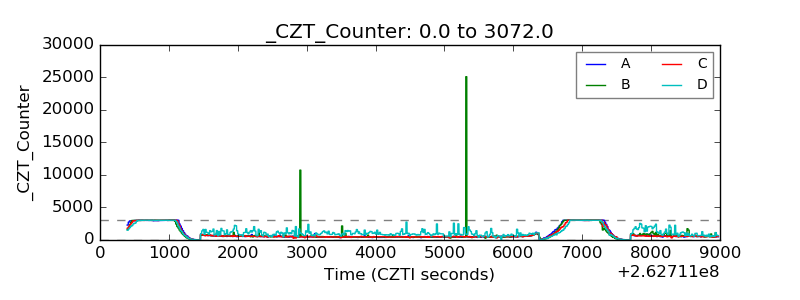 |
| +2.5 Volts monitor |  |
| +5 Volts monitor |  |
| _ROLL_ROT | 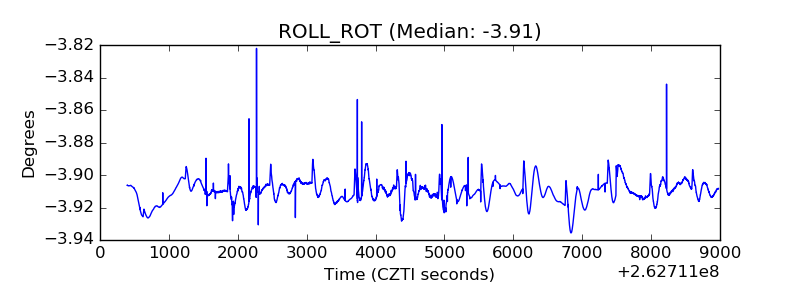 |
| _Roll_DEC |  |
| _Roll_RA | 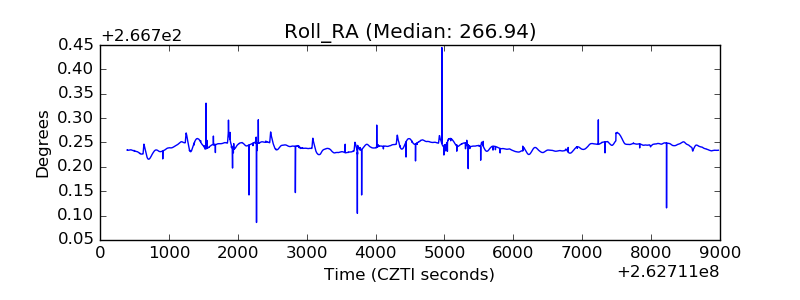 |
| Veto Counter | 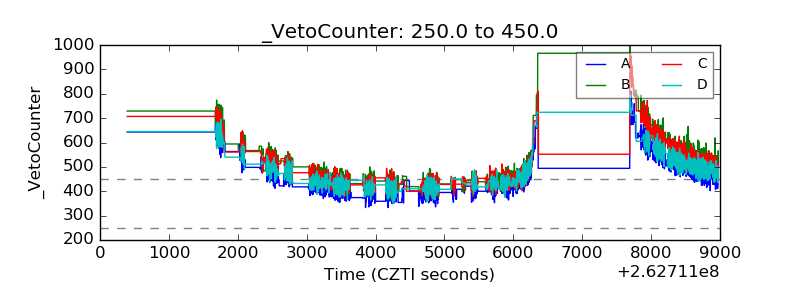 |