| Param | Original file | Final file |
|---|---|---|
| Filename | modeM0/AS1A04_122T01_9000002064_13991cztM0_level2.evt | modeM0/AS1A04_122T01_9000002064_13991cztM0_level2_quad_clean.evt |
| Size (bytes) | 1,321,885,440 | 225,138,240 |
| Size | 1.2 GB | 214.7 MB |
| Events in quadrant A | 9,247,561 | 1,381,211 |
| Events in quadrant B | 9,624,468 | 1,480,370 |
| Events in quadrant C | 9,039,080 | 1,351,082 |
| Events in quadrant D | 10,822,318 | 1,280,994 |
| Mode M9 | |||
|---|---|---|---|
| Quadrant | BADHDUFLAG | Total packets | Discarded packets |
| A | 0 | 17 | 0 |
| B | 0 | 17 | 0 |
| C | 0 | 17 | 0 |
| D | 0 | 17 | 0 |
| Mode SS | |||
|---|---|---|---|
| Quadrant | BADHDUFLAG | Total packets | Discarded packets |
| A | 0 | 390 | 0 |
| B | 0 | 390 | 0 |
| C | 0 | 390 | 0 |
| D | 0 | 390 | 0 |
| Mode M0 | |||
|---|---|---|---|
| Quadrant | BADHDUFLAG | Total packets | Discarded packets |
| A | 0 | 39903 | 3 |
| B | 0 | 40460 | 3 |
| C | 0 | 39140 | 3 |
| D | 0 | 44415 | 3 |
| Quadrant | Total seconds | Saturated seconds | Saturation percentage |
|---|---|---|---|
| A | 19232 | 279 | 1.450707% |
| B | 19232 | 287 | 1.492304% |
| C | 19232 | 168 | 0.873544% |
| D | 19232 | 320 | 1.663894% |
Noise dominated data is calculated using 1-second bins in cleaned event files. If a bin has >2000 counts, and if more than 50% of those come from <1% of pixels, then it is considered to be noise-dominated and hence unusable.
| Quadrant | # 1 sec bins | Bins with >0 counts | Bins with >2000 counts | High rate bins dominated by noise | Noise dominated (total time) | Noise dominated (detector-on time) | Marked lightcurve |
|---|---|---|---|---|---|---|---|
| A | 20943 | 19237 | 18 | 18 | 0.09% | 0.09% | 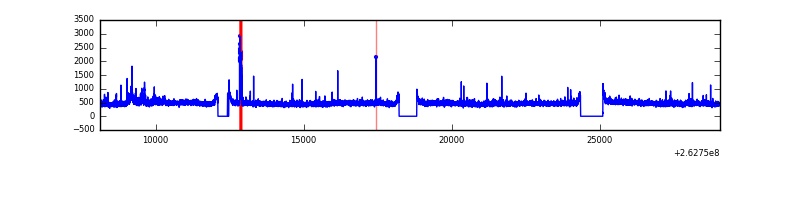 |
| B | 20943 | 19236 | 26 | 26 | 0.12% | 0.14% | 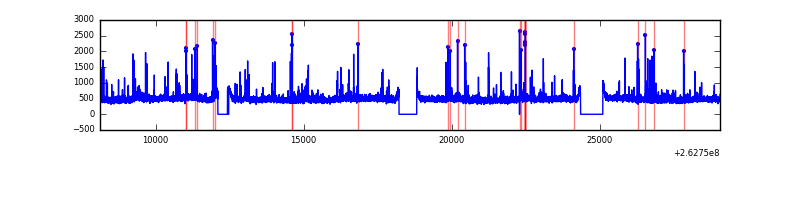 |
| C | 20943 | 19237 | 3 | 3 | 0.01% | 0.02% | 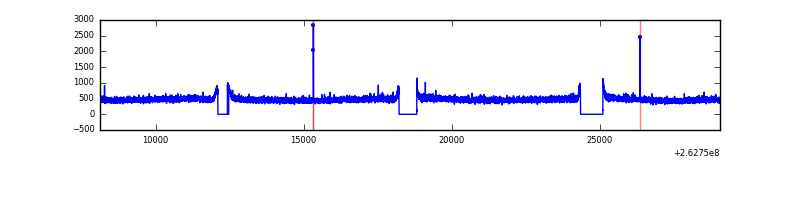 |
| D | 20943 | 19237 | 130 | 130 | 0.62% | 0.68% | 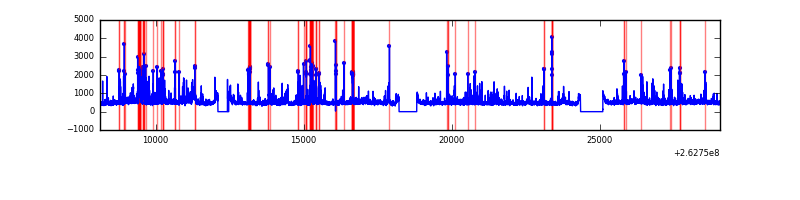 |
Top three noisy pixels from each quadrant. If the there are fewer than three noisy pixels in the level2.evt file, extra rows are filled as -1
| Pixel properties | Quadrant properties | ||||||
|---|---|---|---|---|---|---|---|
| Quadrant | DetID | PixID | Counts | Sigma | Mean | Median | Sigma |
| A | 8 | 15 | 226913 | 484.1 | 2281 | 2231 | 464.1 |
| A | 14 | 111 | 107805 | 227.47 | 2281 | 2231 | 464.1 |
| A | 1 | 162 | 59960 | 124.38 | 2281 | 2231 | 464.1 |
| B | 0 | 189 | 143236 | 324.0 | 2304 | 2254 | 435.1 |
| B | 4 | 80 | 105312 | 236.84 | 2304 | 2254 | 435.1 |
| B | 3 | 209 | 77682 | 173.35 | 2304 | 2254 | 435.1 |
| C | 3 | 233 | 387148 | 751.28 | 2217 | 2225 | 512.4 |
| C | 13 | 61 | 15844 | 26.58 | 2217 | 2225 | 512.4 |
| C | 14 | 234 | 13680 | 22.36 | 2217 | 2225 | 512.4 |
| D | 8 | 195 | 429869 | 820.9 | 2191 | 2136 | 521.1 |
| D | 13 | 189 | 419306 | 800.63 | 2191 | 2136 | 521.1 |
| D | 1 | 52 | 413907 | 790.26 | 2191 | 2136 | 521.1 |
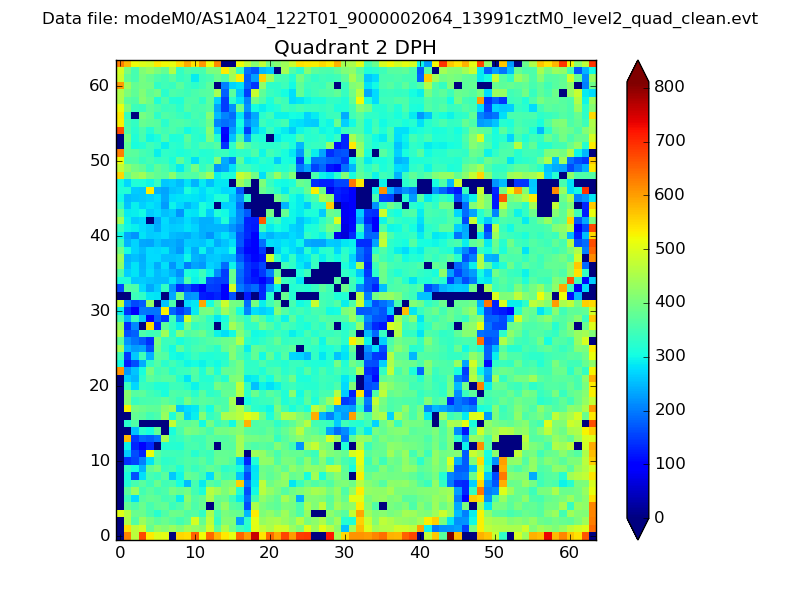
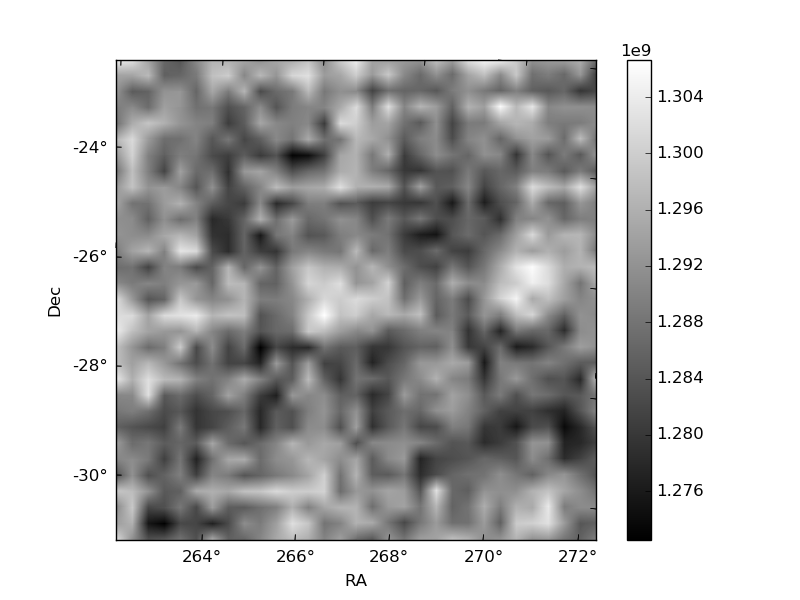
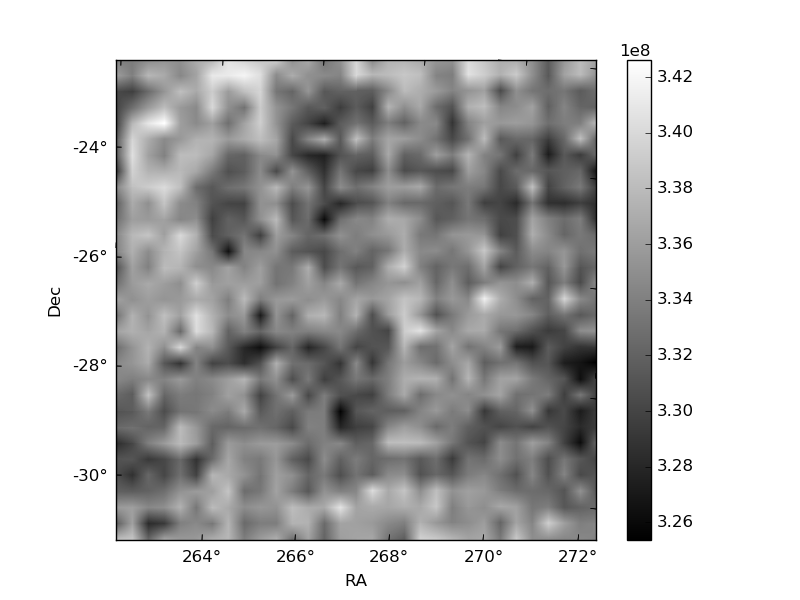
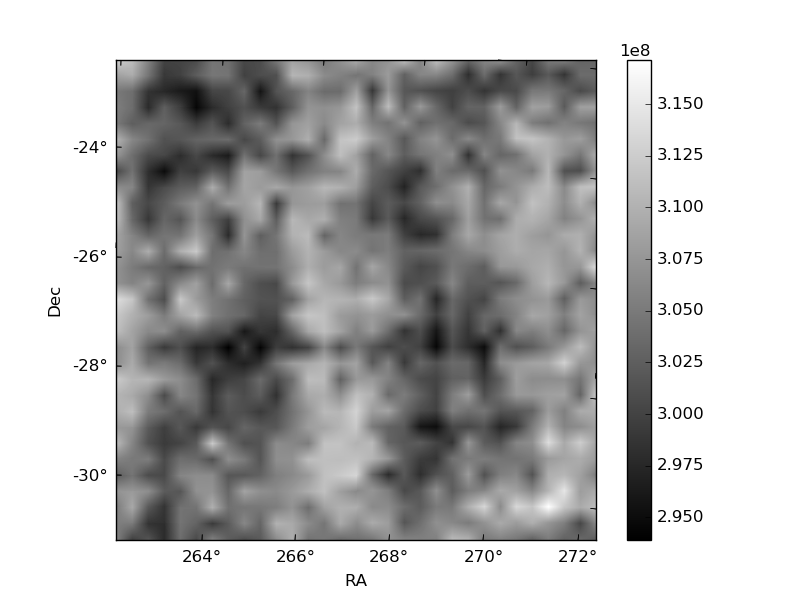
Histogram calculated using DETX and DETY for each event in the final _common_clean file
| Quadrant A | 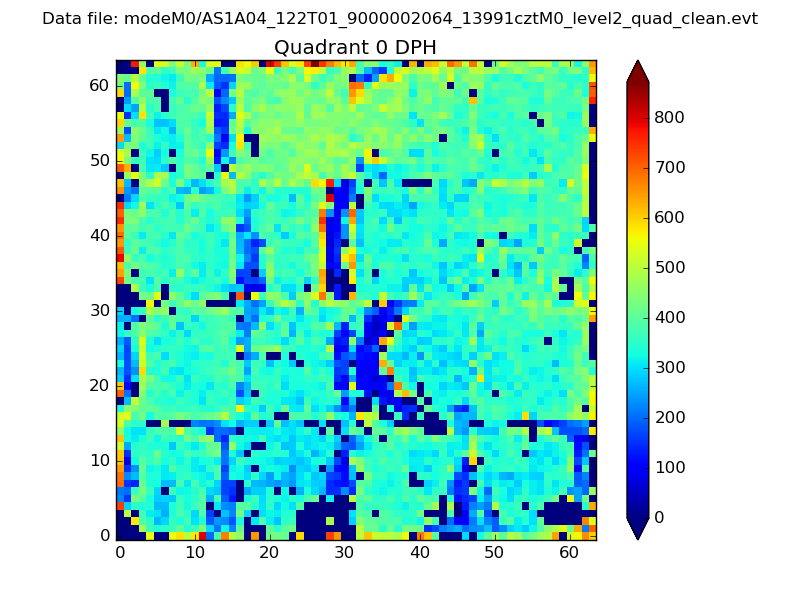 |
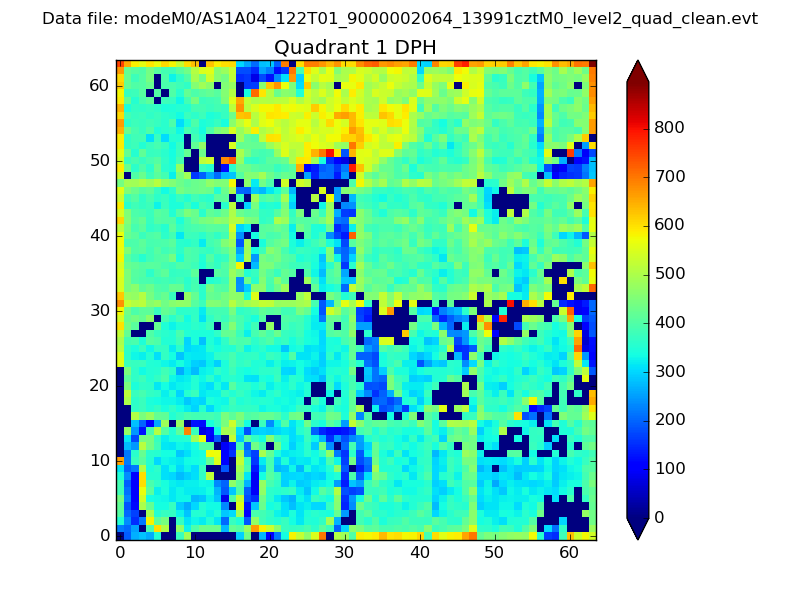 |
Quadrant B |
|---|---|---|---|
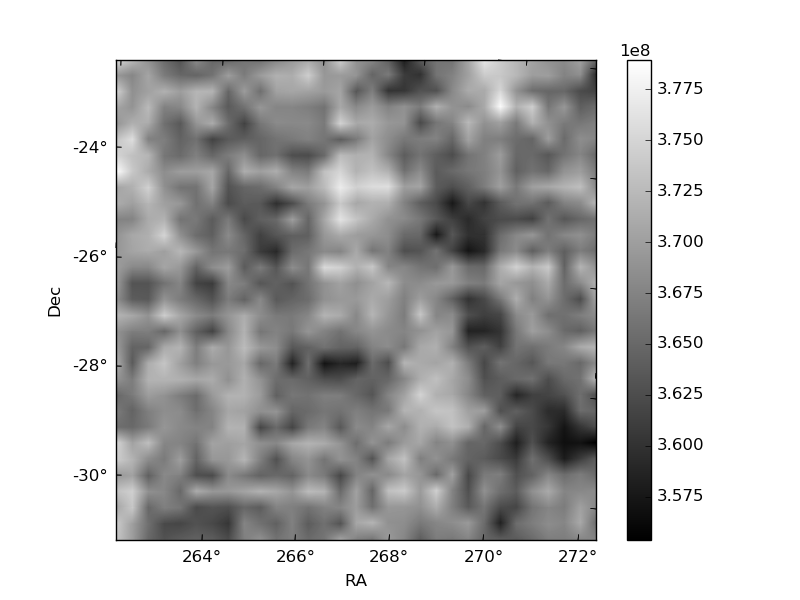
| Quadrant D | 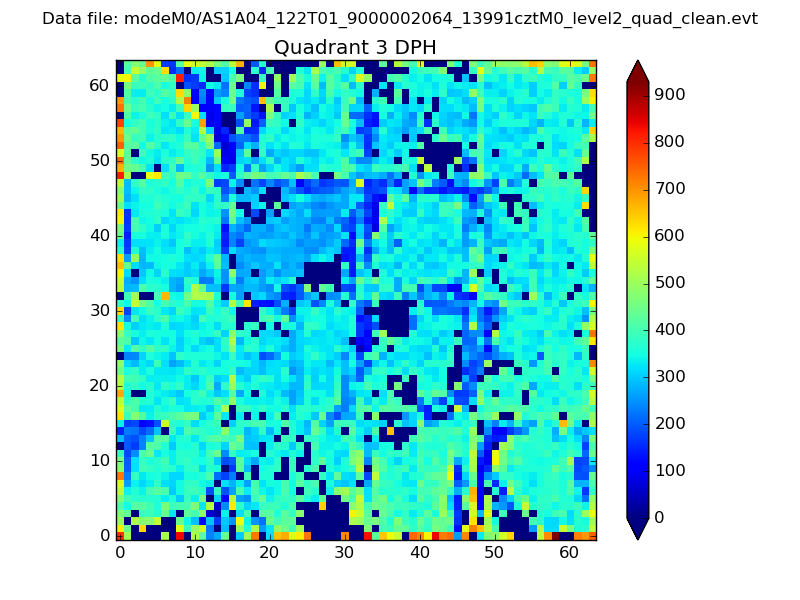 |
 |
Quadrant C |
| Plot type | Count rate plots | Images |
|---|---|---|
| Comparison with Poisson distribution Blue bars denote a histogram of data divided into 1 sec bins. Red curve is a Poisson curve with rate = median count rate of data. |
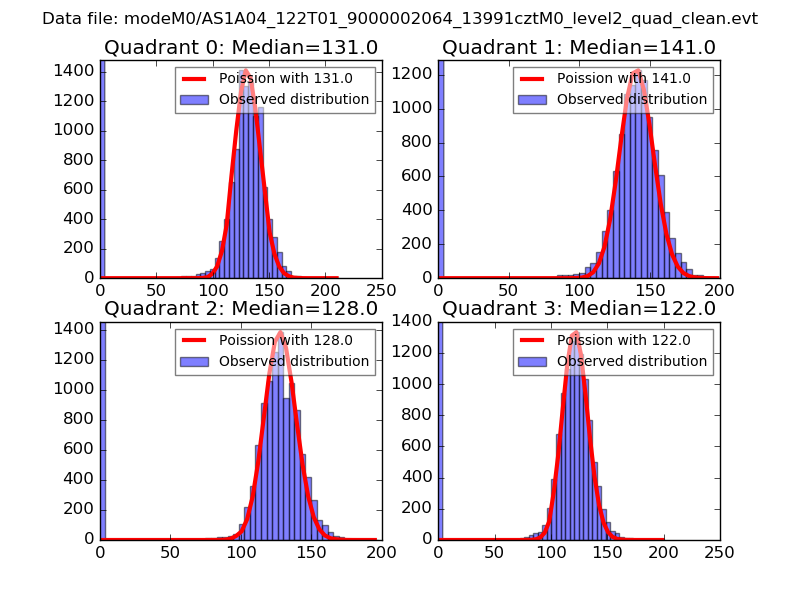 |
 |
| Quadrant-wise count rates Data is divided into 100 sec bins |
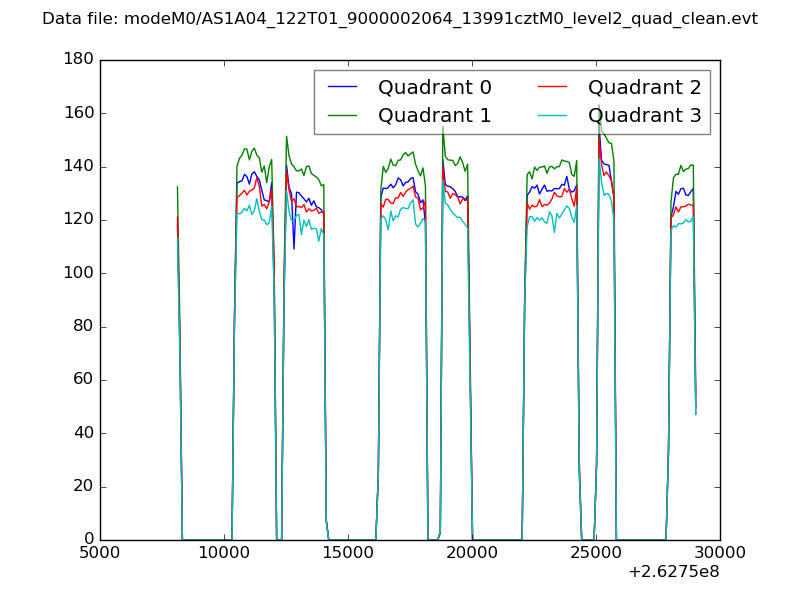 |
|
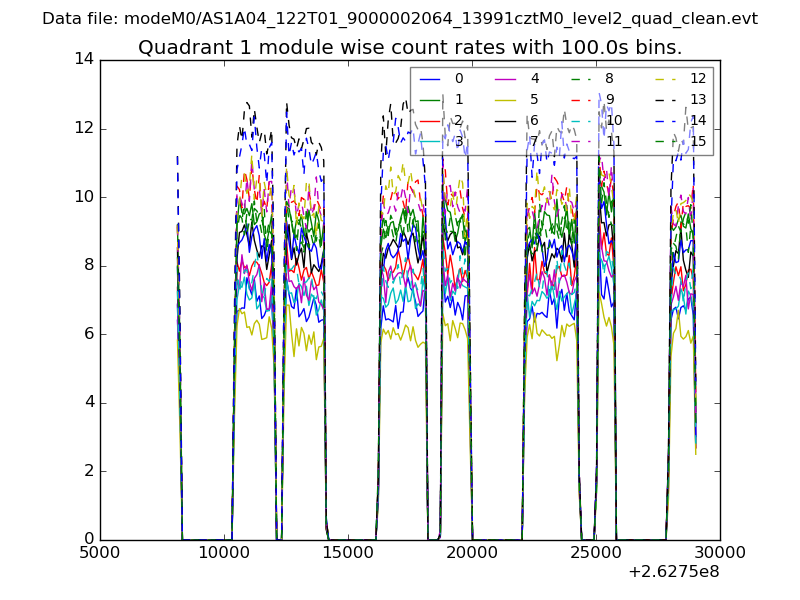
| Module-wise count rates for Quadrant A Data is divided into 100 sec bins |
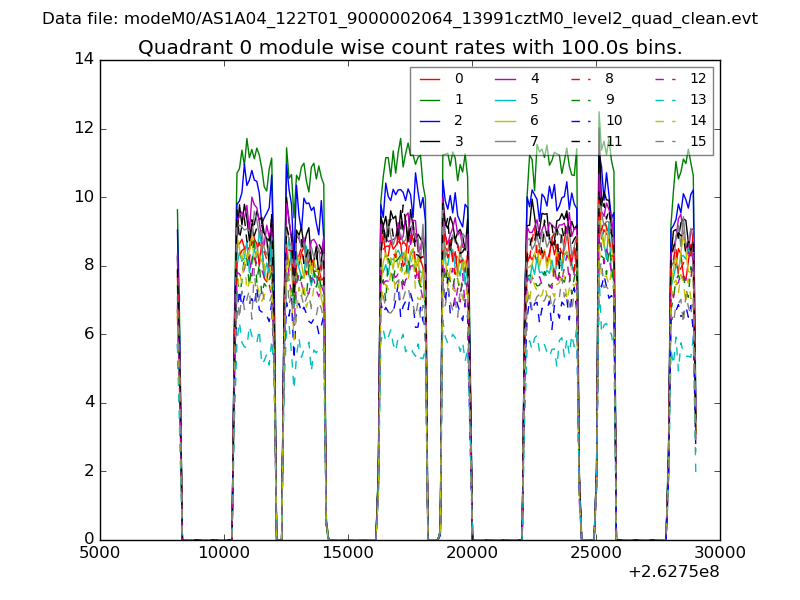 |
 |
| Module-wise count rates for Quadrant B Data is divided into 100 sec bins |
 |
 |
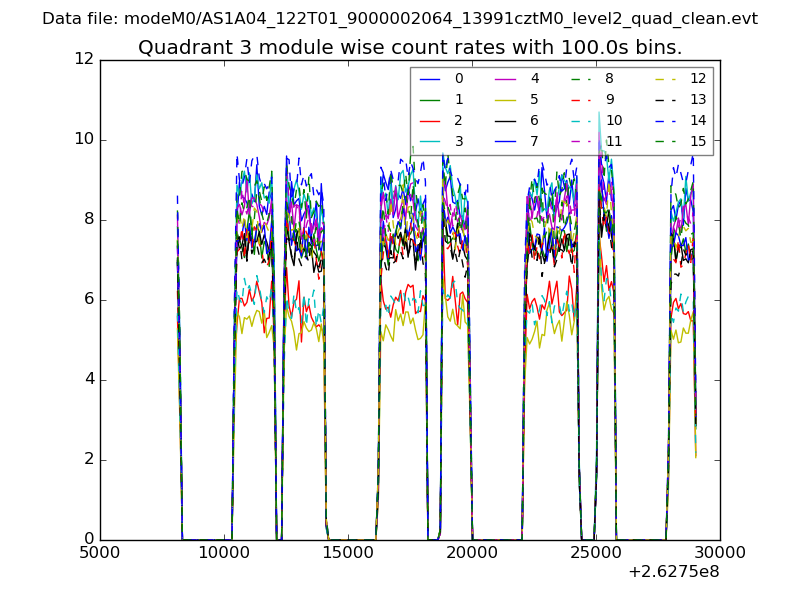
| Module-wise count rates for Quadrant C Data is divided into 100 sec bins |
 |
 |
| Module-wise count rates for Quadrant D Data is divided into 100 sec bins |
 |
 |
| Parameter | Plot |
|---|---|
| CZT HV Monitor | 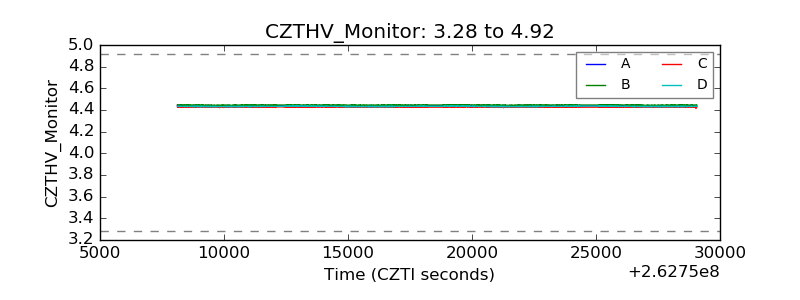 |
| D_VDD | 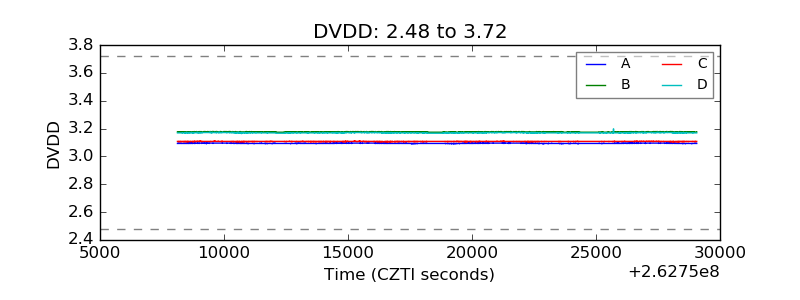 |
| Temperature 1 | 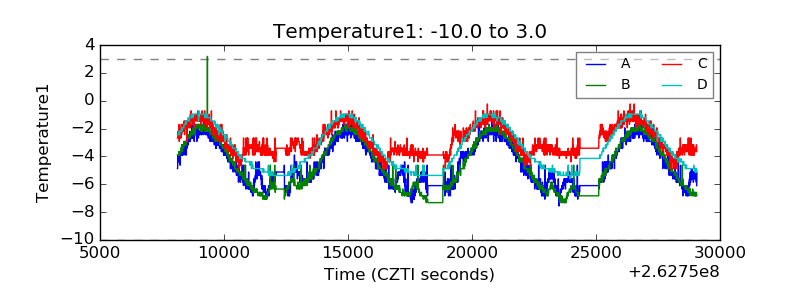 |
| Veto HV Monitor | 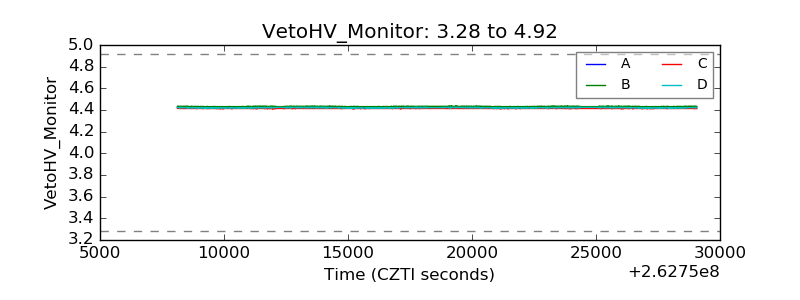 |
| Veto LLD | 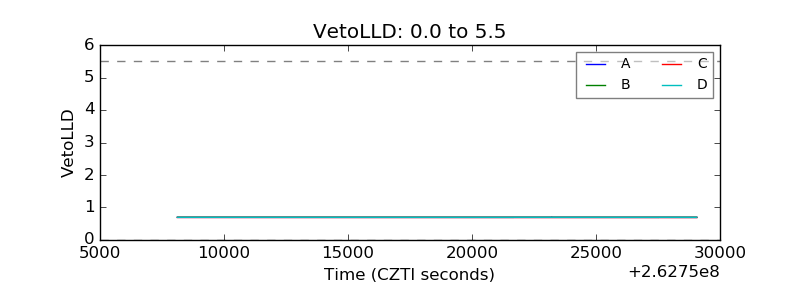 |
| Alpha Counter | 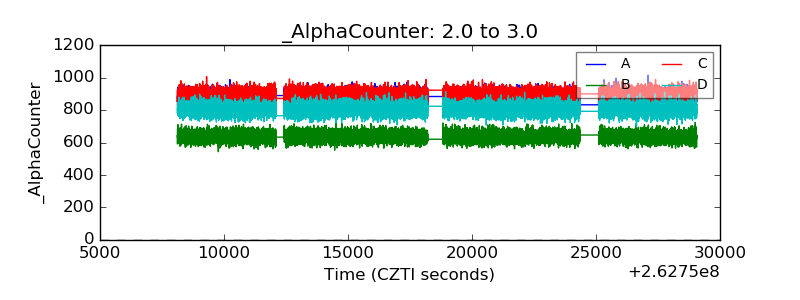 |
| _CPM_Rate | 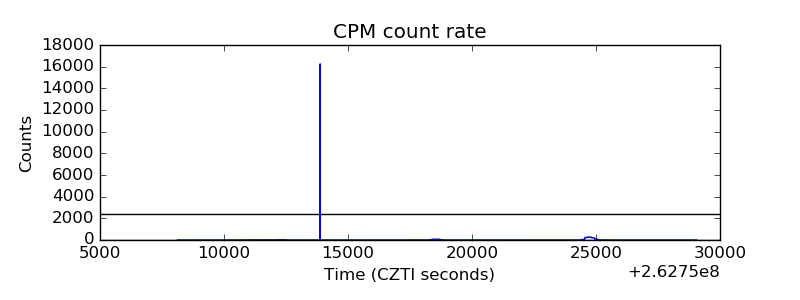 |
| CZT Counter | 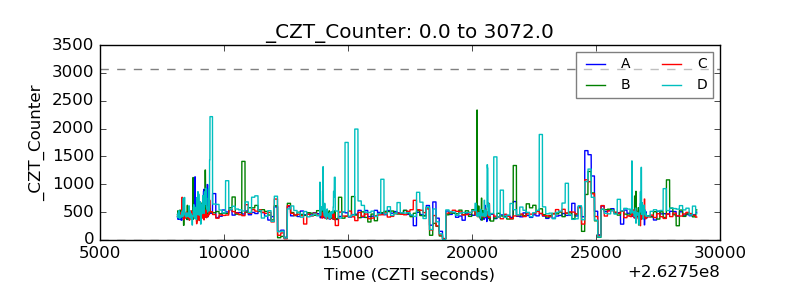 |
| +2.5 Volts monitor |  |
| +5 Volts monitor |  |
| _ROLL_ROT |  |
| _Roll_DEC | 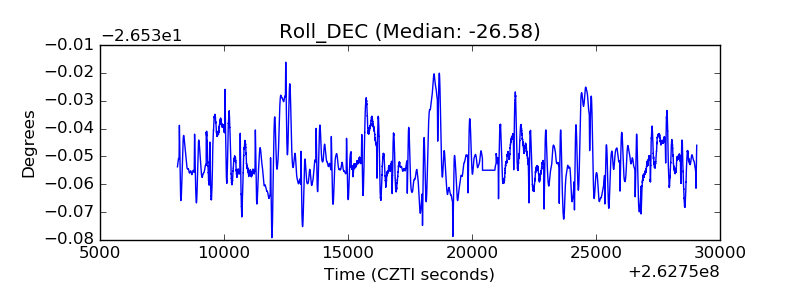 |
| _Roll_RA | 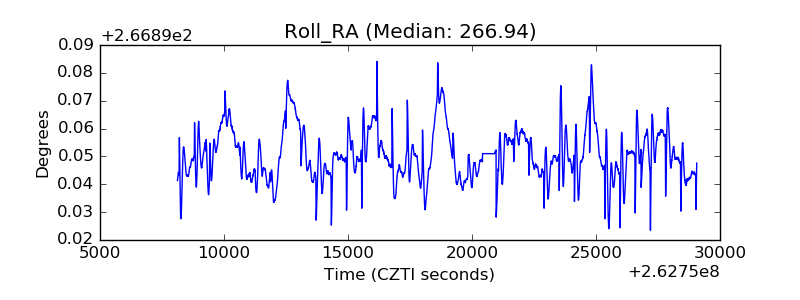 |
| Veto Counter | 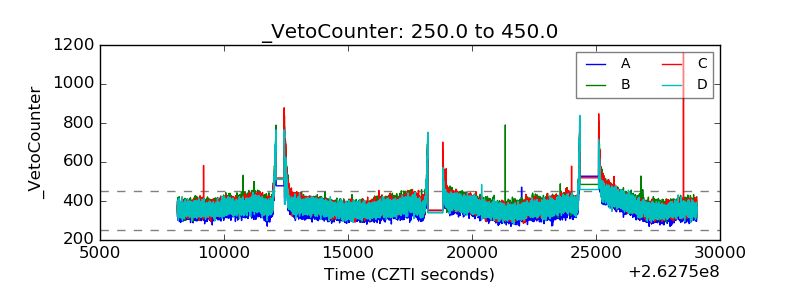 |