| Param | Original file | Final file |
|---|---|---|
| Filename | modeM0/AS1A04_038T02_9000002068cztM0_level2.fits | modeM0/AS1A04_038T02_9000002068cztM0_level2_quad_clean.evt |
| Size (bytes) | 337,956,480 | 461,661,120 |
| Size | 322.3 MB | 440.3 MB |
| Events in quadrant A | 2,071,177 | 3,073,649 |
| Events in quadrant B | 1,997,384 | 3,067,795 |
| Events in quadrant C | 1,998,526 | 2,841,131 |
| Events in quadrant D | 1,686,460 | 2,519,812 |
| Mode SS | |||
|---|---|---|---|
| Quadrant | BADHDUFLAG | Total packets | Discarded packets |
| A | 0 | 722 | 0 |
| B | 0 | 722 | 0 |
| C | 0 | 1124 | 0 |
| D | 0 | 1124 | 0 |
| Mode M9 | |||
|---|---|---|---|
| Quadrant | BADHDUFLAG | Total packets | Discarded packets |
| A | 0 | 76 | 0 |
| B | 0 | 76 | 0 |
| C | 0 | 76 | 0 |
| D | 0 | 76 | 0 |
| Mode M0 | |||
|---|---|---|---|
| Quadrant | BADHDUFLAG | Total packets | Discarded packets |
| A | 0 | 74185 | 0 |
| B | 0 | 78519 | 0 |
| C | 0 | 75078 | 0 |
| D | 0 | 103450 | 0 |
| Quadrant | Total seconds | Saturated seconds | Saturation percentage |
|---|---|---|---|
| A | 35466 | 408 | 1.150398% |
| B | 35468 | 669 | 1.886207% |
| C | 35468 | 365 | 1.029097% |
| D | 35460 | 2348 | 6.621545% |
Noise dominated data is calculated using 1-second bins in cleaned event files. If a bin has >2000 counts, and if more than 50% of those come from <1% of pixels, then it is considered to be noise-dominated and hence unusable.
| Quadrant | # 1 sec bins | Bins with >0 counts | Bins with >2000 counts | High rate bins dominated by noise | Noise dominated (total time) | Noise dominated (detector-on time) | Marked lightcurve |
|---|---|---|---|---|---|---|---|
| A | 41826 | 35412 | 0 | 0 | 0.00% | 0.00% | 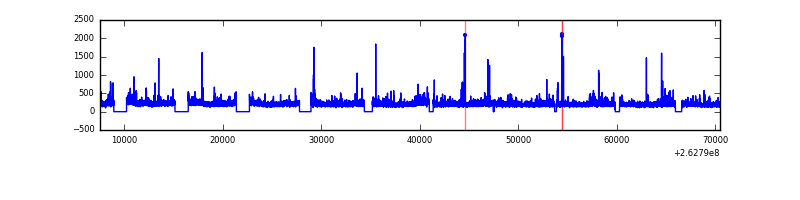 |
| B | 41826 | 35405 | 0 | 0 | 0.00% | 0.00% |  |
| C | 41826 | 35410 | 0 | 0 | 0.00% | 0.00% | 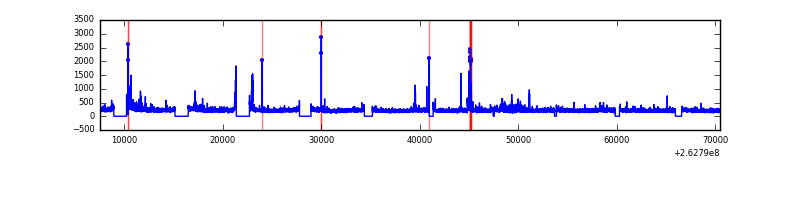 |
| D | 41826 | 35403 | 0 | 0 | 0.00% | 0.00% | 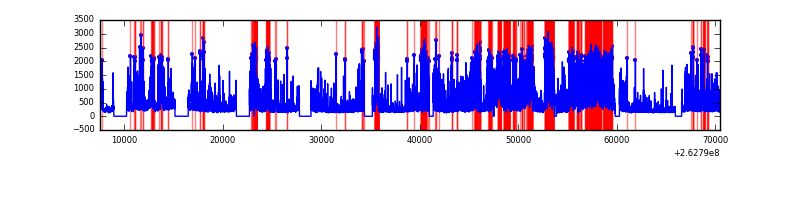 |
Top three noisy pixels from each quadrant. If the there are fewer than three noisy pixels in the level2.evt file, extra rows are filled as -1
| Pixel properties | Quadrant properties | ||||||
|---|---|---|---|---|---|---|---|
| Quadrant | DetID | PixID | Counts | Sigma | Mean | Median | Sigma |
| A | 0 | 29 | 2014 | 11.18 | 539 | 508 | 134.8 |
| A | 7 | 110 | 1646 | 8.44 | 539 | 508 | 134.8 |
| A | 9 | 19 | 1577 | 7.93 | 539 | 508 | 134.8 |
| B | 2 | 9 | 1742 | 12.1 | 527 | 506 | 102.1 |
| B | 14 | 254 | 1324 | 8.01 | 527 | 506 | 102.1 |
| B | 12 | 226 | 1306 | 7.83 | 527 | 506 | 102.1 |
| C | 3 | 126 | 1351 | 6.29 | 528 | 495 | 136.1 |
| C | 9 | 188 | 1319 | 6.06 | 528 | 495 | 136.1 |
| C | 2 | 191 | 1313 | 6.01 | 528 | 495 | 136.1 |
| D | 3 | 14 | 1229 | 6.03 | 481 | 438 | 131.3 |
| D | 10 | 189 | 1220 | 5.96 | 481 | 438 | 131.3 |
| D | 6 | 231 | 1201 | 5.81 | 481 | 438 | 131.3 |
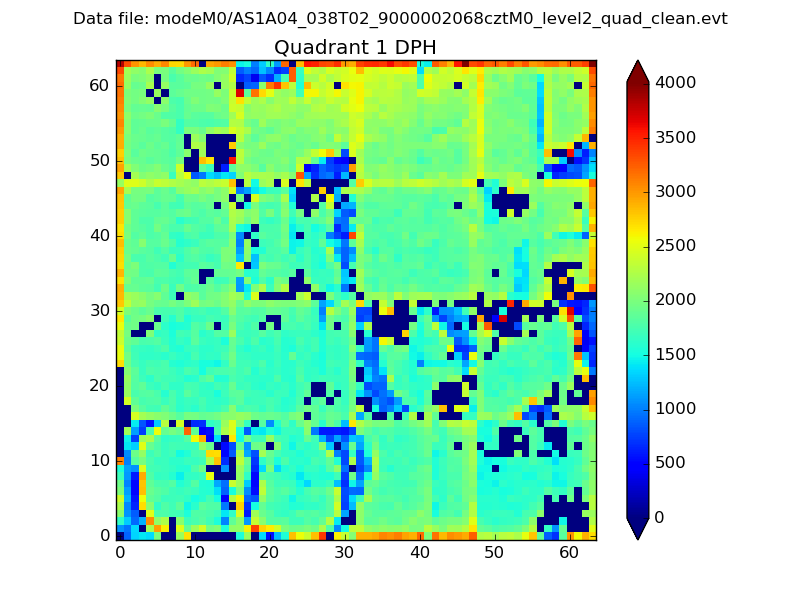
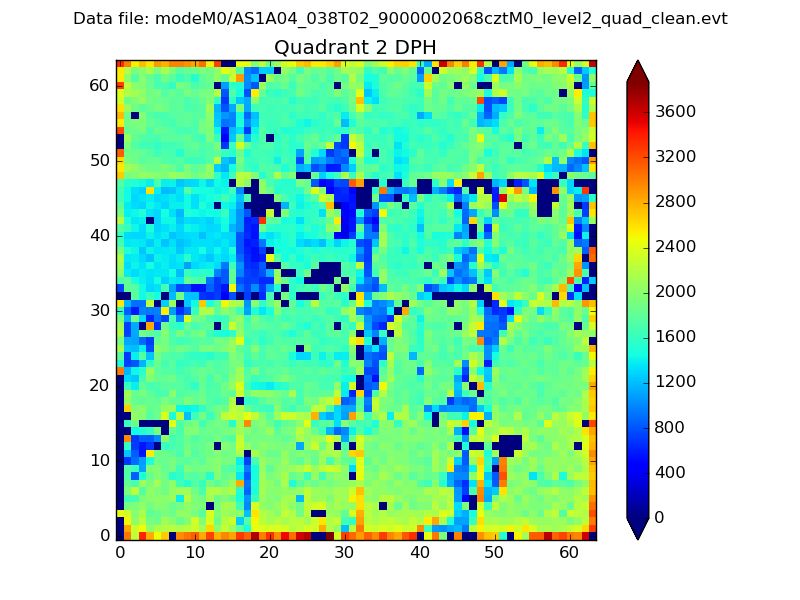
Histogram calculated using DETX and DETY for each event in the final _common_clean file
| Quadrant A | 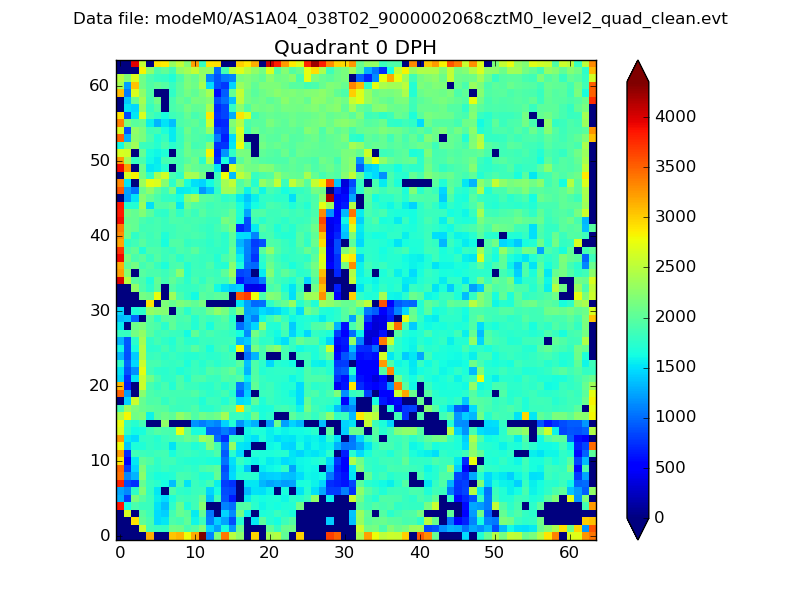 |
 |
Quadrant B |
|---|---|---|---|
| Quadrant D |  |
 |
Quadrant C |
| Plot type | Count rate plots | Images |
|---|---|---|
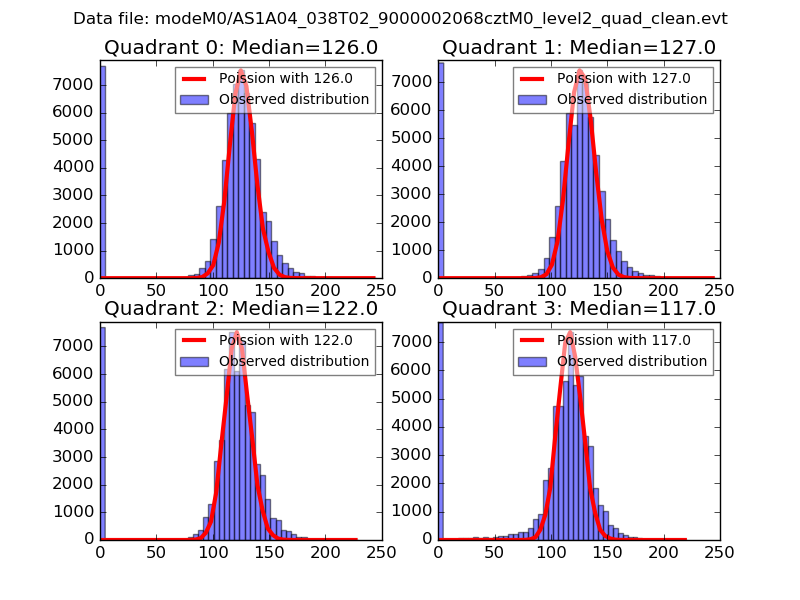
| Comparison with Poisson distribution Blue bars denote a histogram of data divided into 1 sec bins. Red curve is a Poisson curve with rate = median count rate of data. |
 |
 |
| Quadrant-wise count rates Data is divided into 100 sec bins |
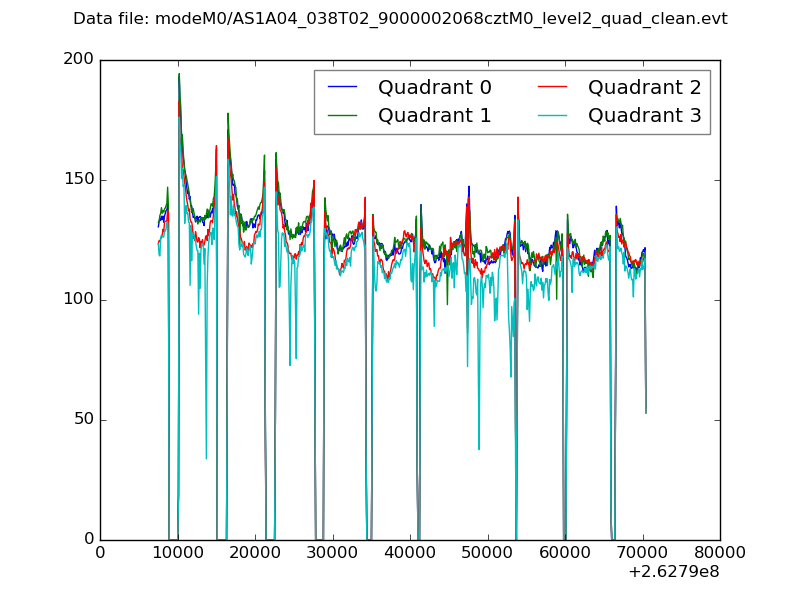 |
|
| Module-wise count rates for Quadrant A Data is divided into 100 sec bins |
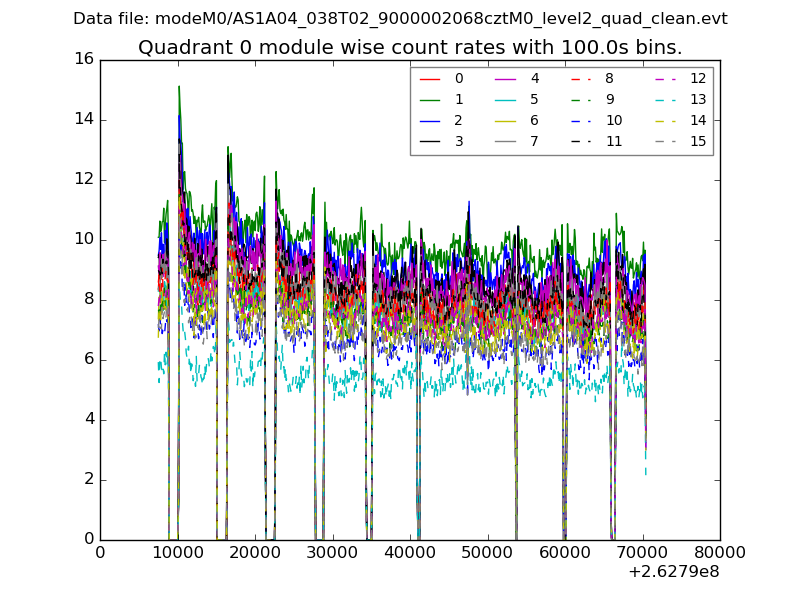 |
 |
| Module-wise count rates for Quadrant B Data is divided into 100 sec bins |
 |
 |
| Module-wise count rates for Quadrant C Data is divided into 100 sec bins |
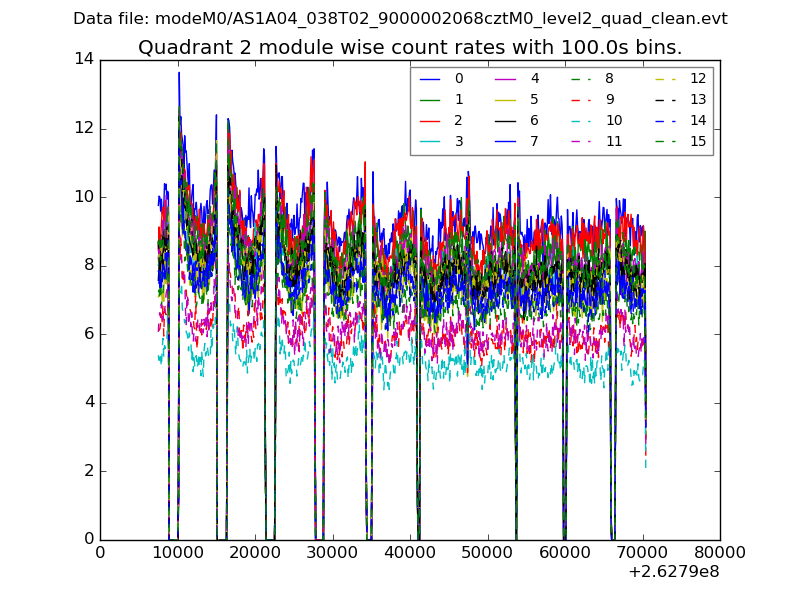 |
 |
| Module-wise count rates for Quadrant D Data is divided into 100 sec bins |
 |
 |
| Parameter | Plot |
|---|---|
| CZT HV Monitor |  |
| D_VDD | 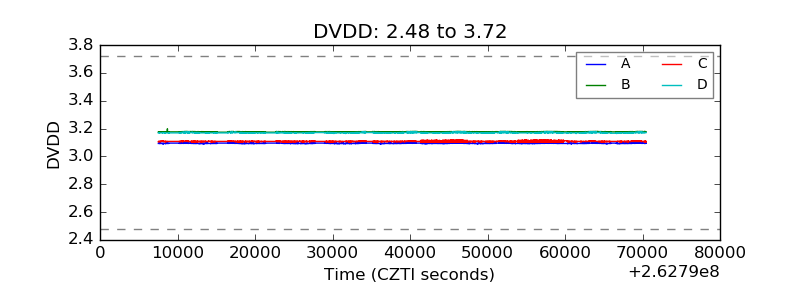 |
| Temperature 1 |  |
| Veto HV Monitor |  |
| Veto LLD |  |
| Alpha Counter |  |
| _CPM_Rate |  |
| CZT Counter |  |
| +2.5 Volts monitor | 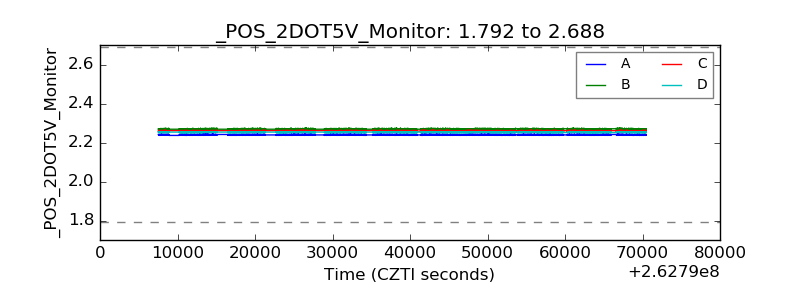 |
| +5 Volts monitor |  |
| _ROLL_ROT |  |
| _Roll_DEC | 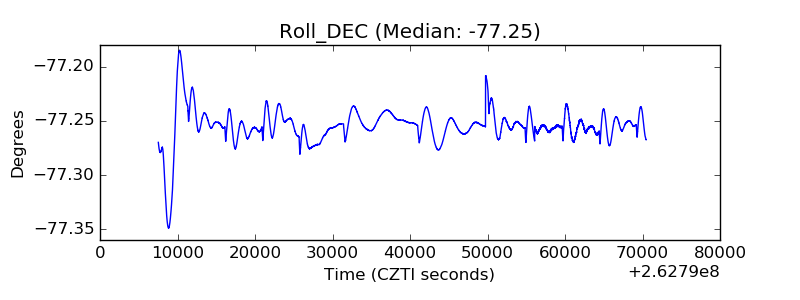 |
| _Roll_RA |  |
| Veto Counter |  |