| Param | Original file | Final file |
|---|---|---|
| Filename | modeM0/AS1A04_038T02_9000002068_13995cztM0_level2.evt | modeM0/AS1A04_038T02_9000002068_13995cztM0_level2_quad_clean.evt |
| Size (bytes) | 224,205,120 | 59,898,240 |
| Size | 213.8 MB | 57.1 MB |
| Events in quadrant A | 1,477,746 | 413,457 |
| Events in quadrant B | 1,590,983 | 420,079 |
| Events in quadrant C | 1,589,375 | 396,331 |
| Events in quadrant D | 1,940,104 | 383,915 |
| Mode SS | |||
|---|---|---|---|
| Quadrant | BADHDUFLAG | Total packets | Discarded packets |
| A | 0 | 58 | 0 |
| B | 0 | 58 | 0 |
| C | 0 | 58 | 0 |
| D | 0 | 58 | 0 |
| Mode M9 | |||
|---|---|---|---|
| Quadrant | BADHDUFLAG | Total packets | Discarded packets |
| A | 0 | 13 | 0 |
| B | 0 | 13 | 0 |
| C | 0 | 13 | 0 |
| D | 0 | 13 | 0 |
| Mode M0 | |||
|---|---|---|---|
| Quadrant | BADHDUFLAG | Total packets | Discarded packets |
| A | 0 | 6149 | 2 |
| B | 0 | 6541 | 1 |
| C | 0 | 6504 | 1 |
| D | 0 | 7643 | 1 |
| Quadrant | Total seconds | Saturated seconds | Saturation percentage |
|---|---|---|---|
| A | 2798 | 28 | 1.000715% |
| B | 2798 | 49 | 1.751251% |
| C | 2798 | 23 | 0.822016% |
| D | 2798 | 70 | 2.501787% |
Noise dominated data is calculated using 1-second bins in cleaned event files. If a bin has >2000 counts, and if more than 50% of those come from <1% of pixels, then it is considered to be noise-dominated and hence unusable.
| Quadrant | # 1 sec bins | Bins with >0 counts | Bins with >2000 counts | High rate bins dominated by noise | Noise dominated (total time) | Noise dominated (detector-on time) | Marked lightcurve |
|---|---|---|---|---|---|---|---|
| A | 4099 | 2800 | 0 | 0 | 0.00% | 0.00% | 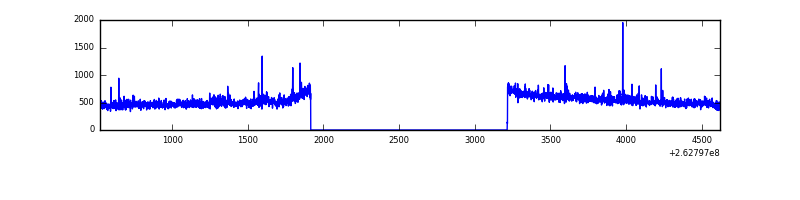 |
| B | 4099 | 2800 | 12 | 12 | 0.29% | 0.43% | 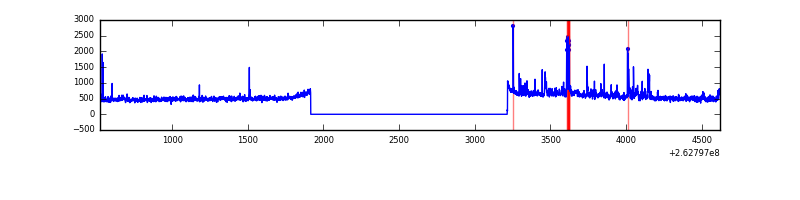 |
| C | 4099 | 2800 | 9 | 9 | 0.22% | 0.32% | 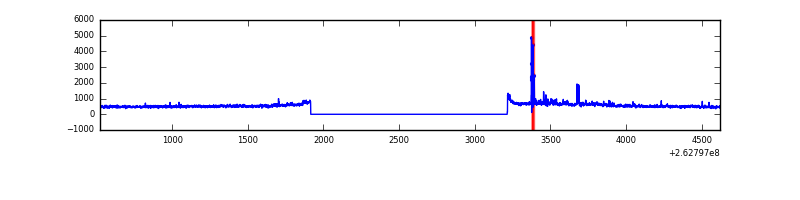 |
| D | 4099 | 2800 | 47 | 47 | 1.15% | 1.68% |  |
Top three noisy pixels from each quadrant. If the there are fewer than three noisy pixels in the level2.evt file, extra rows are filled as -1
| Pixel properties | Quadrant properties | ||||||
|---|---|---|---|---|---|---|---|
| Quadrant | DetID | PixID | Counts | Sigma | Mean | Median | Sigma |
| A | 8 | 15 | 13121 | 168.31 | 371 | 364 | 75.8 |
| A | 9 | 143 | 10579 | 134.77 | 371 | 364 | 75.8 |
| A | 12 | 189 | 10341 | 131.63 | 371 | 364 | 75.8 |
| B | 0 | 189 | 57954 | 811.86 | 370 | 361 | 70.9 |
| B | 0 | 219 | 23723 | 329.32 | 370 | 361 | 70.9 |
| B | 3 | 64 | 19389 | 268.23 | 370 | 361 | 70.9 |
| C | 3 | 233 | 171710 | 2098.16 | 353 | 355 | 81.7 |
| C | 0 | 207 | 33361 | 404.14 | 353 | 355 | 81.7 |
| C | 14 | 234 | 8919 | 104.86 | 353 | 355 | 81.7 |
| D | 13 | 104 | 149489 | 1628.6 | 350 | 343 | 91.6 |
| D | 8 | 195 | 105723 | 1150.7 | 350 | 343 | 91.6 |
| D | 13 | 122 | 83534 | 908.41 | 350 | 343 | 91.6 |
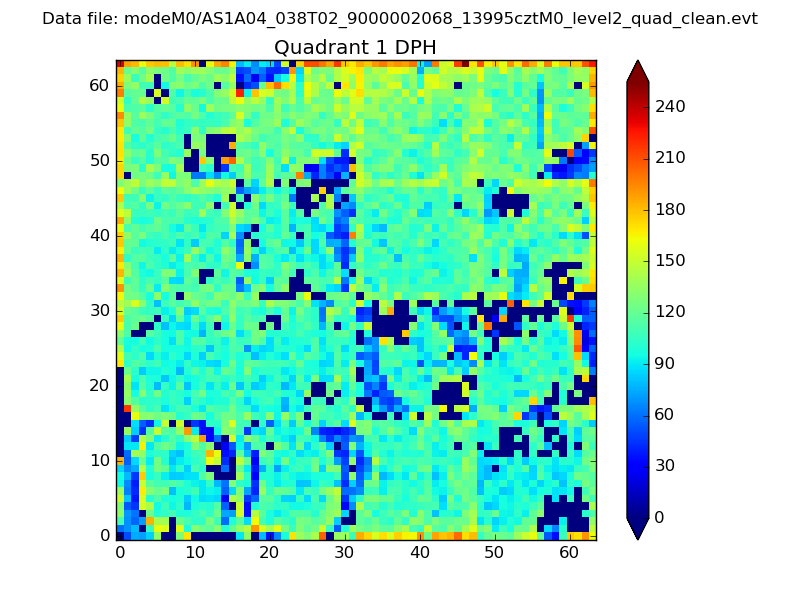
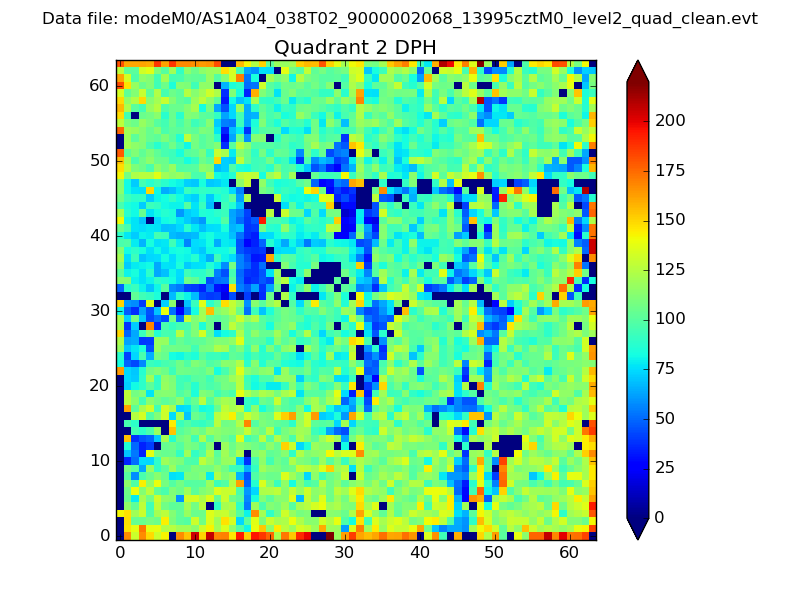
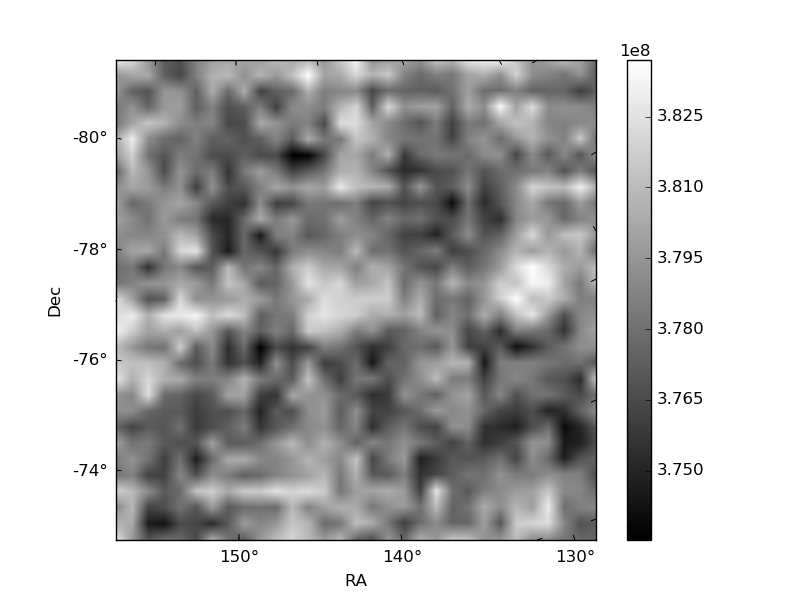
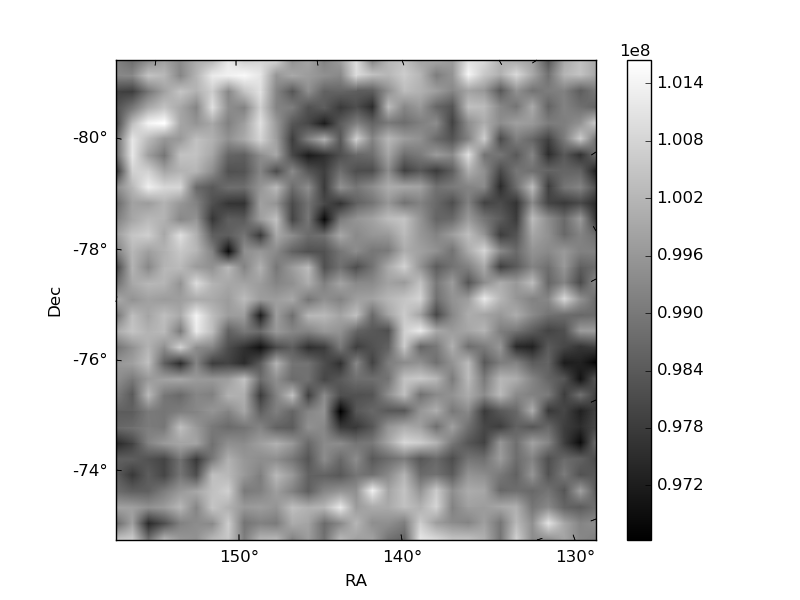
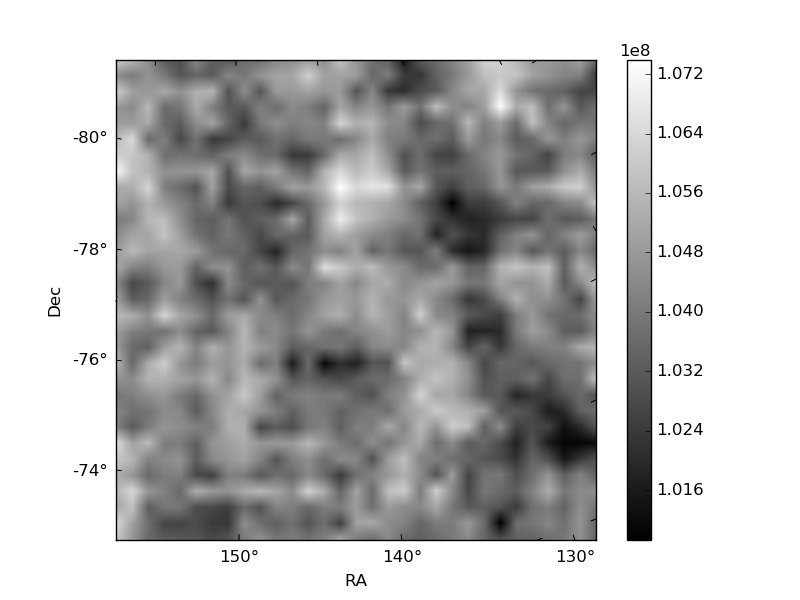
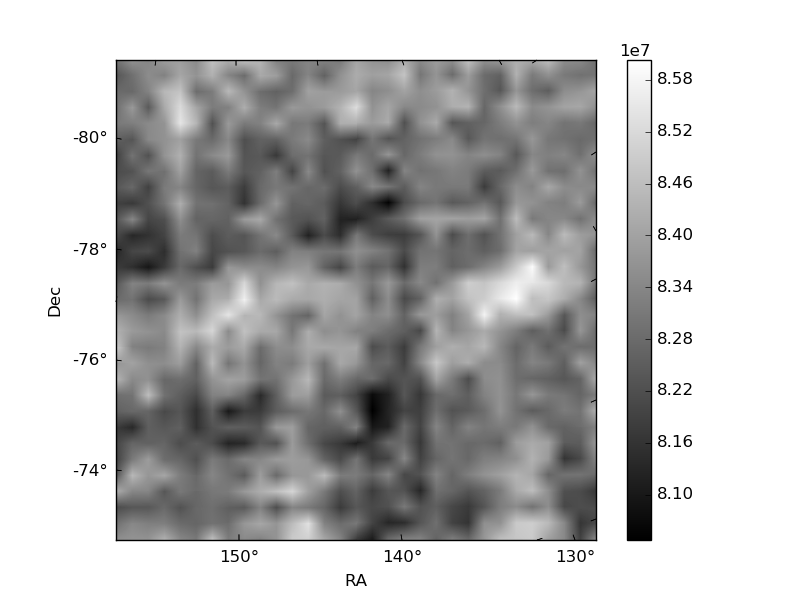
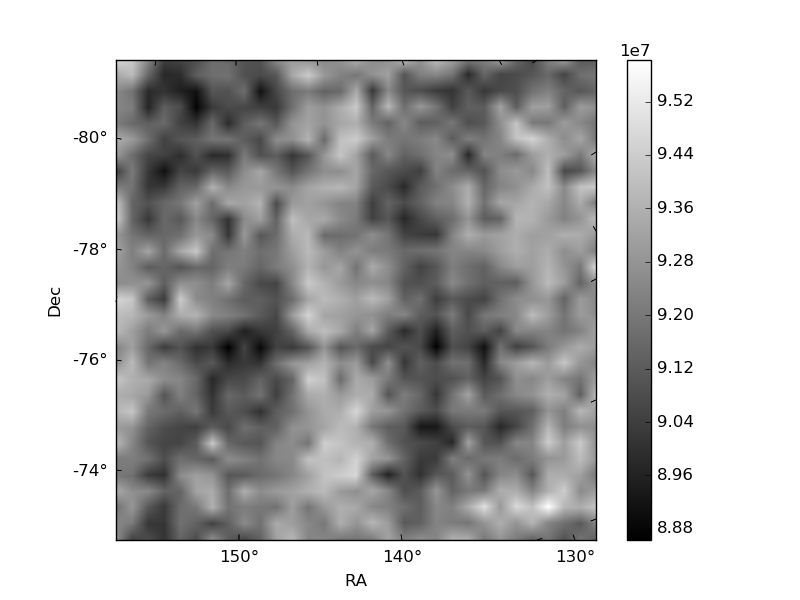
Histogram calculated using DETX and DETY for each event in the final _common_clean file
| Quadrant A | 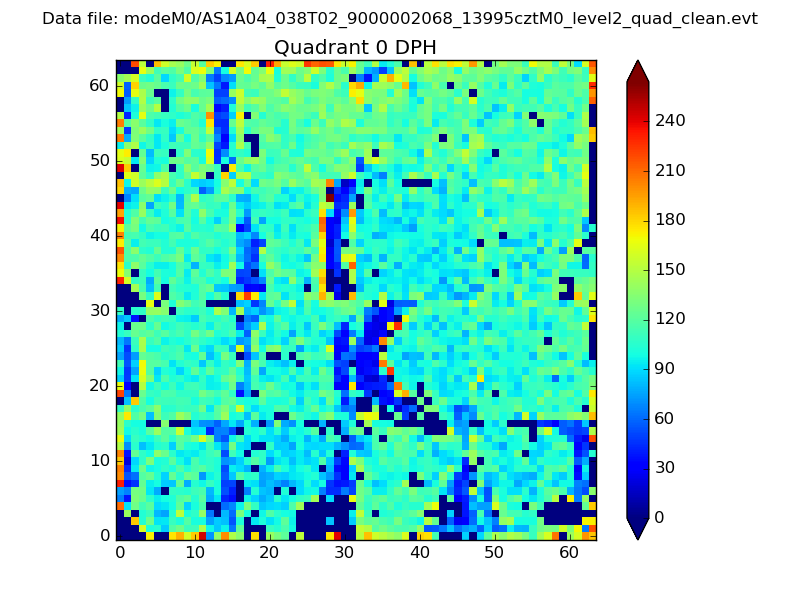 |
 |
Quadrant B |
|---|---|---|---|
| Quadrant D | 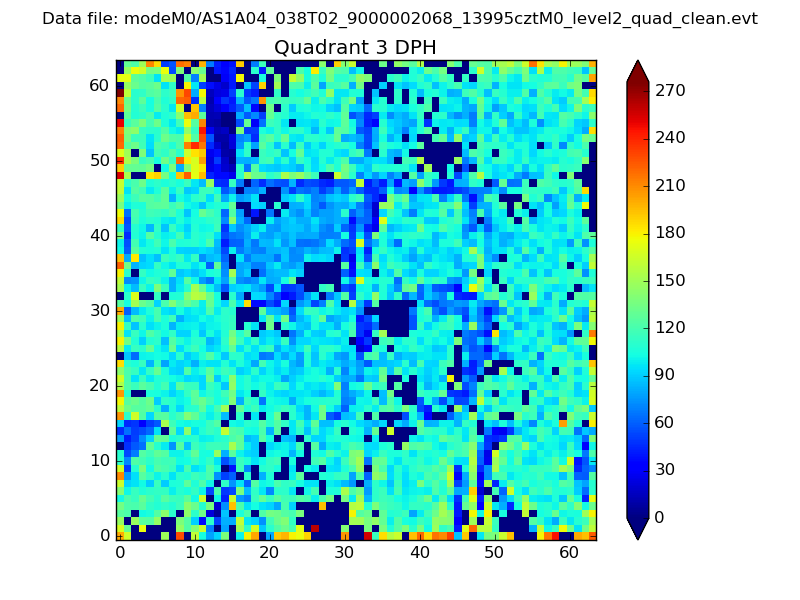 |
 |
Quadrant C |
| Plot type | Count rate plots | Images |
|---|---|---|
| Comparison with Poisson distribution Blue bars denote a histogram of data divided into 1 sec bins. Red curve is a Poisson curve with rate = median count rate of data. |
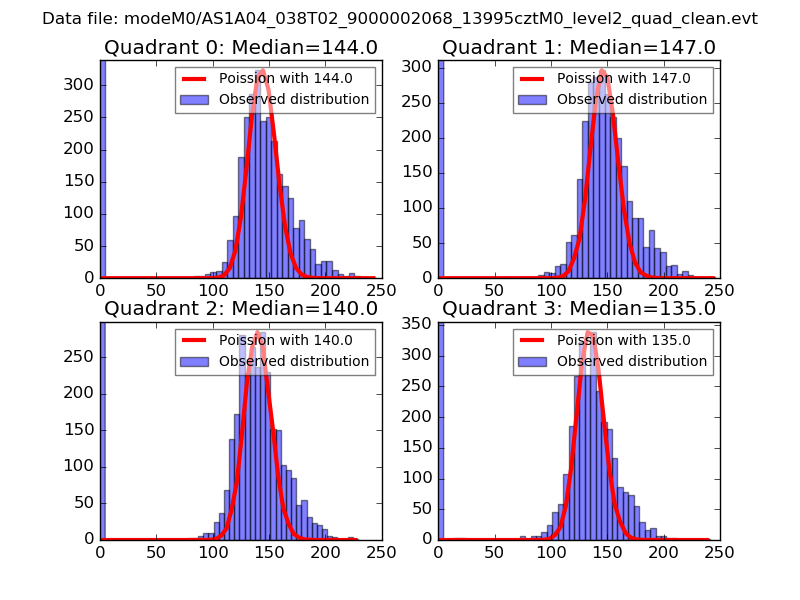 |
 |
| Quadrant-wise count rates Data is divided into 100 sec bins |
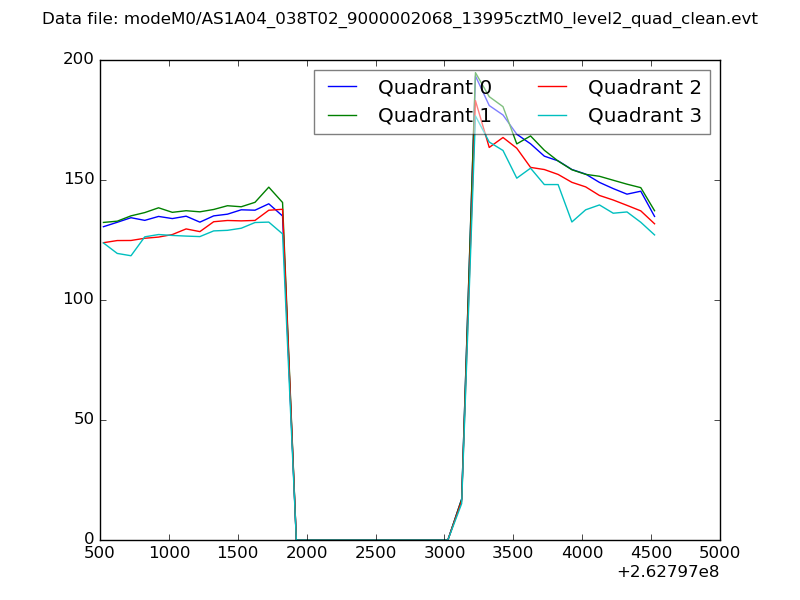 |
|
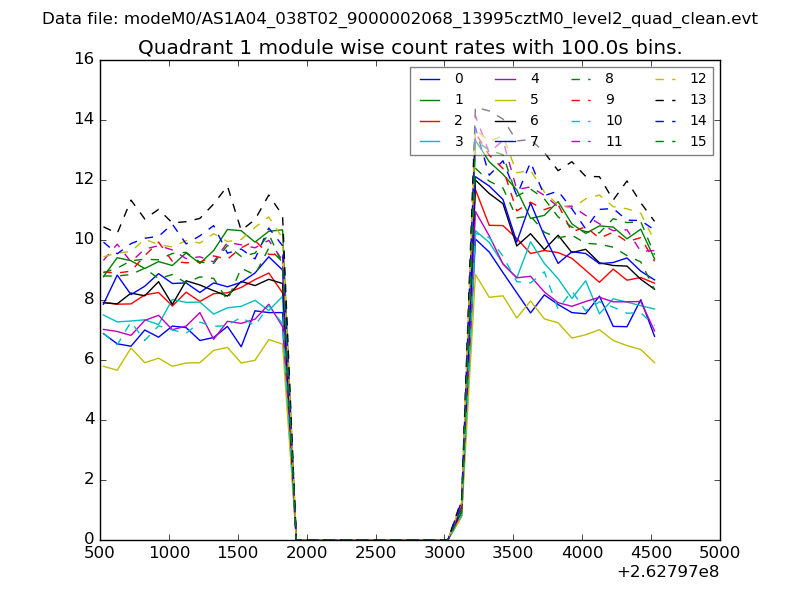
| Module-wise count rates for Quadrant A Data is divided into 100 sec bins |
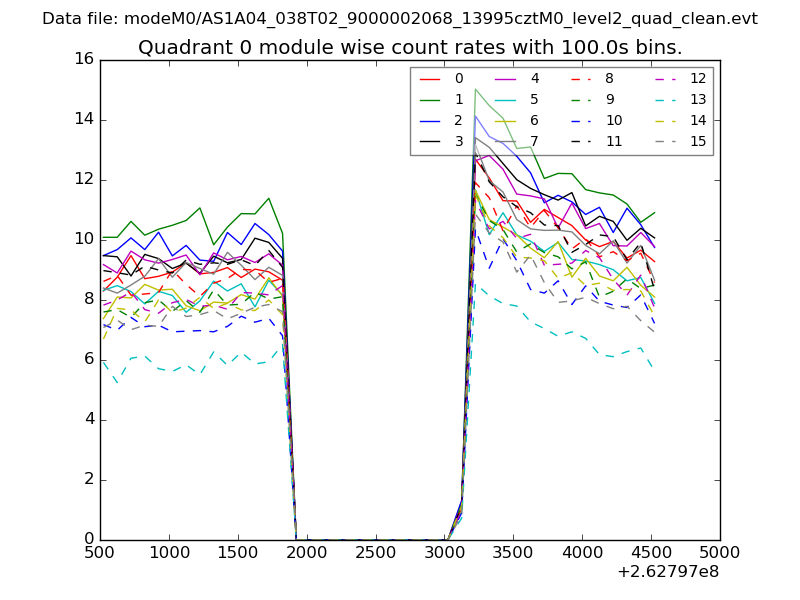 |
 |
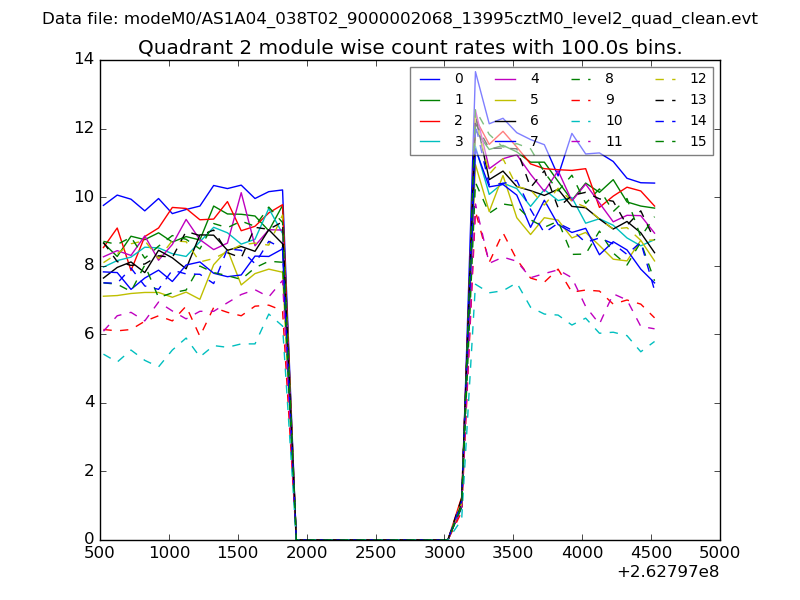
| Module-wise count rates for Quadrant B Data is divided into 100 sec bins |
 |
 |
| Module-wise count rates for Quadrant C Data is divided into 100 sec bins |
 |
 |
| Module-wise count rates for Quadrant D Data is divided into 100 sec bins |
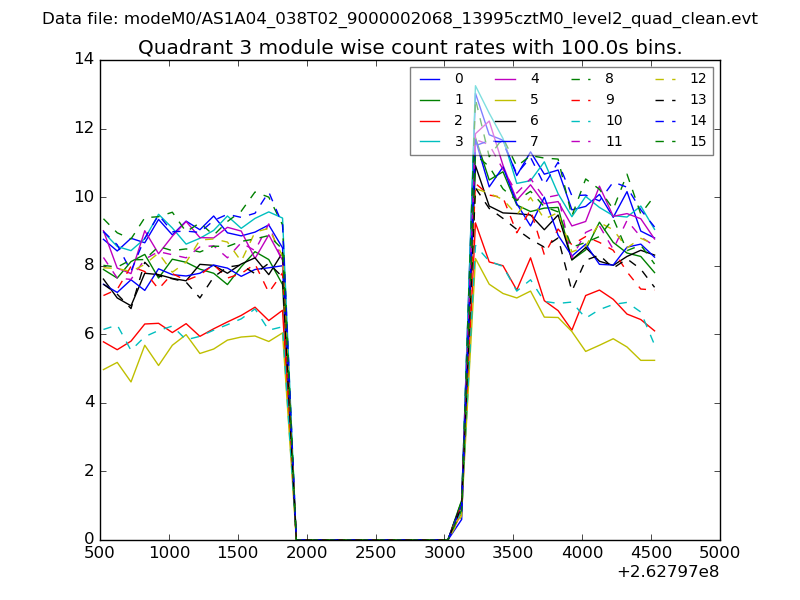 |
 |
| Parameter | Plot |
|---|---|
| CZT HV Monitor | 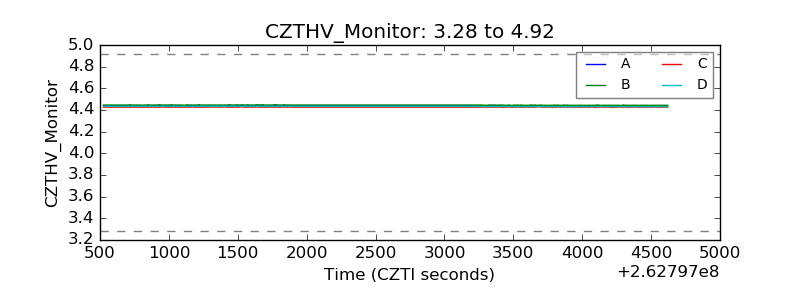 |
| D_VDD | 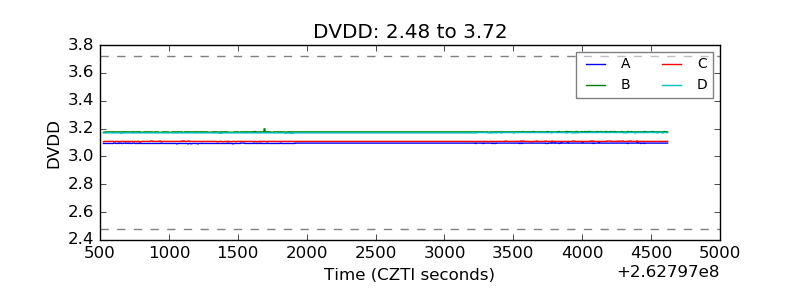 |
| Temperature 1 | 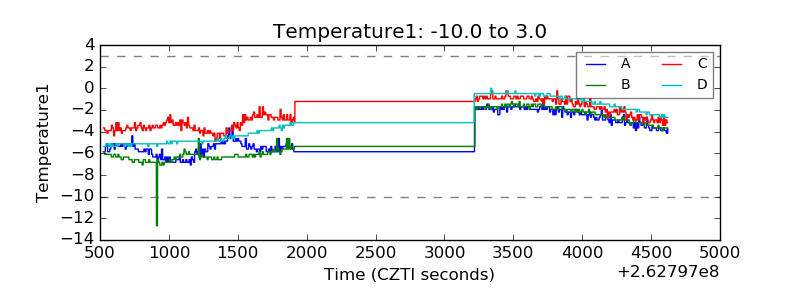 |
| Veto HV Monitor | 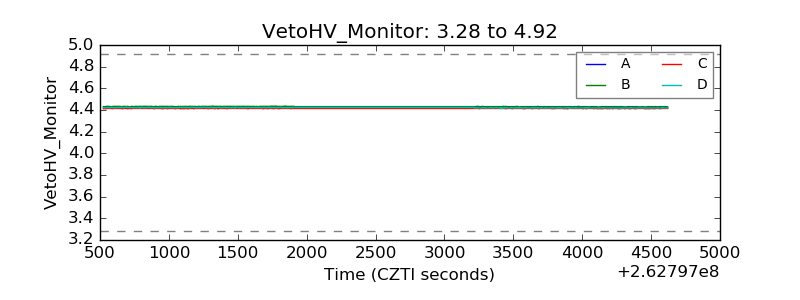 |
| Veto LLD | 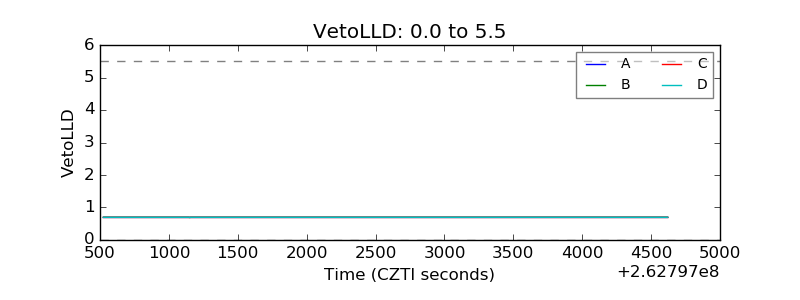 |
| Alpha Counter | 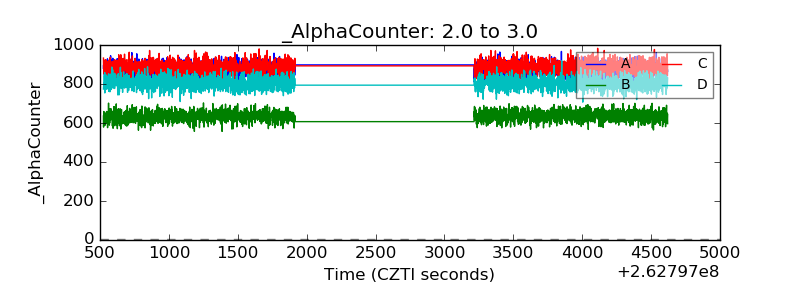 |
| _CPM_Rate | 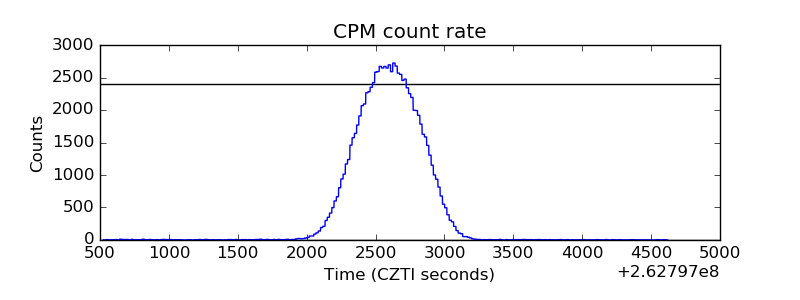 |
| CZT Counter | 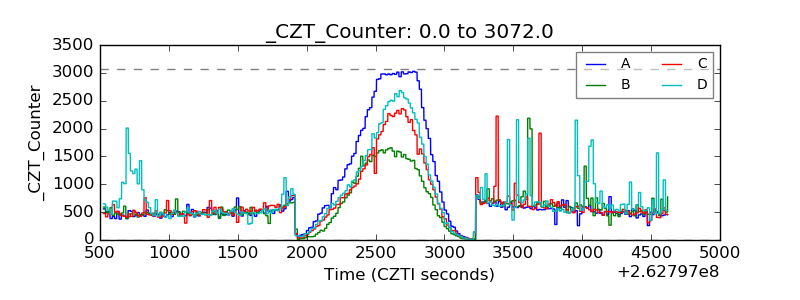 |
| +2.5 Volts monitor |  |
| +5 Volts monitor |  |
| _ROLL_ROT | 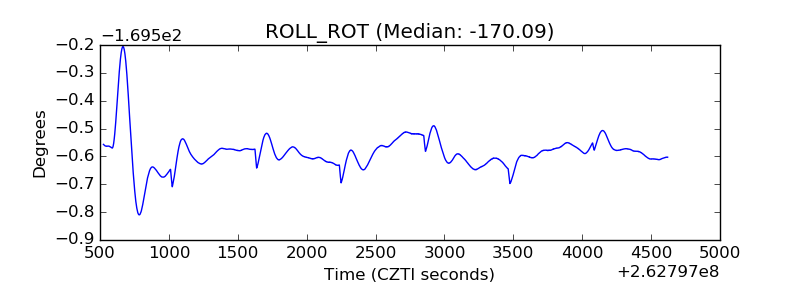 |
| _Roll_DEC | 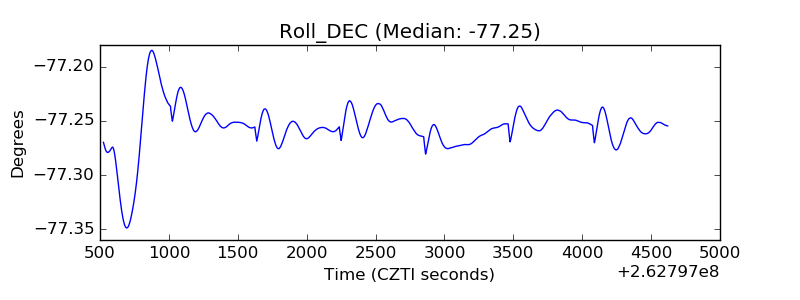 |
| _Roll_RA | 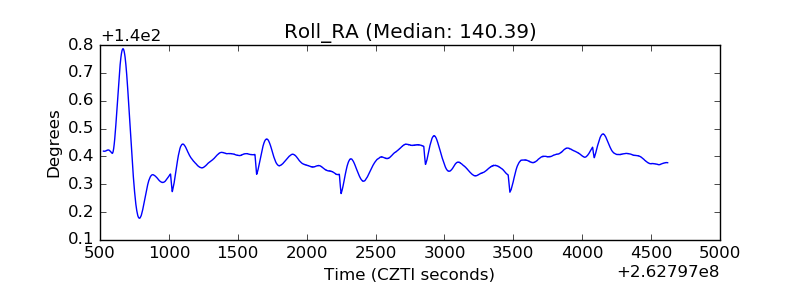 |
| Veto Counter | 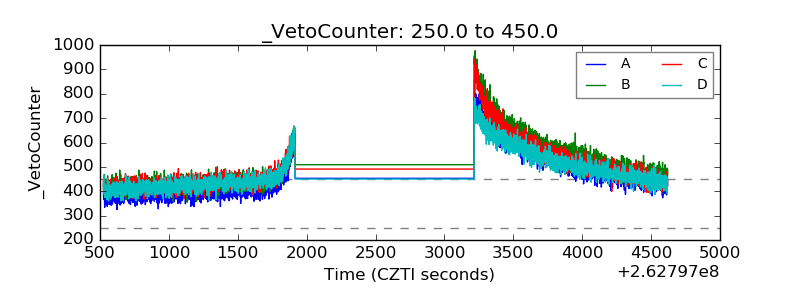 |