| Param | Original file | Final file |
|---|---|---|
| Filename | modeM0/AS1A04_038T02_9000002068_13998cztM0_level2.evt | modeM0/AS1A04_038T02_9000002068_13998cztM0_level2_quad_clean.evt |
| Size (bytes) | 480,882,240 | 122,875,200 |
| Size | 458.6 MB | 117.2 MB |
| Events in quadrant A | 2,998,163 | 841,801 |
| Events in quadrant B | 3,324,165 | 853,750 |
| Events in quadrant C | 3,089,037 | 816,816 |
| Events in quadrant D | 4,723,805 | 768,919 |
| Mode SS | |||
|---|---|---|---|
| Quadrant | BADHDUFLAG | Total packets | Discarded packets |
| A | 0 | 126 | 0 |
| B | 0 | 126 | 0 |
| C | 0 | 126 | 0 |
| D | 0 | 126 | 0 |
| Mode M9 | |||
|---|---|---|---|
| Quadrant | BADHDUFLAG | Total packets | Discarded packets |
| A | 0 | 19 | 0 |
| B | 0 | 19 | 0 |
| C | 0 | 19 | 0 |
| D | 0 | 20 | 0 |
| Mode M0 | |||
|---|---|---|---|
| Quadrant | BADHDUFLAG | Total packets | Discarded packets |
| A | 0 | 13243 | 3 |
| B | 0 | 14049 | 2 |
| C | 0 | 13414 | 2 |
| D | 0 | 18288 | 2 |
| Quadrant | Total seconds | Saturated seconds | Saturation percentage |
|---|---|---|---|
| A | 6318 | 41 | 0.648940% |
| B | 6318 | 65 | 1.028807% |
| C | 6318 | 13 | 0.205761% |
| D | 6318 | 436 | 6.900918% |
Noise dominated data is calculated using 1-second bins in cleaned event files. If a bin has >2000 counts, and if more than 50% of those come from <1% of pixels, then it is considered to be noise-dominated and hence unusable.
| Quadrant | # 1 sec bins | Bins with >0 counts | Bins with >2000 counts | High rate bins dominated by noise | Noise dominated (total time) | Noise dominated (detector-on time) | Marked lightcurve |
|---|---|---|---|---|---|---|---|
| A | 7494 | 6320 | 1 | 1 | 0.01% | 0.02% |  |
| B | 7494 | 6320 | 12 | 12 | 0.16% | 0.19% | 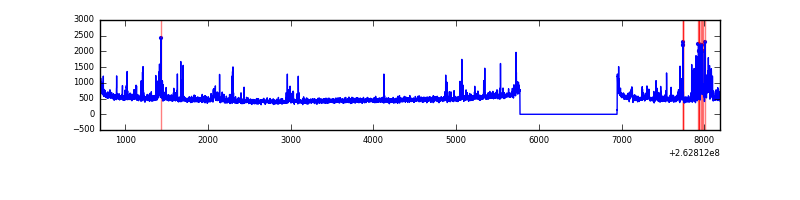 |
| C | 7494 | 6320 | 5 | 5 | 0.07% | 0.08% | 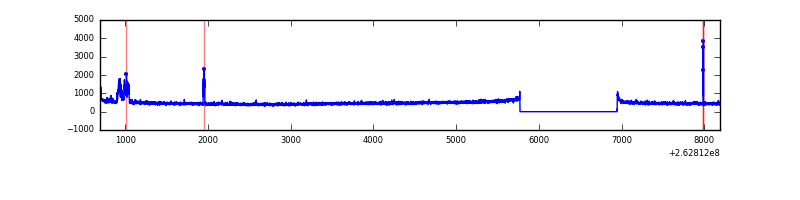 |
| D | 7494 | 6320 | 454 | 454 | 6.06% | 7.18% | 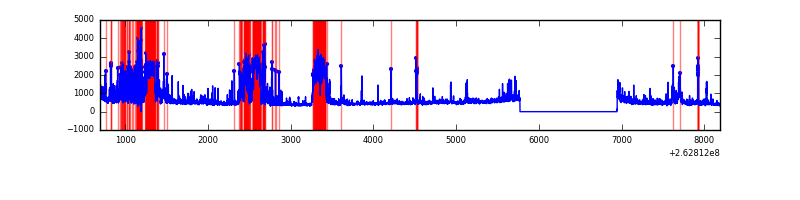 |
Top three noisy pixels from each quadrant. If the there are fewer than three noisy pixels in the level2.evt file, extra rows are filled as -1
| Pixel properties | Quadrant properties | ||||||
|---|---|---|---|---|---|---|---|
| Quadrant | DetID | PixID | Counts | Sigma | Mean | Median | Sigma |
| A | 14 | 111 | 68342 | 444.51 | 750 | 735 | 152.1 |
| A | 12 | 189 | 21934 | 139.38 | 750 | 735 | 152.1 |
| A | 1 | 162 | 12534 | 77.58 | 750 | 735 | 152.1 |
| B | 0 | 219 | 194172 | 1383.69 | 752 | 736 | 139.8 |
| B | 0 | 189 | 91692 | 650.63 | 752 | 736 | 139.8 |
| B | 3 | 64 | 31255 | 218.31 | 752 | 736 | 139.8 |
| C | 3 | 233 | 160642 | 963.8 | 719 | 722 | 165.9 |
| C | 14 | 220 | 107341 | 642.57 | 719 | 722 | 165.9 |
| C | 14 | 234 | 11808 | 66.81 | 719 | 722 | 165.9 |
| D | 13 | 104 | 755503 | 4320.43 | 698 | 678 | 174.7 |
| D | 7 | 80 | 578639 | 3308.11 | 698 | 678 | 174.7 |
| D | 10 | 157 | 288464 | 1647.22 | 698 | 678 | 174.7 |
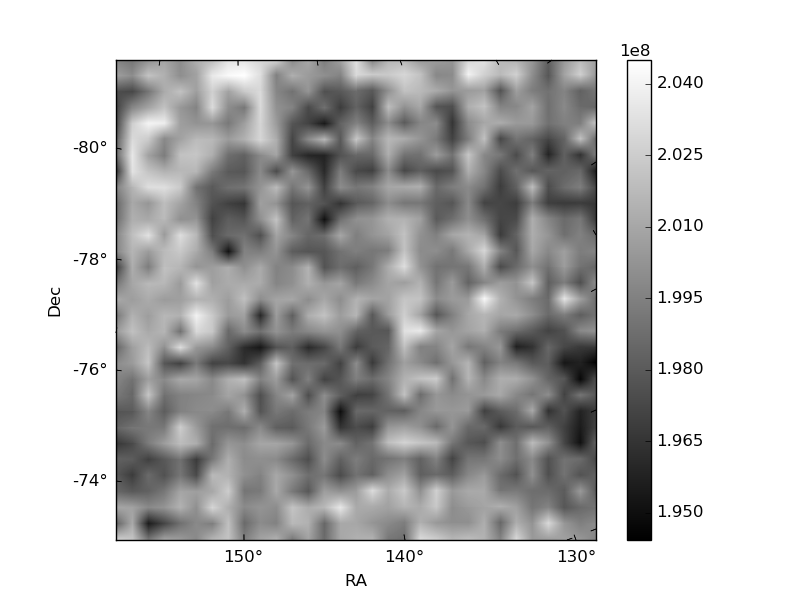
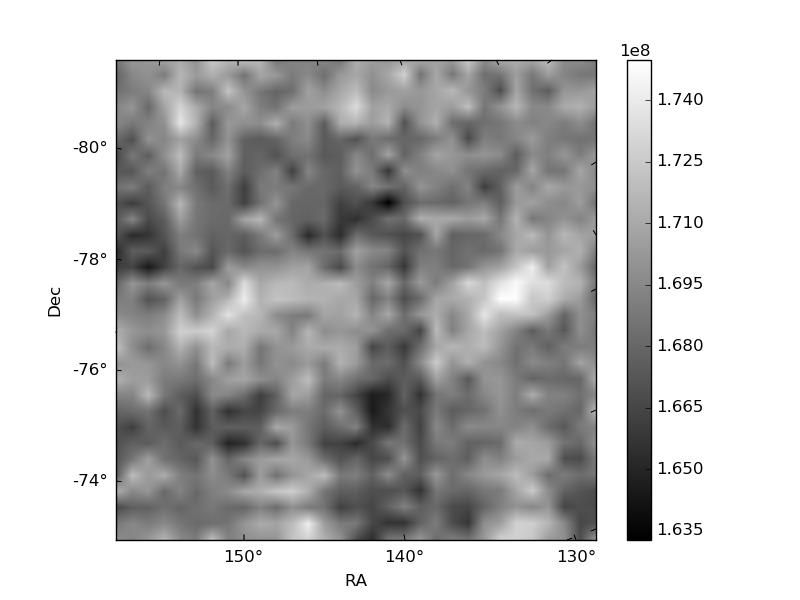
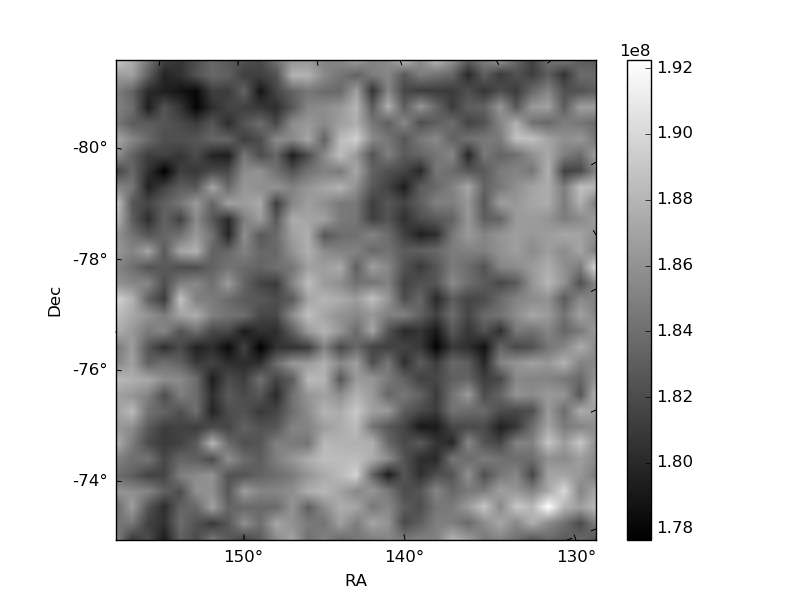
Histogram calculated using DETX and DETY for each event in the final _common_clean file
| Quadrant A | 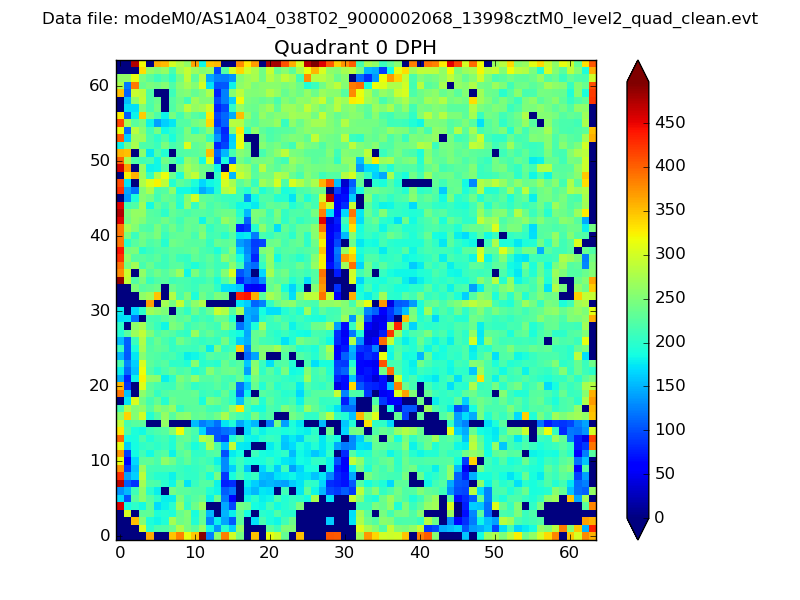 |
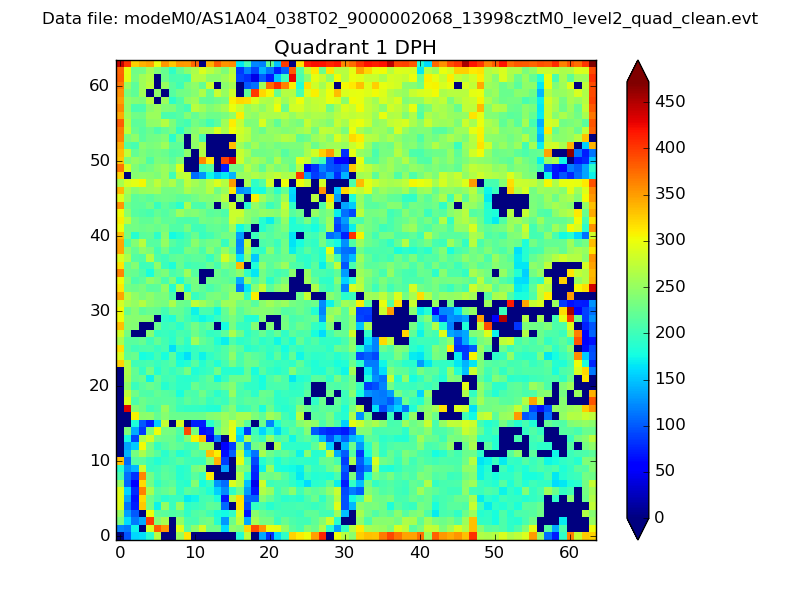 |
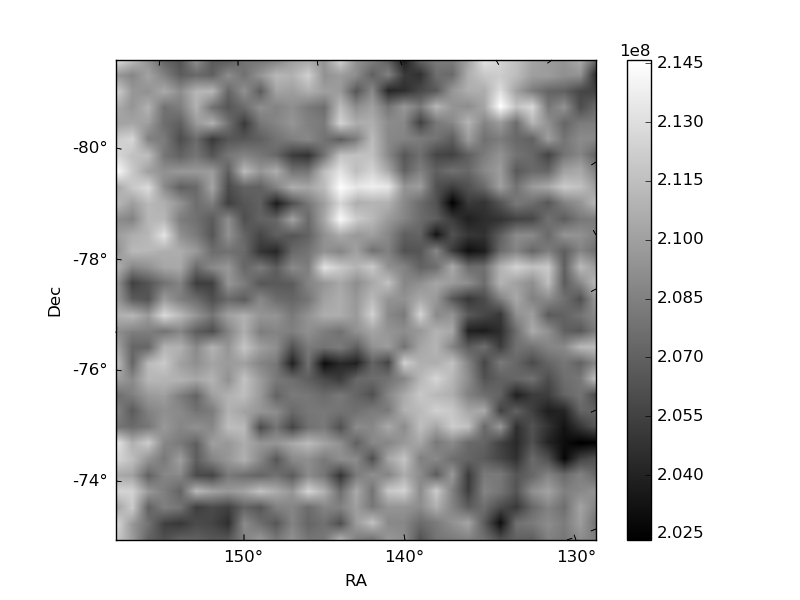
Quadrant B |
|---|---|---|---|
| Quadrant D | 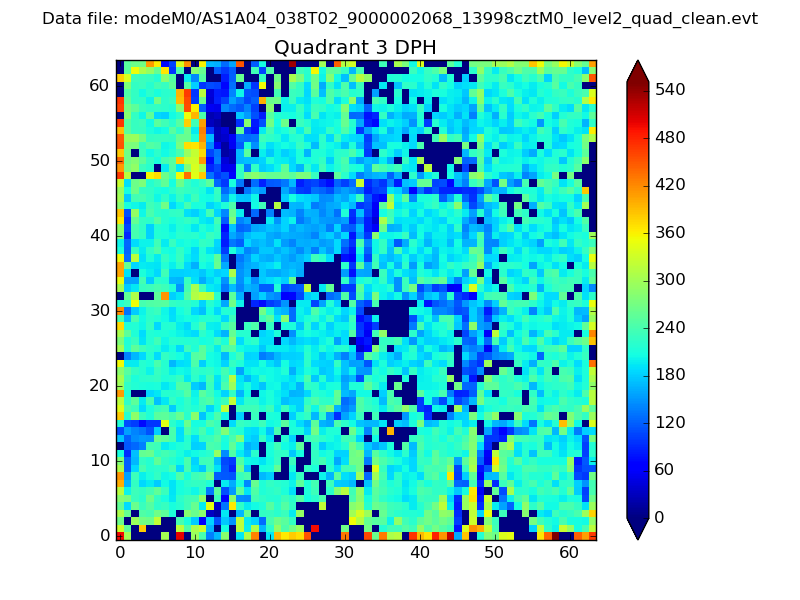 |
 |
Quadrant C |
| Plot type | Count rate plots | Images |
|---|---|---|
| Comparison with Poisson distribution Blue bars denote a histogram of data divided into 1 sec bins. Red curve is a Poisson curve with rate = median count rate of data. |
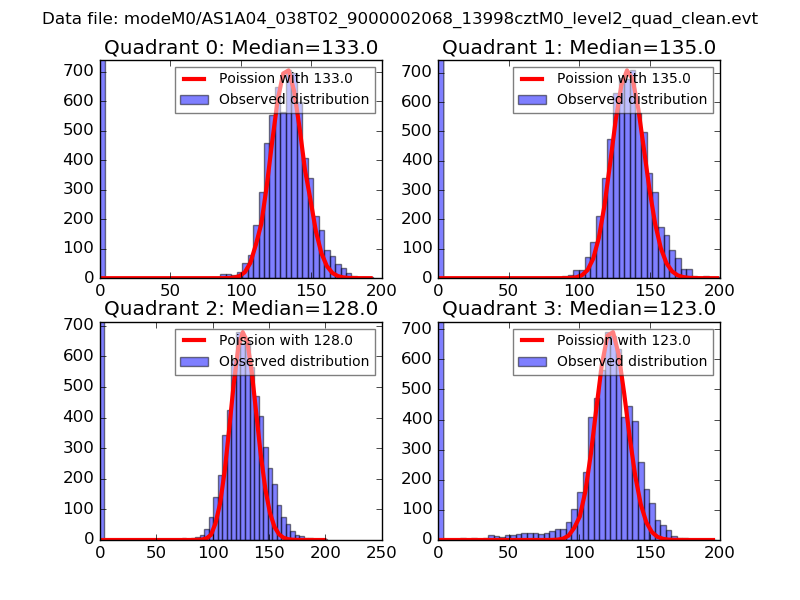 |
 |
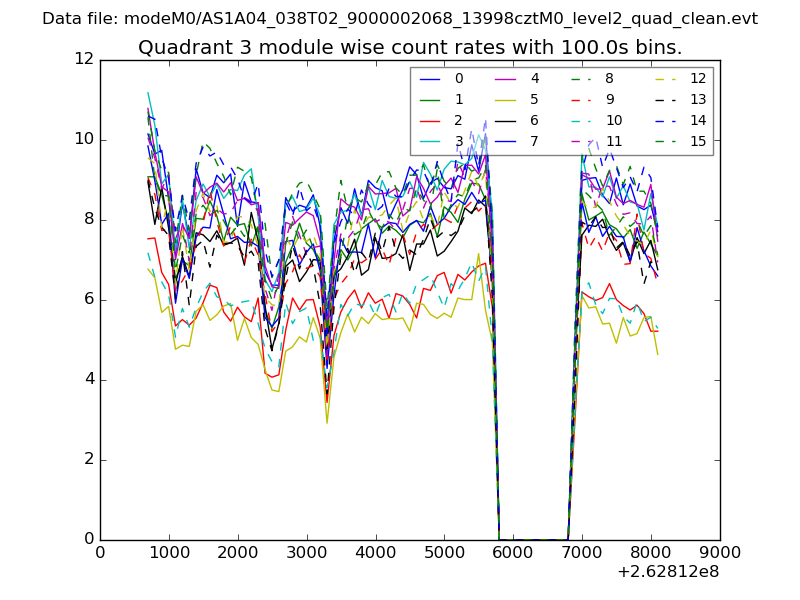
| Quadrant-wise count rates Data is divided into 100 sec bins |
 |
|
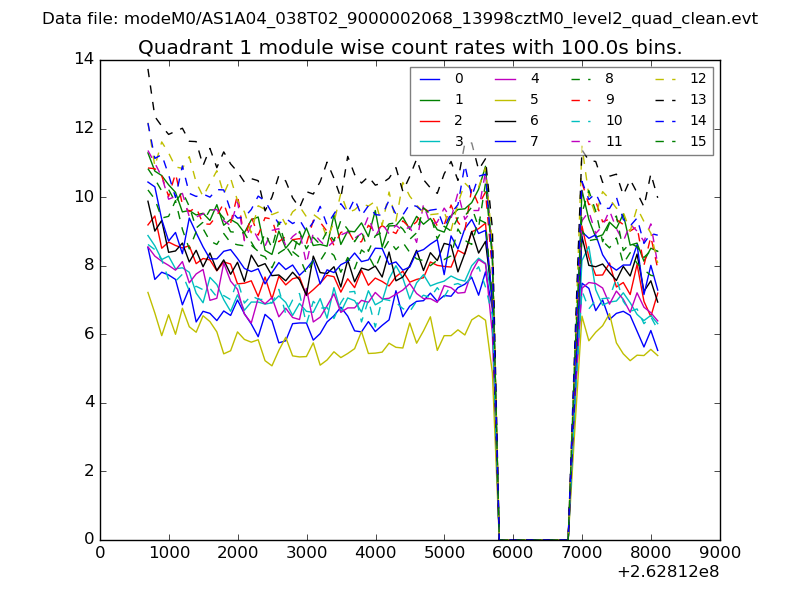
| Module-wise count rates for Quadrant A Data is divided into 100 sec bins |
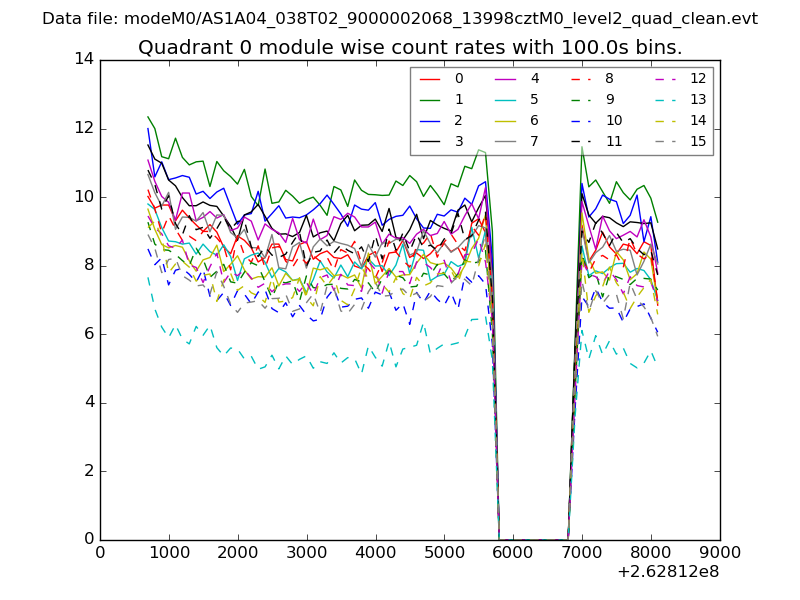 |
 |
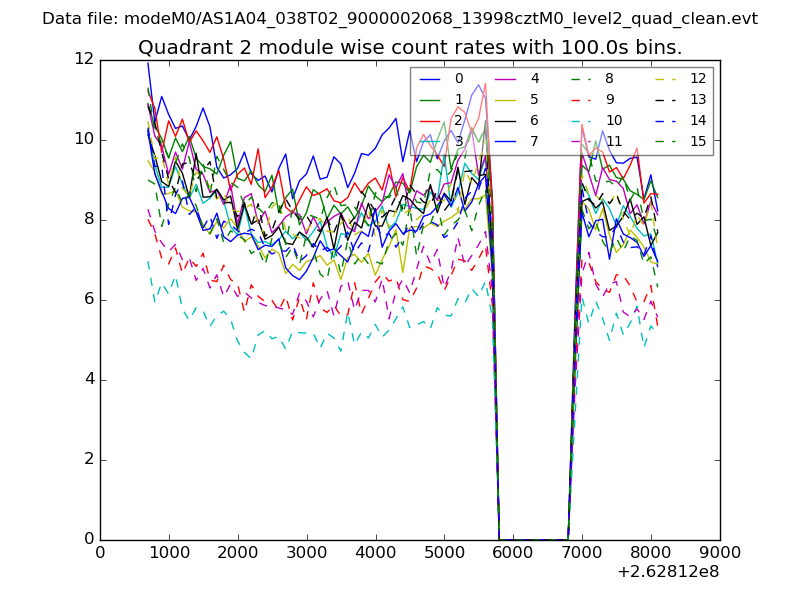
| Module-wise count rates for Quadrant B Data is divided into 100 sec bins |
 |
 |
| Module-wise count rates for Quadrant C Data is divided into 100 sec bins |
 |
 |
| Module-wise count rates for Quadrant D Data is divided into 100 sec bins |
 |
 |
| Parameter | Plot |
|---|---|
| CZT HV Monitor | 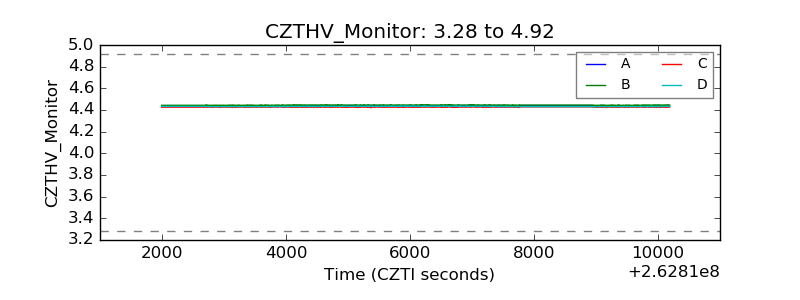 |
| D_VDD | 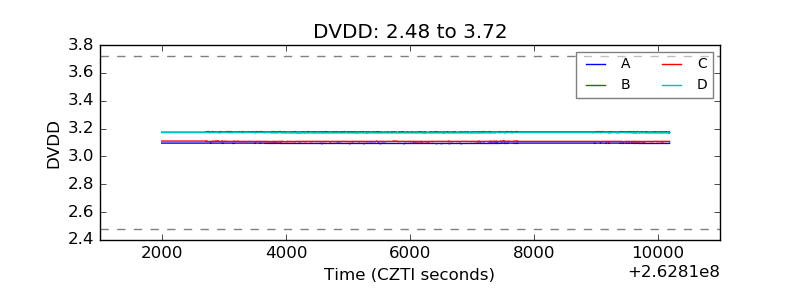 |
| Temperature 1 | 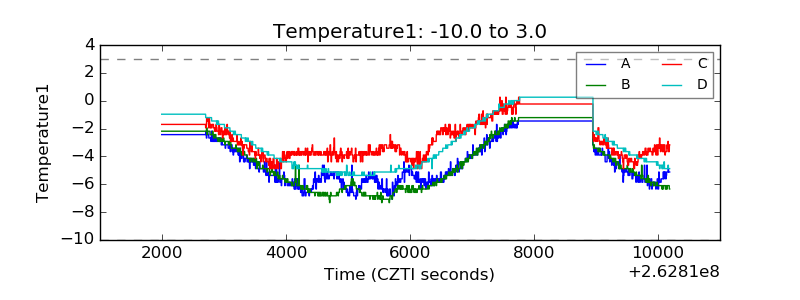 |
| Veto HV Monitor | 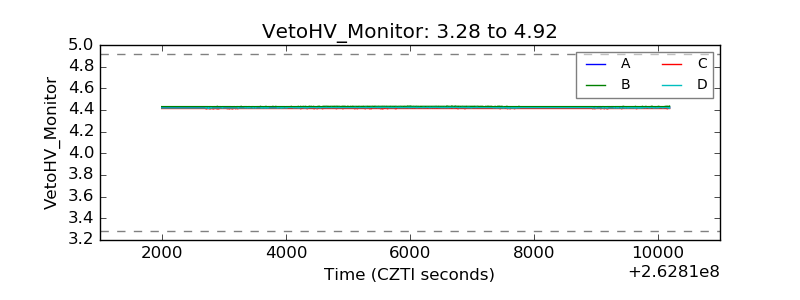 |
| Veto LLD | 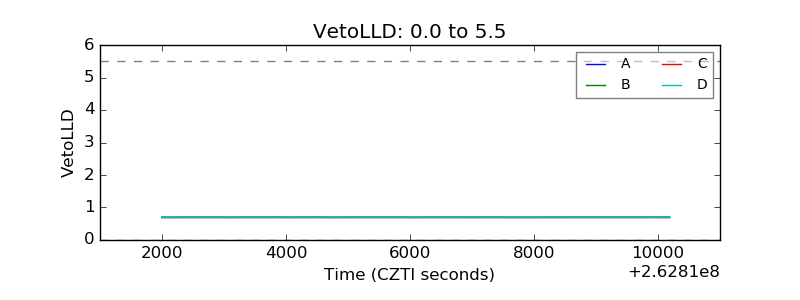 |
| Alpha Counter | 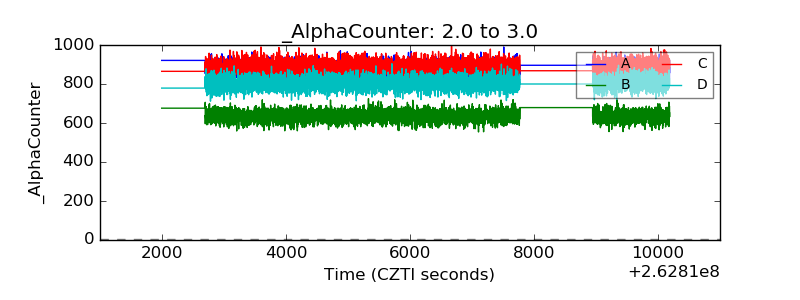 |
| _CPM_Rate | 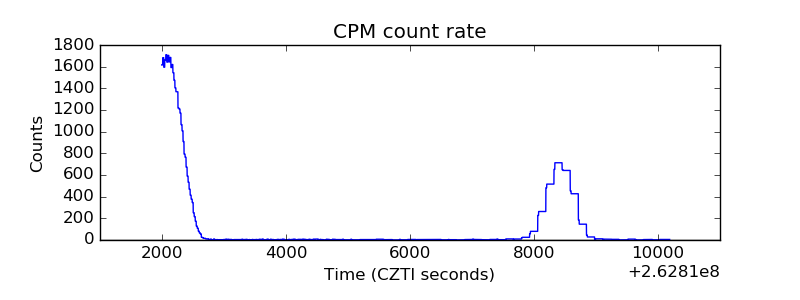 |
| CZT Counter | 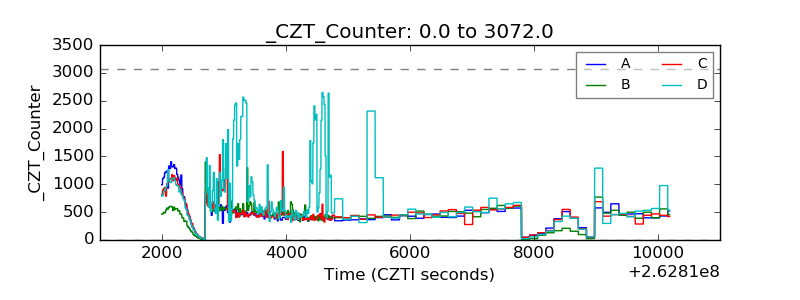 |
| +2.5 Volts monitor |  |
| +5 Volts monitor | 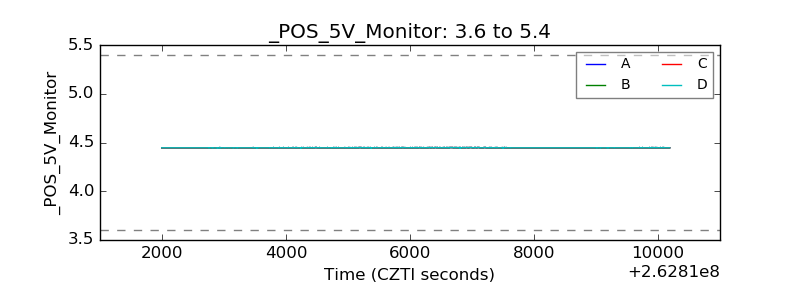 |
| _ROLL_ROT | 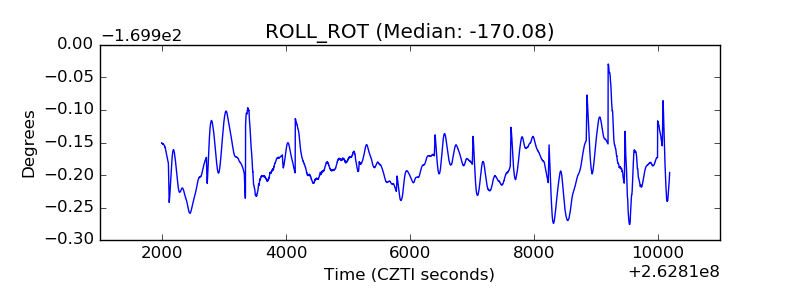 |
| _Roll_DEC | 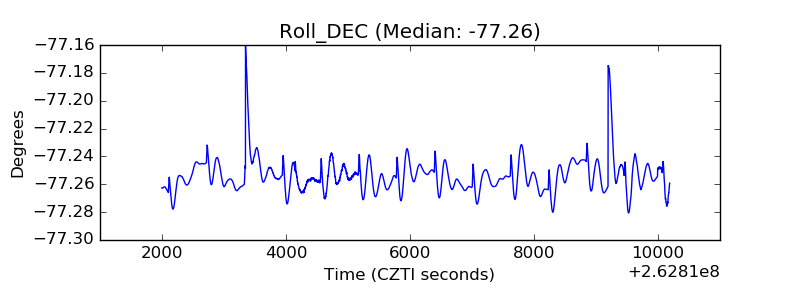 |
| _Roll_RA |  |
| Veto Counter | 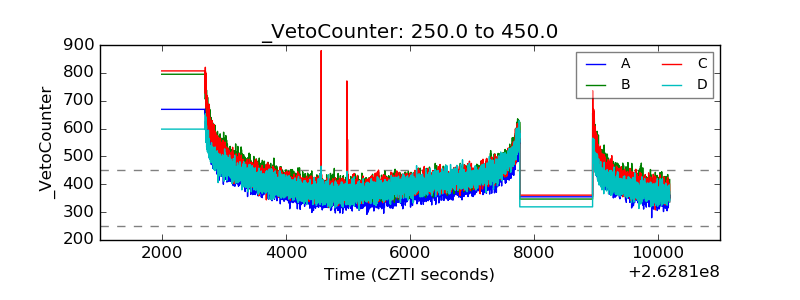 |