| Param | Original file | Final file |
|---|---|---|
| Filename | modeM0/AS1A04_038T02_9000002068_13999cztM0_level2.evt | modeM0/AS1A04_038T02_9000002068_13999cztM0_level2_quad_clean.evt |
| Size (bytes) | 474,863,040 | 128,099,520 |
| Size | 452.9 MB | 122.2 MB |
| Events in quadrant A | 3,172,773 | 867,325 |
| Events in quadrant B | 3,582,453 | 874,813 |
| Events in quadrant C | 3,132,378 | 846,113 |
| Events in quadrant D | 4,028,281 | 814,212 |
| Mode SS | |||
|---|---|---|---|
| Quadrant | BADHDUFLAG | Total packets | Discarded packets |
| A | 0 | 140 | 0 |
| B | 0 | 140 | 0 |
| C | 0 | 140 | 0 |
| D | 0 | 140 | 0 |
| Mode M9 | |||
|---|---|---|---|
| Quadrant | BADHDUFLAG | Total packets | Discarded packets |
| A | 0 | 14 | 0 |
| B | 0 | 14 | 0 |
| C | 0 | 14 | 0 |
| D | 0 | 15 | 0 |
| Mode M0 | |||
|---|---|---|---|
| Quadrant | BADHDUFLAG | Total packets | Discarded packets |
| A | 0 | 14180 | 3 |
| B | 0 | 15291 | 2 |
| C | 0 | 13925 | 2 |
| D | 0 | 16787 | 2 |
| Quadrant | Total seconds | Saturated seconds | Saturation percentage |
|---|---|---|---|
| A | 6848 | 69 | 1.007593% |
| B | 6848 | 95 | 1.387266% |
| C | 6848 | 20 | 0.292056% |
| D | 6848 | 160 | 2.336449% |
Noise dominated data is calculated using 1-second bins in cleaned event files. If a bin has >2000 counts, and if more than 50% of those come from <1% of pixels, then it is considered to be noise-dominated and hence unusable.
| Quadrant | # 1 sec bins | Bins with >0 counts | Bins with >2000 counts | High rate bins dominated by noise | Noise dominated (total time) | Noise dominated (detector-on time) | Marked lightcurve |
|---|---|---|---|---|---|---|---|
| A | 7669 | 6850 | 3 | 3 | 0.04% | 0.04% | 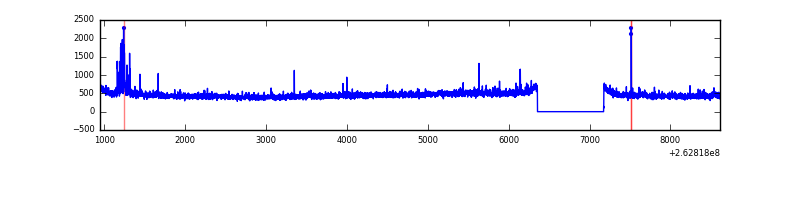 |
| B | 7669 | 6850 | 24 | 24 | 0.31% | 0.35% | 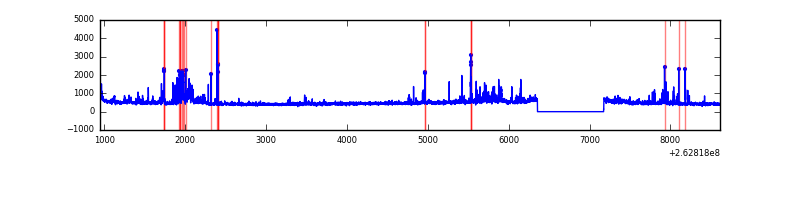 |
| C | 7669 | 6850 | 3 | 3 | 0.04% | 0.04% |  |
| D | 7669 | 6850 | 135 | 135 | 1.76% | 1.97% | 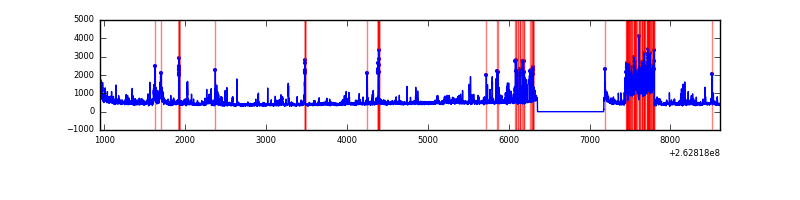 |
Top three noisy pixels from each quadrant. If the there are fewer than three noisy pixels in the level2.evt file, extra rows are filled as -1
| Pixel properties | Quadrant properties | ||||||
|---|---|---|---|---|---|---|---|
| Quadrant | DetID | PixID | Counts | Sigma | Mean | Median | Sigma |
| A | 14 | 111 | 75382 | 468.56 | 787 | 771 | 159.2 |
| A | 12 | 189 | 18214 | 109.54 | 787 | 771 | 159.2 |
| A | 1 | 162 | 16097 | 96.25 | 787 | 771 | 159.2 |
| B | 0 | 219 | 222906 | 1499.45 | 790 | 771 | 148.1 |
| B | 0 | 189 | 84144 | 562.78 | 790 | 771 | 148.1 |
| B | 3 | 64 | 73204 | 488.94 | 790 | 771 | 148.1 |
| C | 3 | 233 | 165267 | 951.89 | 757 | 761 | 172.8 |
| C | 14 | 234 | 11683 | 63.2 | 757 | 761 | 172.8 |
| C | 13 | 61 | 5558 | 27.76 | 757 | 761 | 172.8 |
| D | 1 | 52 | 457360 | 2407.4 | 747 | 725 | 189.7 |
| D | 10 | 157 | 291960 | 1535.41 | 747 | 725 | 189.7 |
| D | 13 | 189 | 183203 | 962.03 | 747 | 725 | 189.7 |
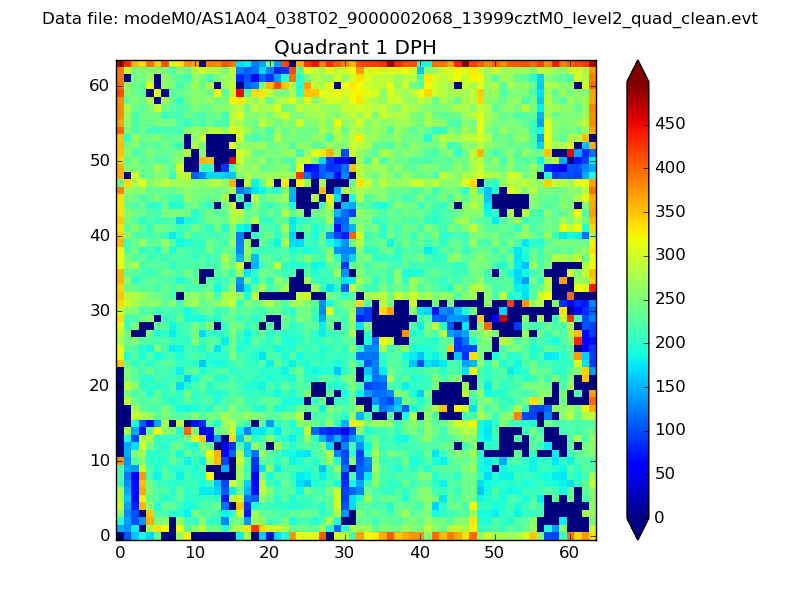
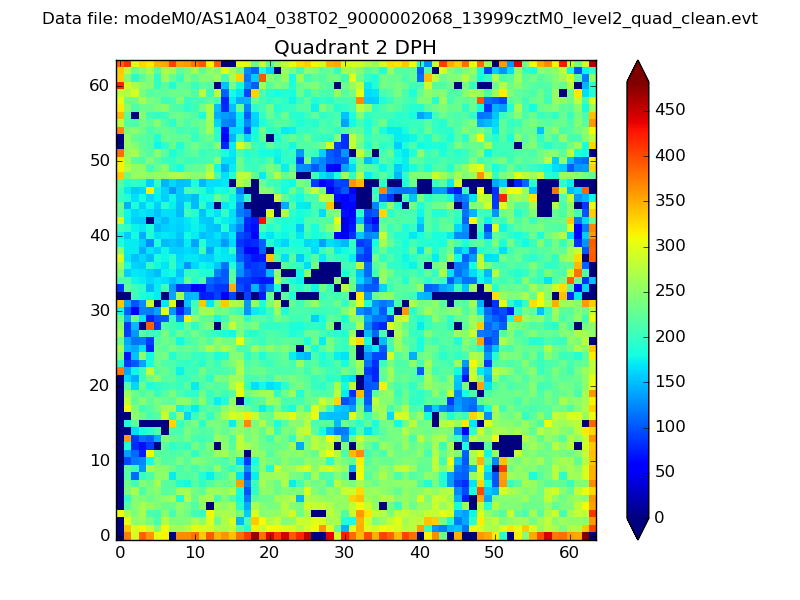
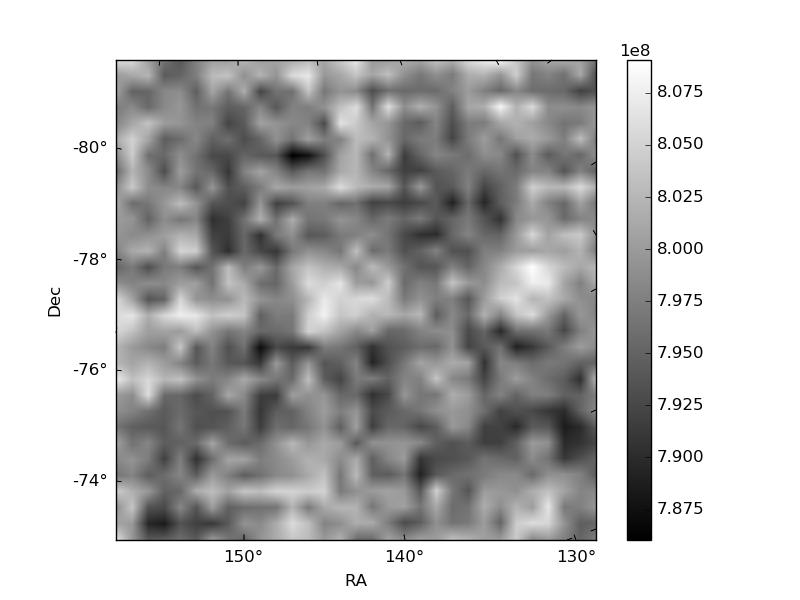
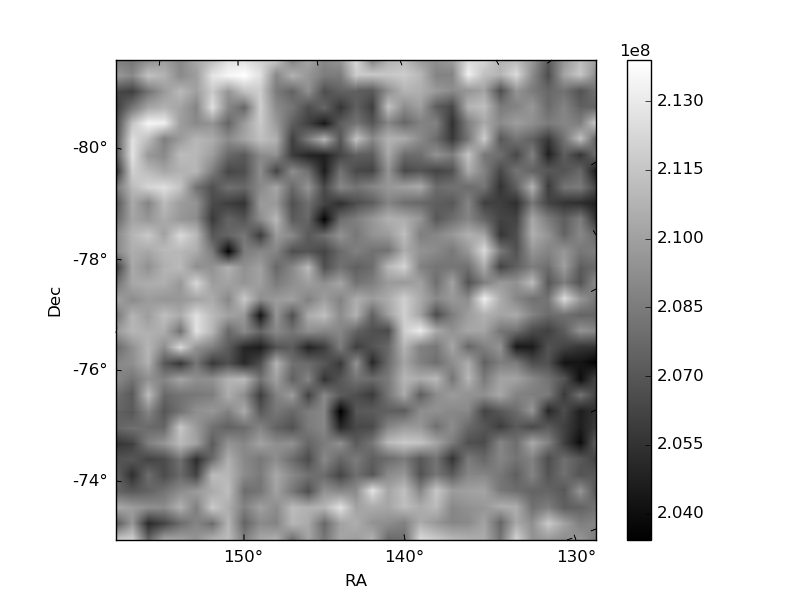
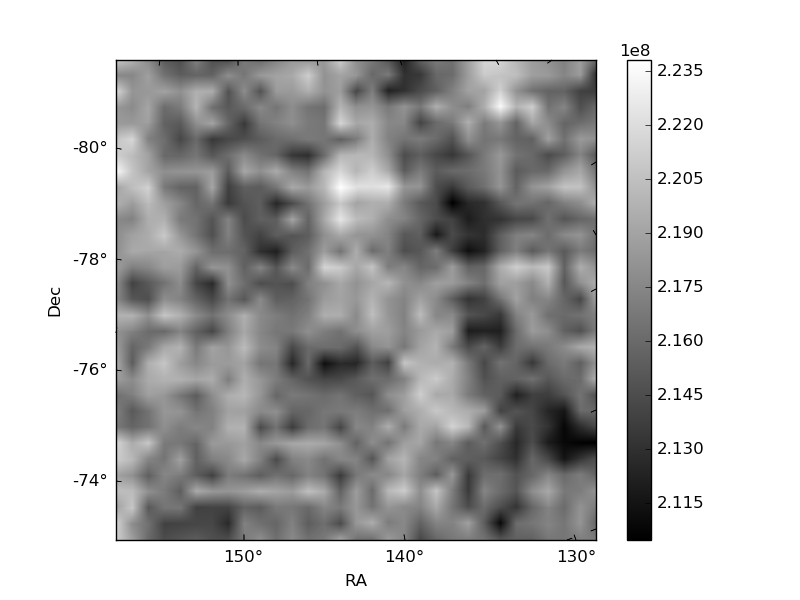
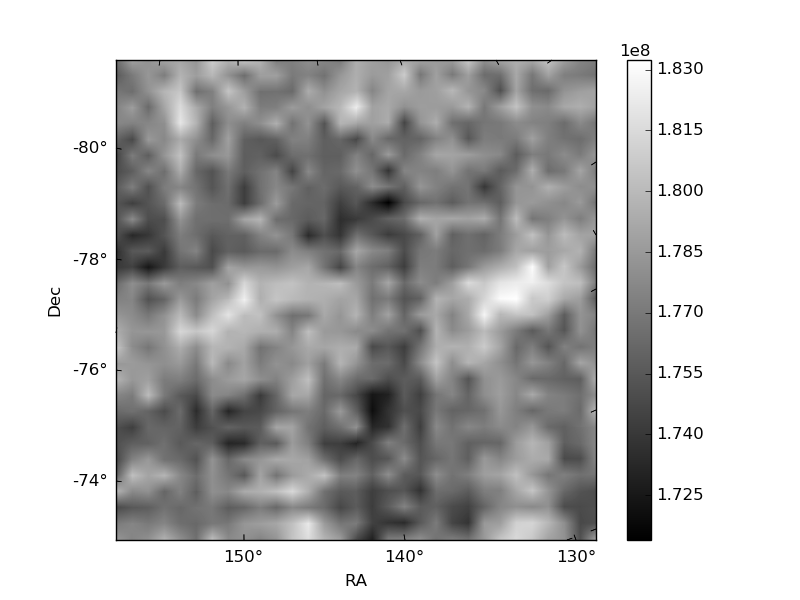
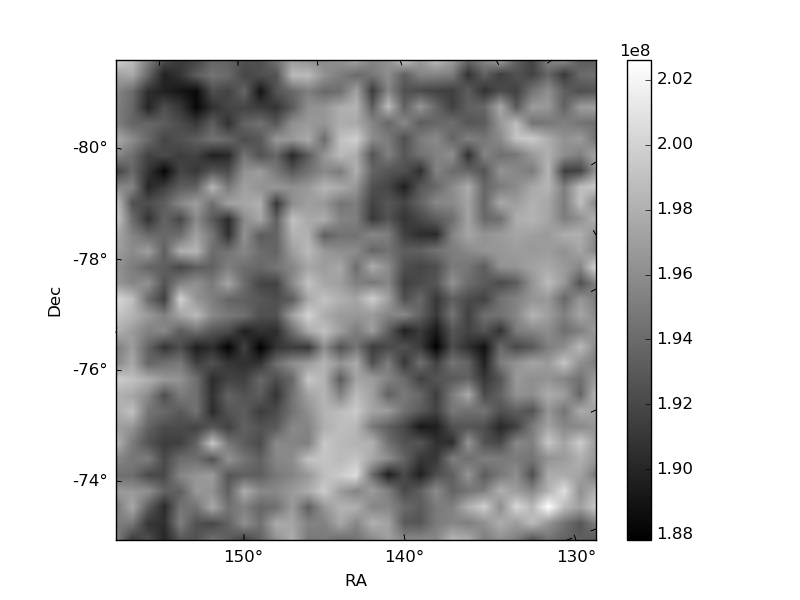
Histogram calculated using DETX and DETY for each event in the final _common_clean file
| Quadrant A | 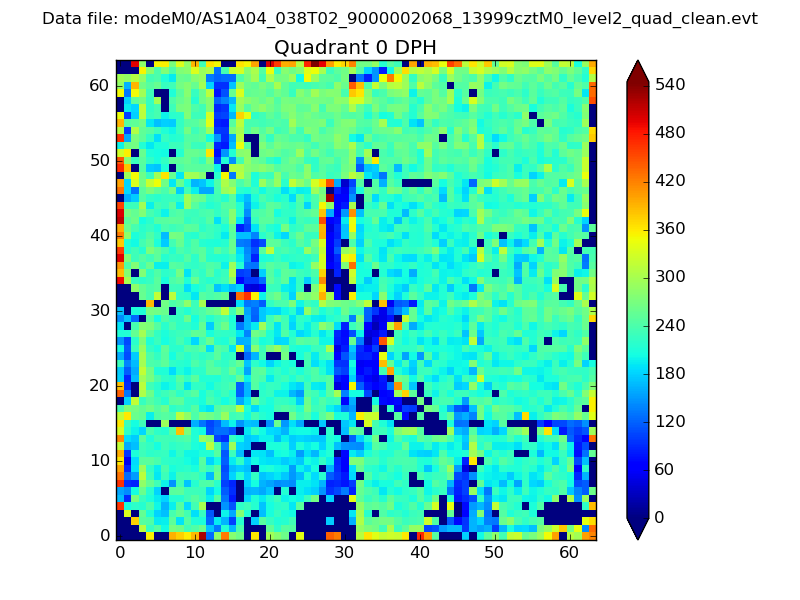 |
 |
Quadrant B |
|---|---|---|---|
| Quadrant D | 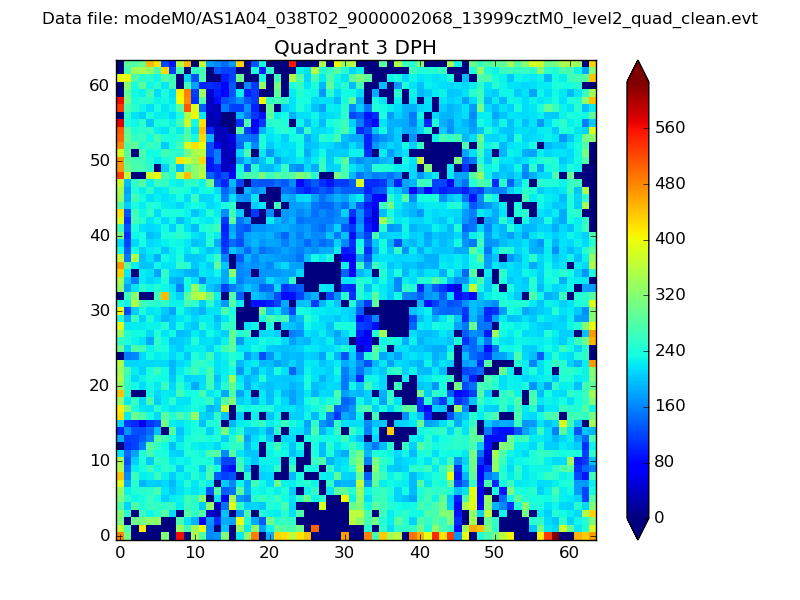 |
 |
Quadrant C |
| Plot type | Count rate plots | Images |
|---|---|---|
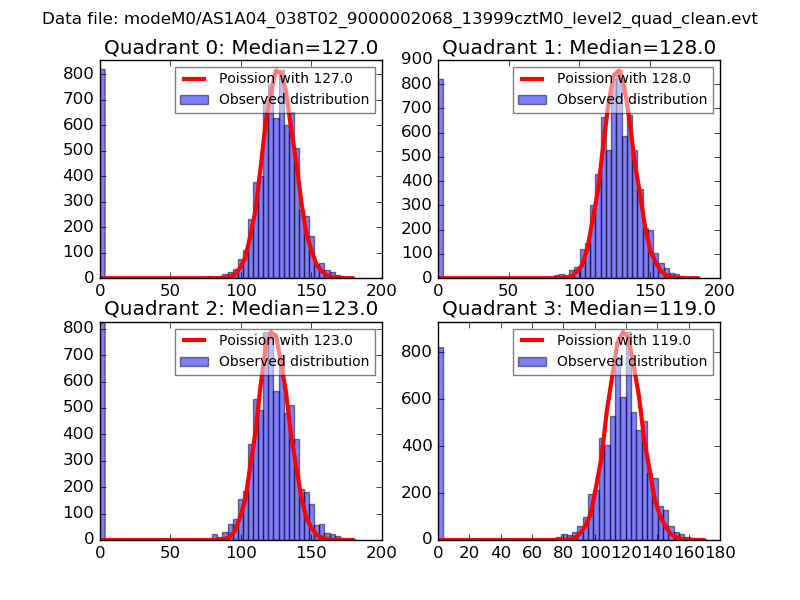
| Comparison with Poisson distribution Blue bars denote a histogram of data divided into 1 sec bins. Red curve is a Poisson curve with rate = median count rate of data. |
 |
 |
| Quadrant-wise count rates Data is divided into 100 sec bins |
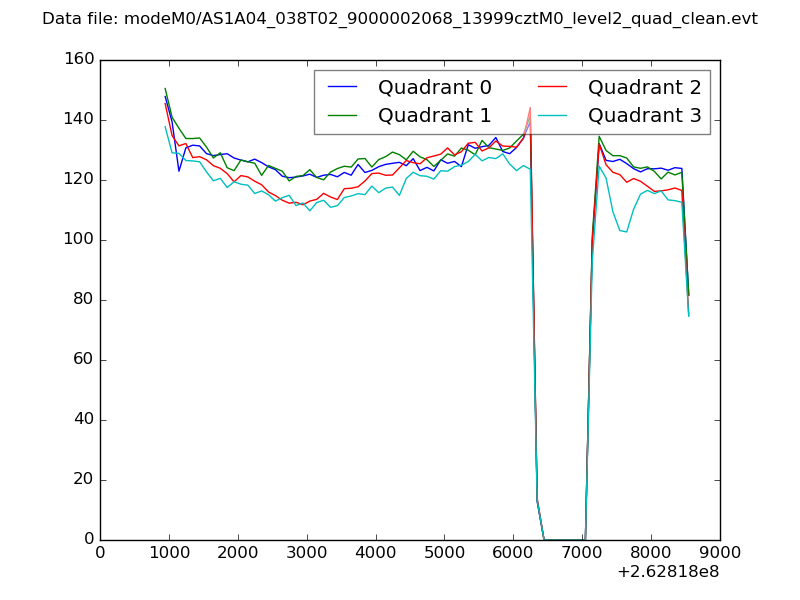 |
|
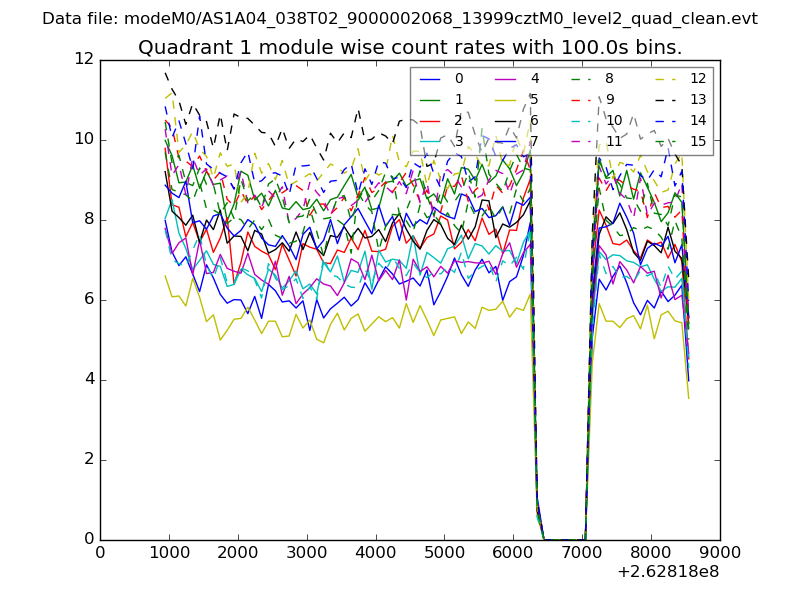
| Module-wise count rates for Quadrant A Data is divided into 100 sec bins |
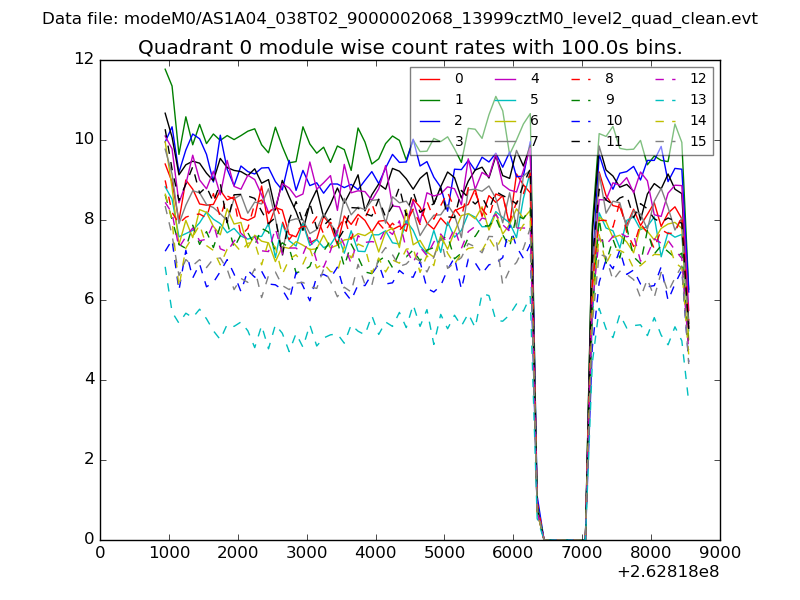 |
 |
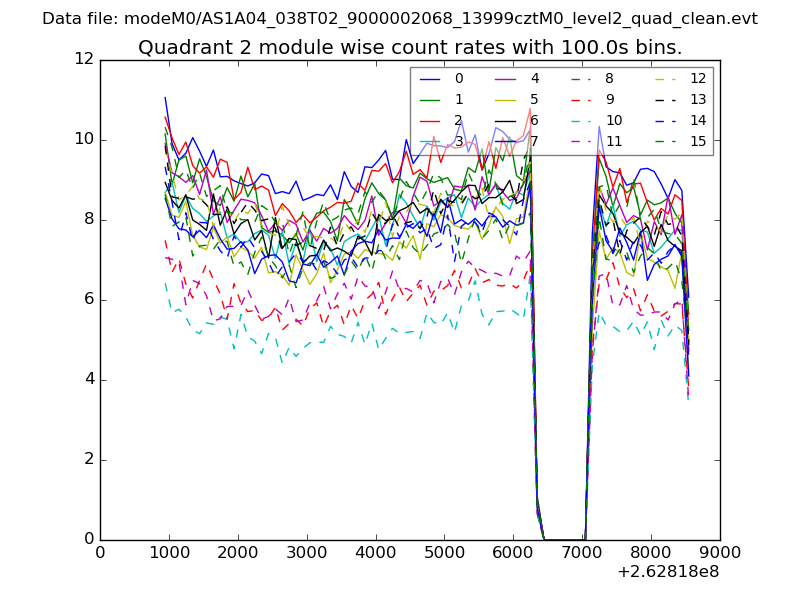
| Module-wise count rates for Quadrant B Data is divided into 100 sec bins |
 |
 |
| Module-wise count rates for Quadrant C Data is divided into 100 sec bins |
 |
 |
| Module-wise count rates for Quadrant D Data is divided into 100 sec bins |
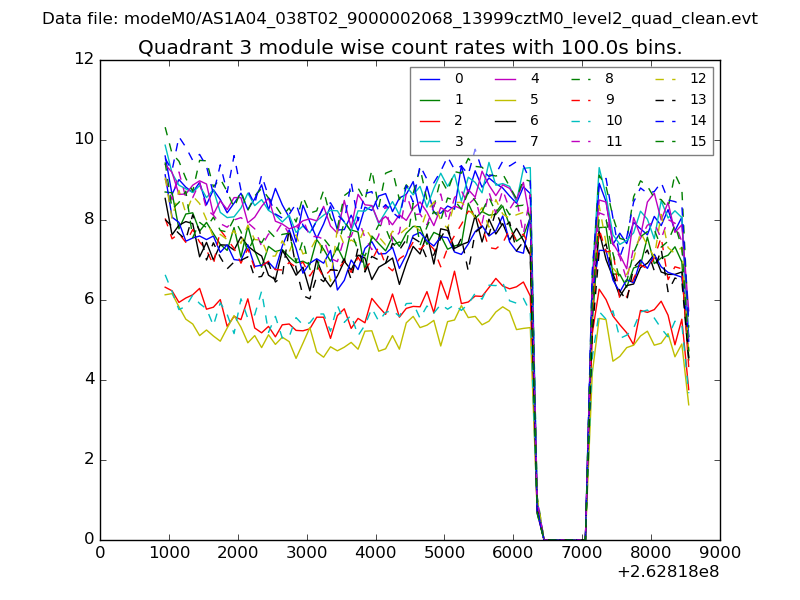 |
 |
| Parameter | Plot |
|---|---|
| CZT HV Monitor | 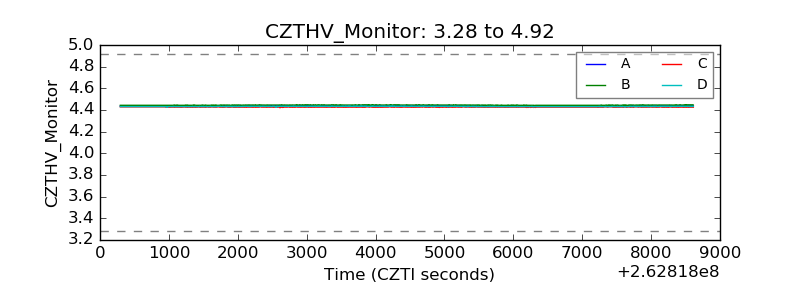 |
| D_VDD | 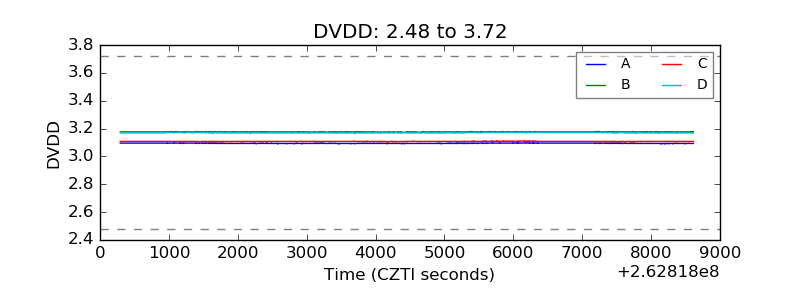 |
| Temperature 1 | 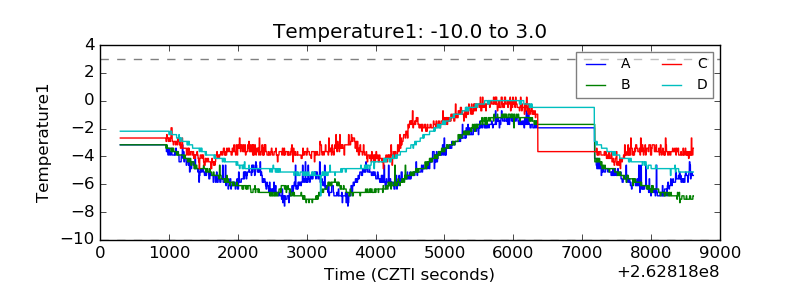 |
| Veto HV Monitor | 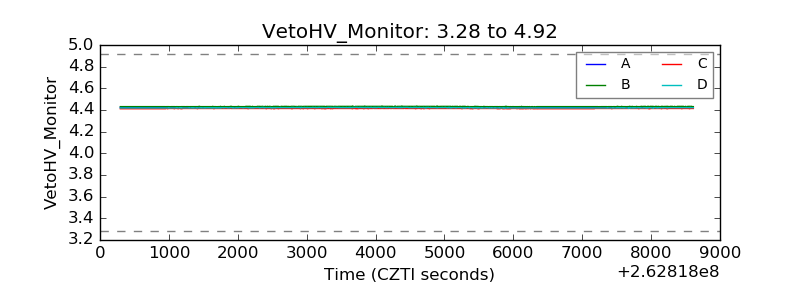 |
| Veto LLD | 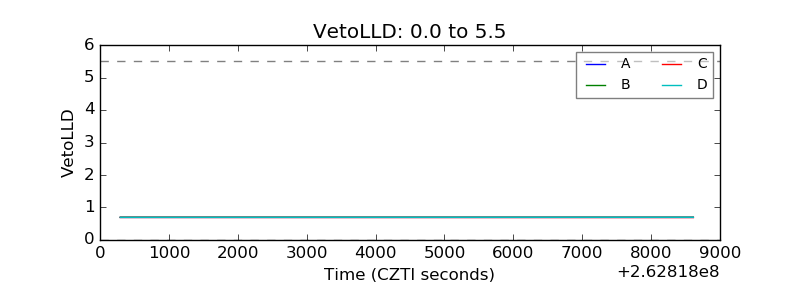 |
| Alpha Counter | 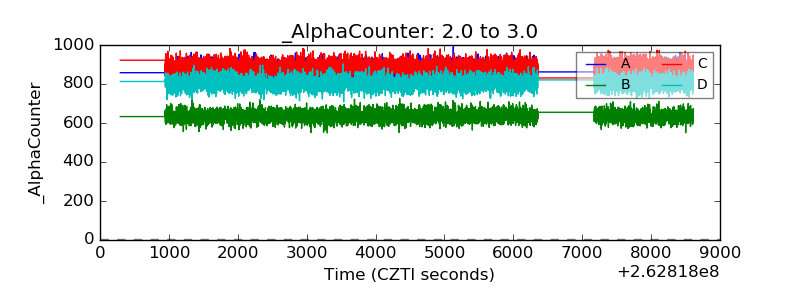 |
| _CPM_Rate | 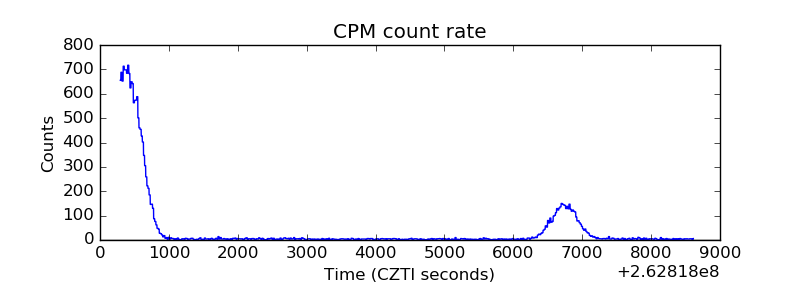 |
| CZT Counter | 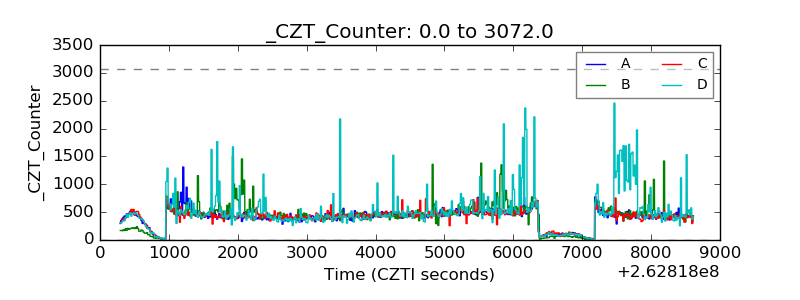 |
| +2.5 Volts monitor |  |
| +5 Volts monitor | 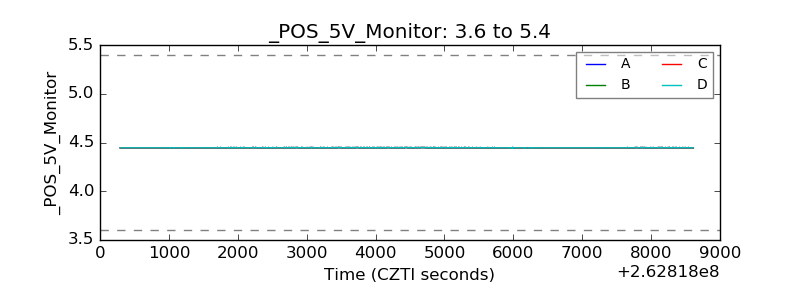 |
| _ROLL_ROT | 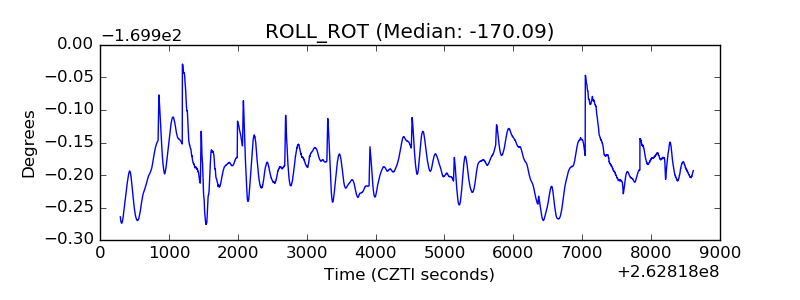 |
| _Roll_DEC | 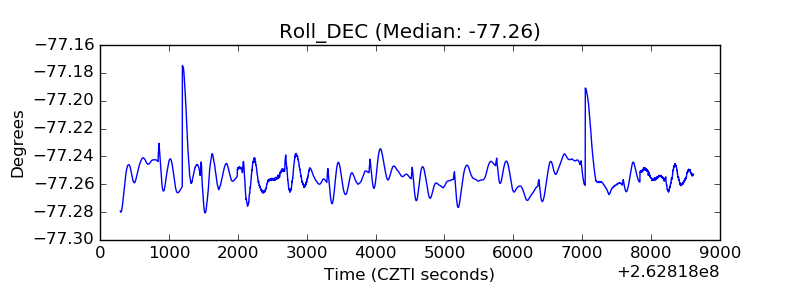 |
| _Roll_RA | 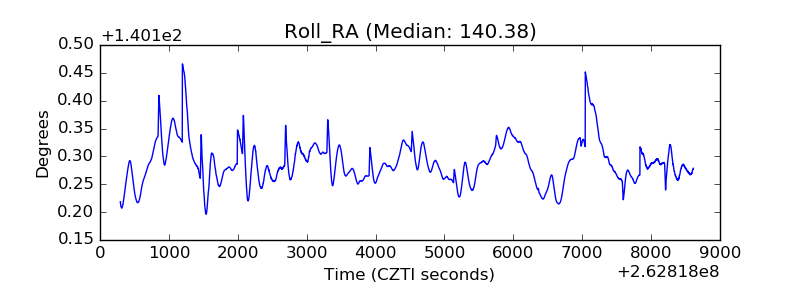 |
| Veto Counter | 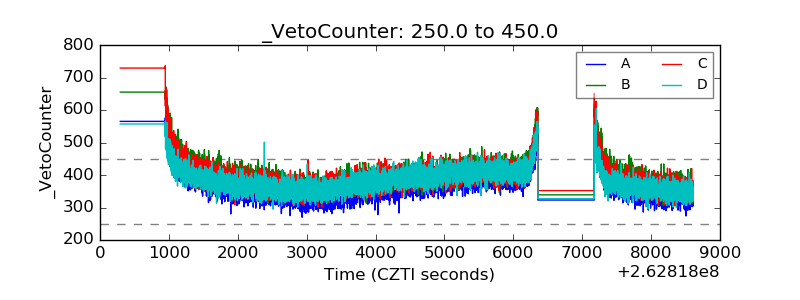 |