| Param | Original file | Final file |
|---|---|---|
| Filename | modeM0/AS1A04_038T02_9000002068_14000cztM0_level2.evt | modeM0/AS1A04_038T02_9000002068_14000cztM0_level2_quad_clean.evt |
| Size (bytes) | 527,932,800 | 133,505,280 |
| Size | 503.5 MB | 127.3 MB |
| Events in quadrant A | 3,395,138 | 903,881 |
| Events in quadrant B | 3,677,703 | 912,312 |
| Events in quadrant C | 3,352,716 | 880,159 |
| Events in quadrant D | 5,065,673 | 837,330 |
| Mode SS | |||
|---|---|---|---|
| Quadrant | BADHDUFLAG | Total packets | Discarded packets |
| A | 0 | 150 | 0 |
| B | 0 | 150 | 0 |
| C | 0 | 150 | 0 |
| D | 0 | 150 | 0 |
| Mode M9 | |||
|---|---|---|---|
| Quadrant | BADHDUFLAG | Total packets | Discarded packets |
| A | 0 | 10 | 0 |
| B | 0 | 10 | 0 |
| C | 0 | 10 | 0 |
| D | 0 | 11 | 0 |
| Mode M0 | |||
|---|---|---|---|
| Quadrant | BADHDUFLAG | Total packets | Discarded packets |
| A | 0 | 15179 | 3 |
| B | 0 | 15884 | 2 |
| C | 0 | 15001 | 2 |
| D | 0 | 20095 | 2 |
| Quadrant | Total seconds | Saturated seconds | Saturation percentage |
|---|---|---|---|
| A | 7321 | 48 | 0.655648% |
| B | 7321 | 88 | 1.202022% |
| C | 7321 | 56 | 0.764923% |
| D | 7321 | 356 | 4.862724% |
Noise dominated data is calculated using 1-second bins in cleaned event files. If a bin has >2000 counts, and if more than 50% of those come from <1% of pixels, then it is considered to be noise-dominated and hence unusable.
| Quadrant | # 1 sec bins | Bins with >0 counts | Bins with >2000 counts | High rate bins dominated by noise | Noise dominated (total time) | Noise dominated (detector-on time) | Marked lightcurve |
|---|---|---|---|---|---|---|---|
| A | 7722 | 7323 | 2 | 2 | 0.03% | 0.03% | 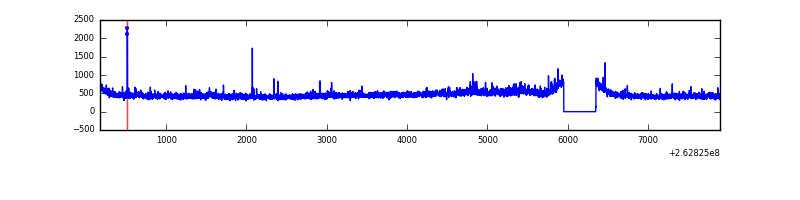 |
| B | 7722 | 7323 | 14 | 14 | 0.18% | 0.19% | 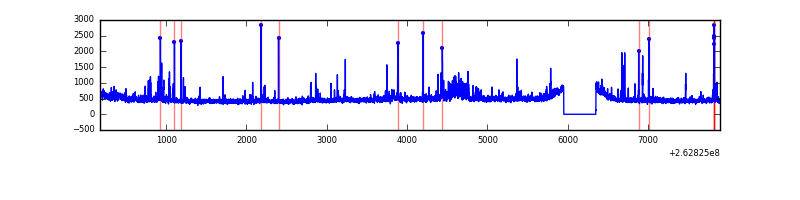 |
| C | 7722 | 7323 | 1 | 1 | 0.01% | 0.01% | 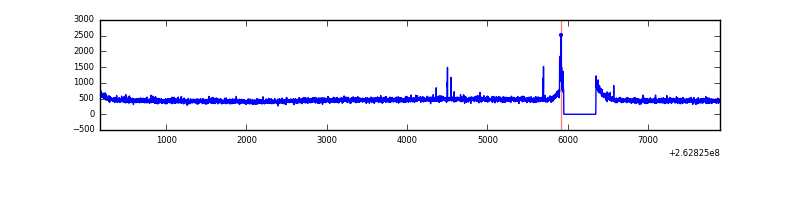 |
| D | 7722 | 7323 | 250 | 250 | 3.24% | 3.41% | 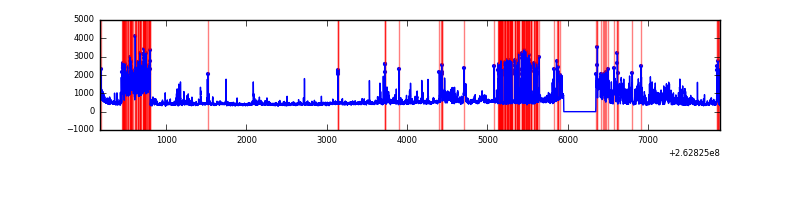 |
Top three noisy pixels from each quadrant. If the there are fewer than three noisy pixels in the level2.evt file, extra rows are filled as -1
| Pixel properties | Quadrant properties | ||||||
|---|---|---|---|---|---|---|---|
| Quadrant | DetID | PixID | Counts | Sigma | Mean | Median | Sigma |
| A | 8 | 15 | 69164 | 401.92 | 842 | 824 | 170.0 |
| A | 12 | 189 | 49400 | 285.68 | 842 | 824 | 170.0 |
| A | 1 | 162 | 16290 | 90.96 | 842 | 824 | 170.0 |
| B | 0 | 219 | 94937 | 591.35 | 843 | 821 | 159.2 |
| B | 0 | 189 | 75730 | 470.67 | 843 | 821 | 159.2 |
| B | 3 | 64 | 68114 | 422.81 | 843 | 821 | 159.2 |
| C | 3 | 233 | 153359 | 823.29 | 809 | 812 | 185.3 |
| C | 12 | 4 | 28013 | 146.8 | 809 | 812 | 185.3 |
| C | 0 | 207 | 13537 | 68.68 | 809 | 812 | 185.3 |
| D | 1 | 52 | 1004305 | 5035.42 | 792 | 769 | 199.3 |
| D | 10 | 157 | 582372 | 2918.3 | 792 | 769 | 199.3 |
| D | 13 | 189 | 182519 | 911.96 | 792 | 769 | 199.3 |
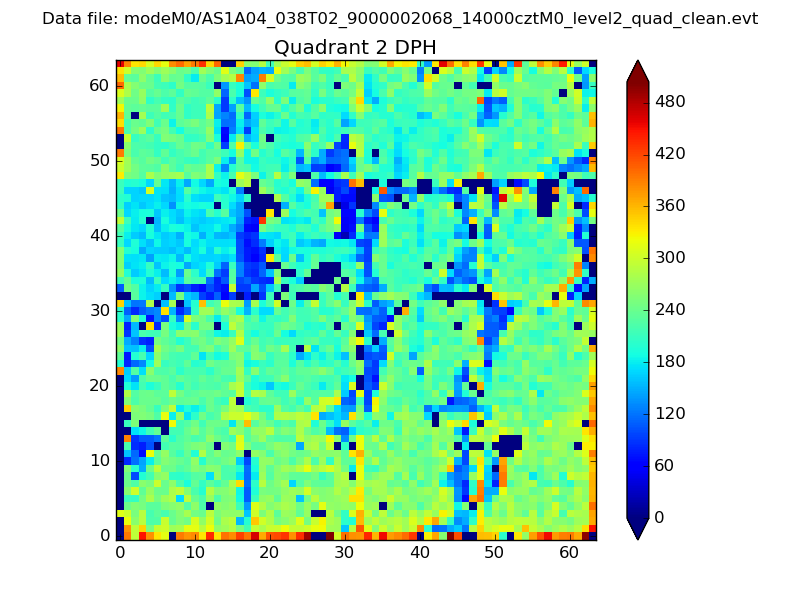
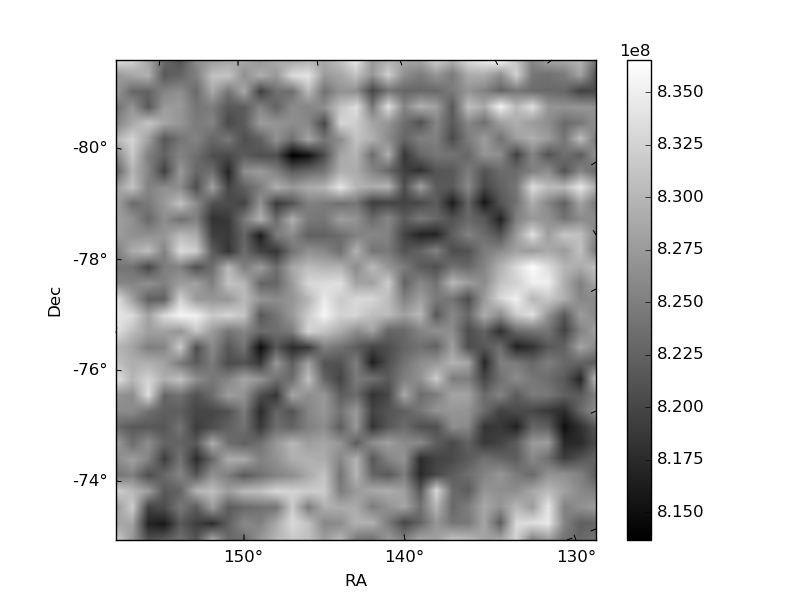
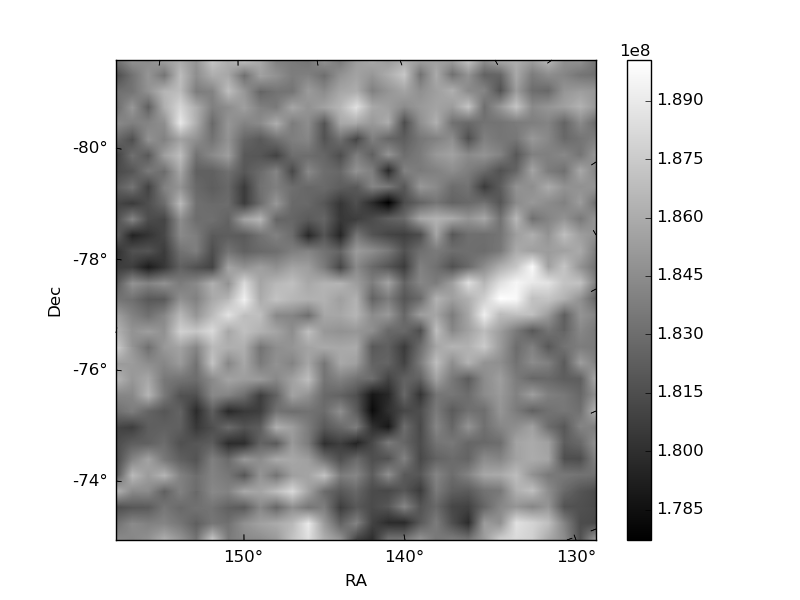
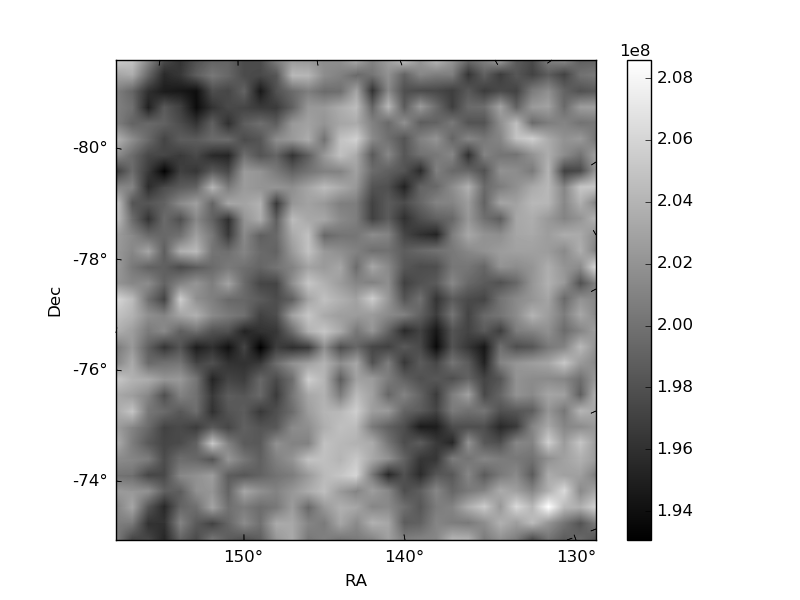
Histogram calculated using DETX and DETY for each event in the final _common_clean file
| Quadrant A | 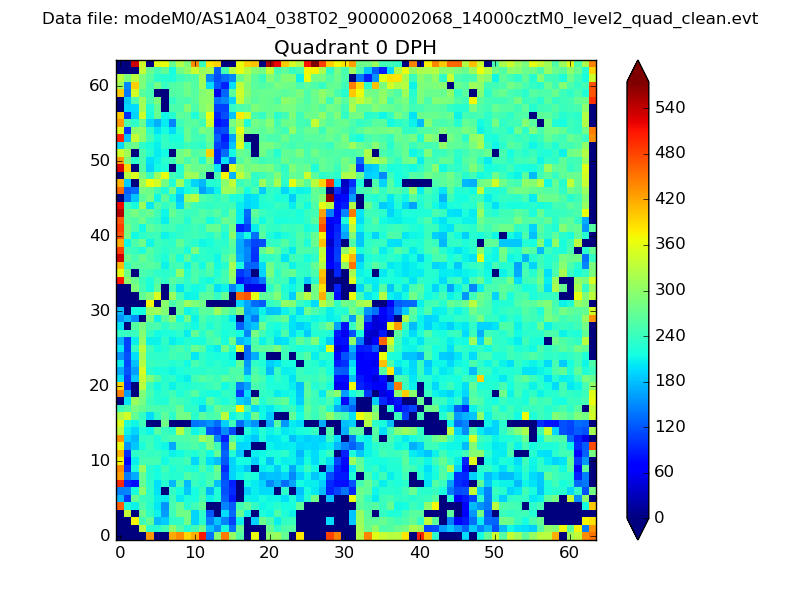 |
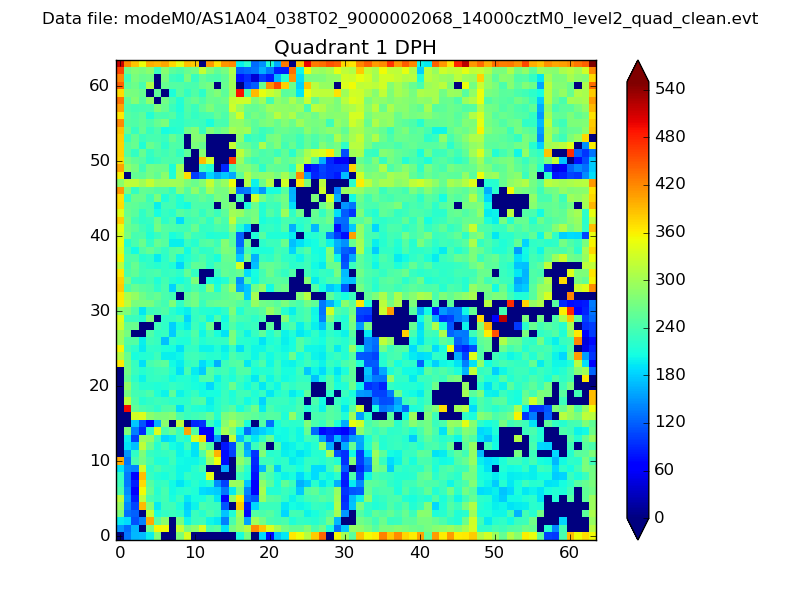 |
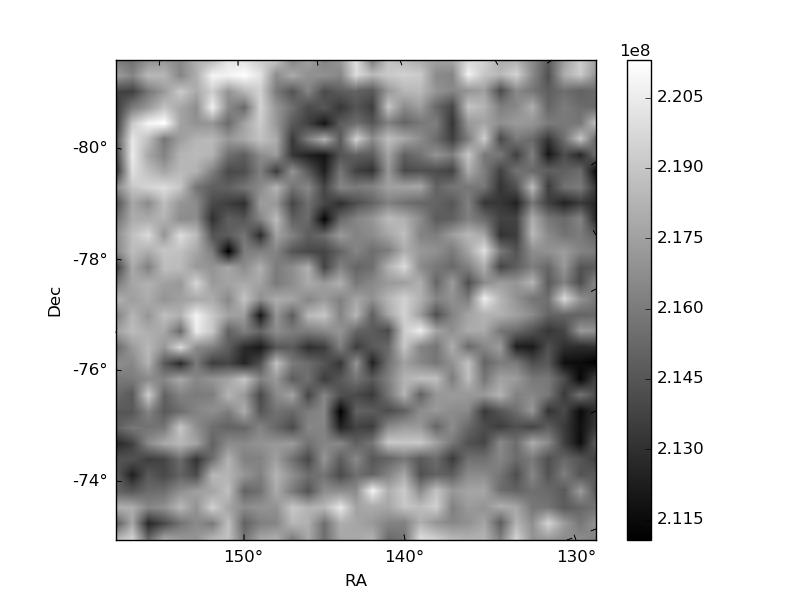
Quadrant B |
|---|---|---|---|
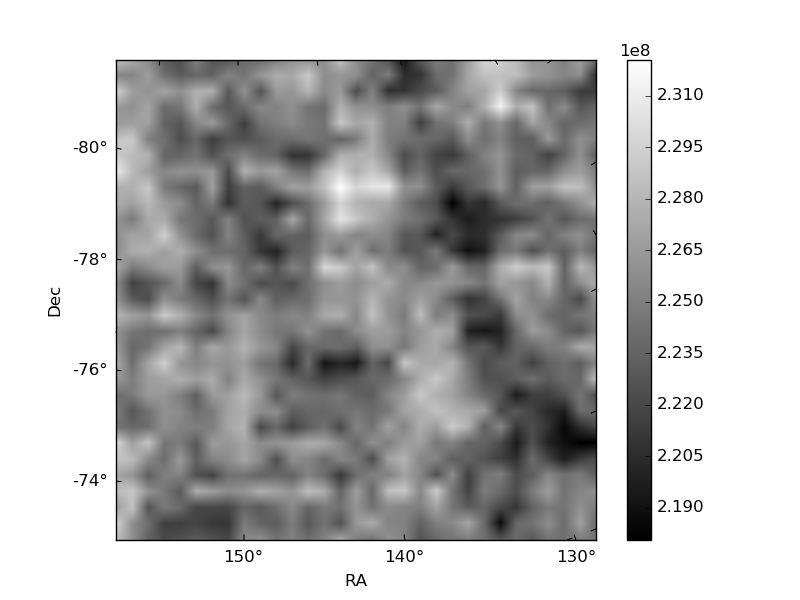
| Quadrant D | 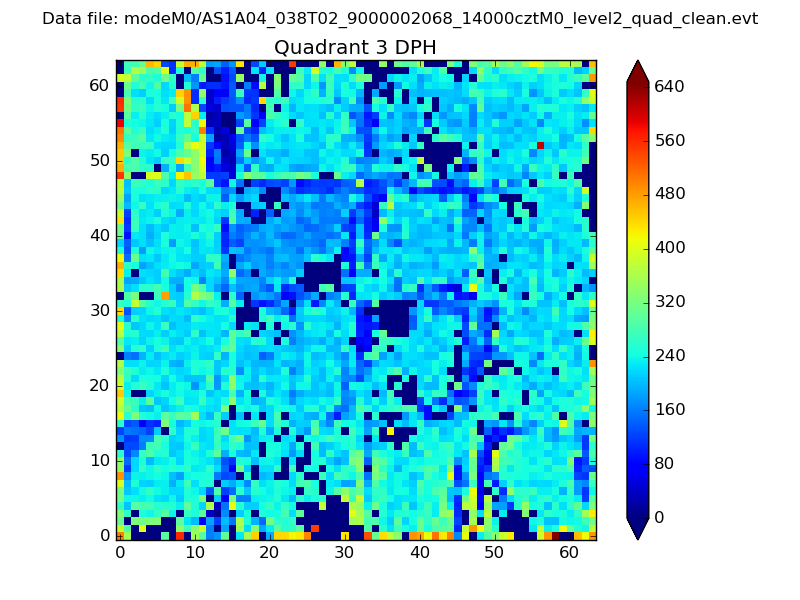 |
 |
Quadrant C |
| Plot type | Count rate plots | Images |
|---|---|---|
| Comparison with Poisson distribution Blue bars denote a histogram of data divided into 1 sec bins. Red curve is a Poisson curve with rate = median count rate of data. |
 |
 |
| Quadrant-wise count rates Data is divided into 100 sec bins |
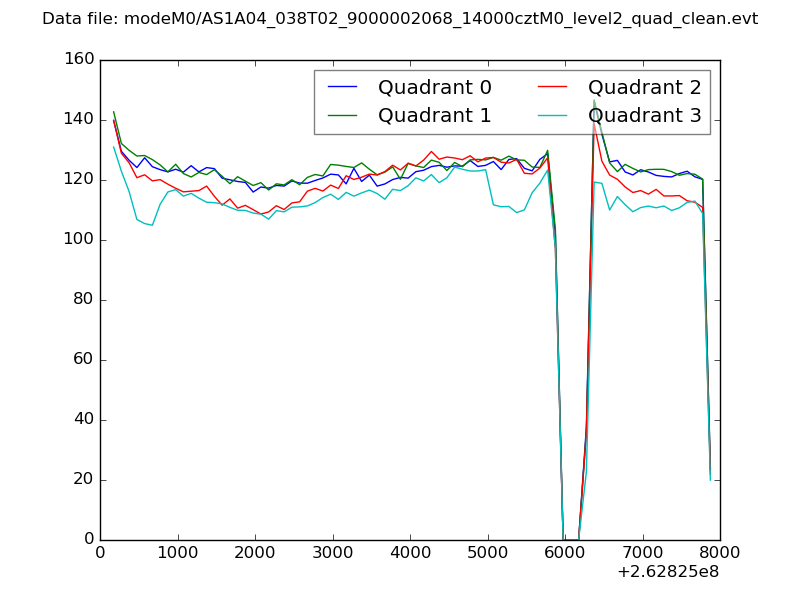 |
|
| Module-wise count rates for Quadrant A Data is divided into 100 sec bins |
 |
 |
| Module-wise count rates for Quadrant B Data is divided into 100 sec bins |
 |
 |
| Module-wise count rates for Quadrant C Data is divided into 100 sec bins |
 |
 |
| Module-wise count rates for Quadrant D Data is divided into 100 sec bins |
 |
 |
| Parameter | Plot |
|---|---|
| CZT HV Monitor |  |
| D_VDD | 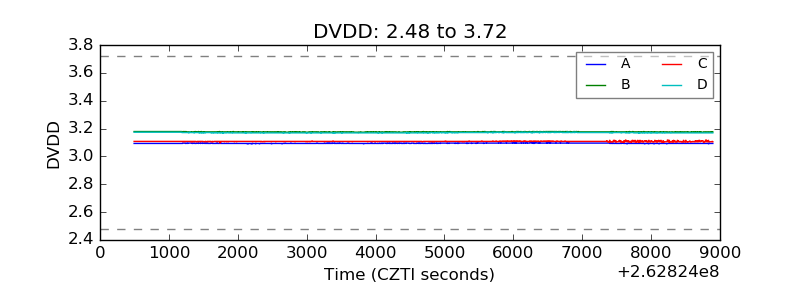 |
| Temperature 1 | 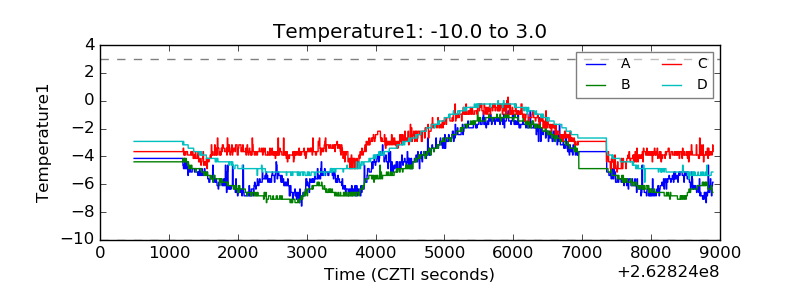 |
| Veto HV Monitor | 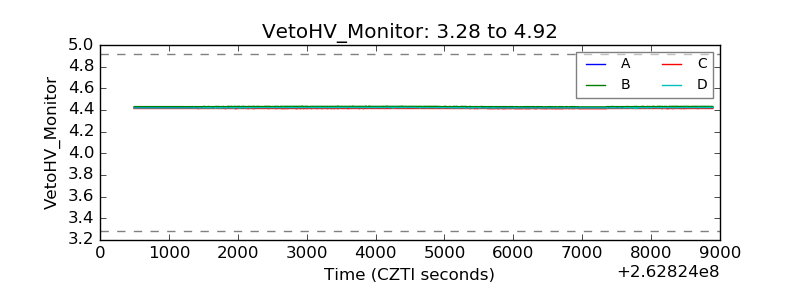 |
| Veto LLD | 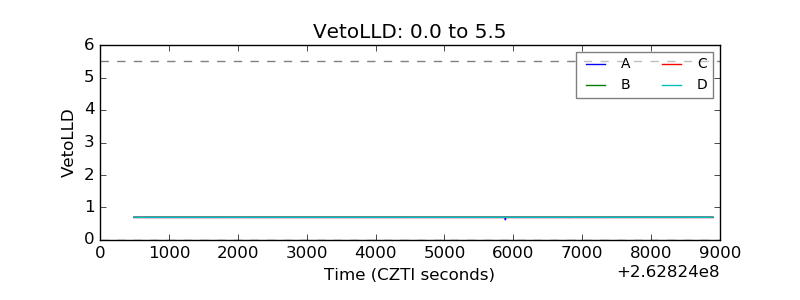 |
| Alpha Counter | 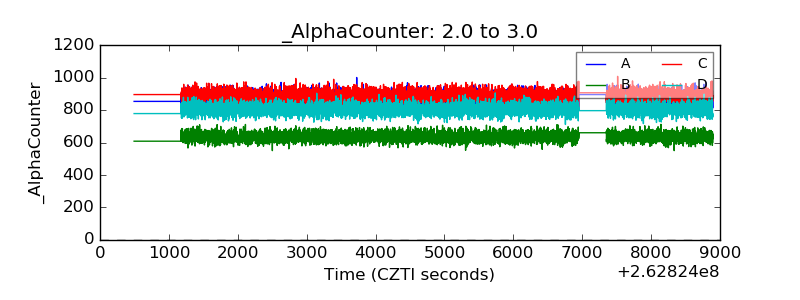 |
| _CPM_Rate | 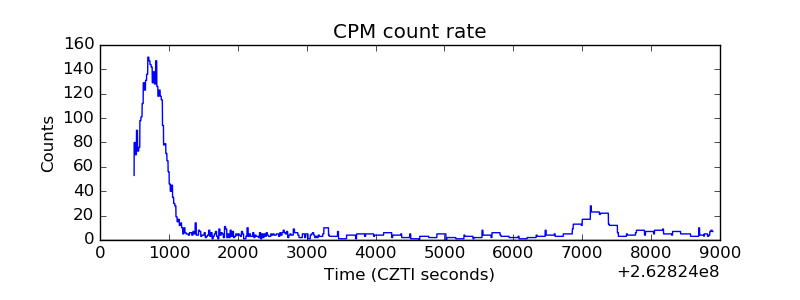 |
| CZT Counter | 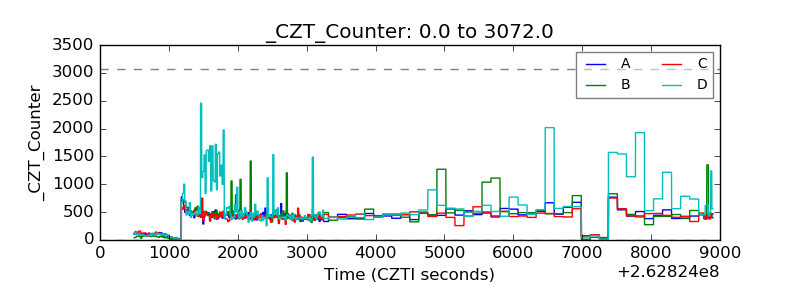 |
| +2.5 Volts monitor | 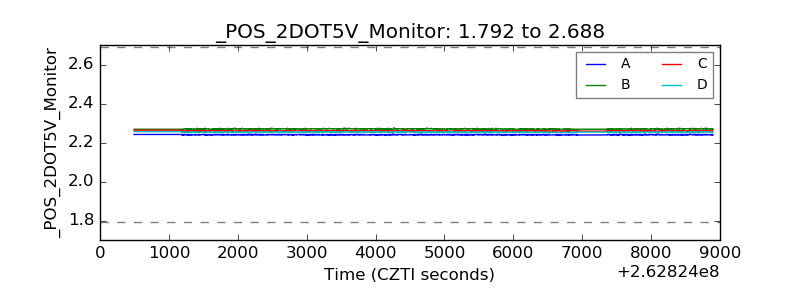 |
| +5 Volts monitor |  |
| _ROLL_ROT |  |
| _Roll_DEC | 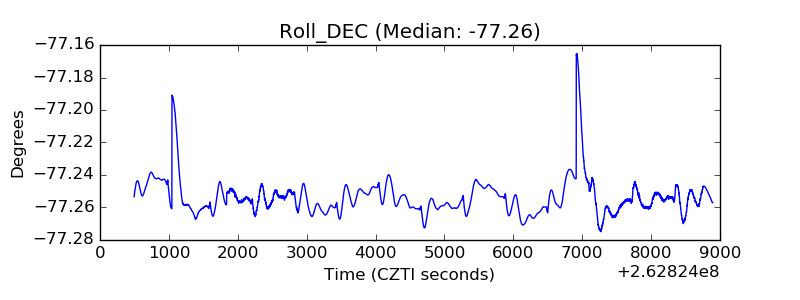 |
| _Roll_RA | 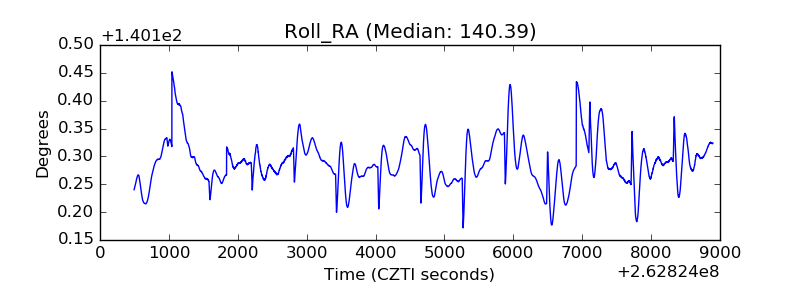 |
| Veto Counter | 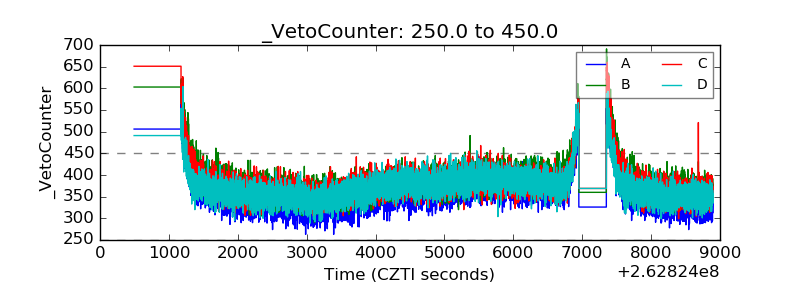 |