| Param | Original file | Final file |
|---|---|---|
| Filename | modeM0/AS1A04_038T02_9000002068_14004cztM0_level2.evt | modeM0/AS1A04_038T02_9000002068_14004cztM0_level2_quad_clean.evt |
| Size (bytes) | 178,456,320 | 39,551,040 |
| Size | 170.2 MB | 37.7 MB |
| Events in quadrant A | 974,545 | 266,468 |
| Events in quadrant B | 1,147,854 | 269,192 |
| Events in quadrant C | 1,017,287 | 259,146 |
| Events in quadrant D | 2,110,598 | 240,836 |
| Mode SS | |||
|---|---|---|---|
| Quadrant | BADHDUFLAG | Total packets | Discarded packets |
| A | 0 | 44 | 0 |
| B | 0 | 44 | 0 |
| C | 0 | 44 | 0 |
| D | 0 | 44 | 0 |
| Mode M0 | |||
|---|---|---|---|
| Quadrant | BADHDUFLAG | Total packets | Discarded packets |
| A | 0 | 4514 | 1 |
| B | 0 | 4941 | 0 |
| C | 0 | 4486 | 0 |
| D | 0 | 7831 | 0 |
| Quadrant | Total seconds | Saturated seconds | Saturation percentage |
|---|---|---|---|
| A | 2239 | 3 | 0.133988% |
| B | 2239 | 50 | 2.233140% |
| C | 2239 | 0 | 0.000000% |
| D | 2239 | 187 | 8.351943% |
Noise dominated data is calculated using 1-second bins in cleaned event files. If a bin has >2000 counts, and if more than 50% of those come from <1% of pixels, then it is considered to be noise-dominated and hence unusable.
| Quadrant | # 1 sec bins | Bins with >0 counts | Bins with >2000 counts | High rate bins dominated by noise | Noise dominated (total time) | Noise dominated (detector-on time) | Marked lightcurve |
|---|---|---|---|---|---|---|---|
| A | 2240 | 2240 | 2 | 2 | 0.09% | 0.09% | 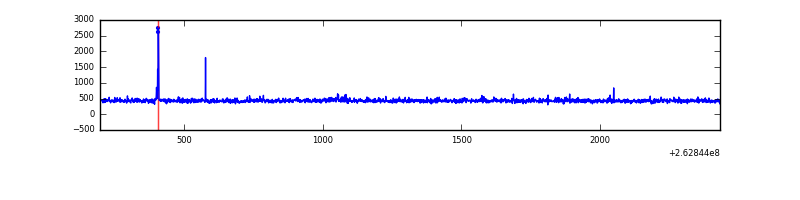 |
| B | 2240 | 2240 | 38 | 38 | 1.70% | 1.70% | 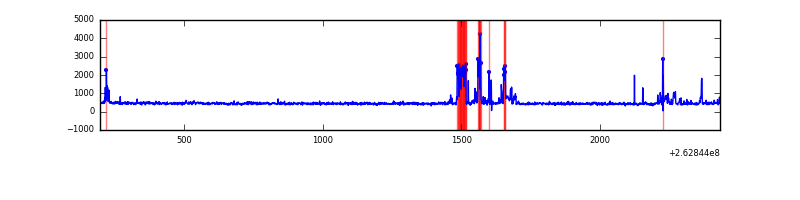 |
| C | 2240 | 2240 | 0 | 0 | 0.00% | 0.00% | 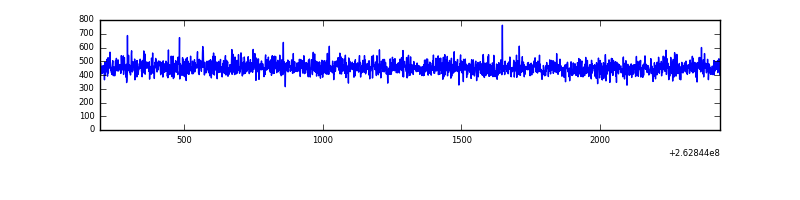 |
| D | 2240 | 2240 | 172 | 172 | 7.68% | 7.68% | 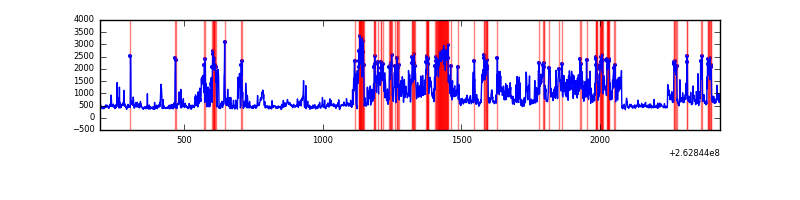 |
Top three noisy pixels from each quadrant. If the there are fewer than three noisy pixels in the level2.evt file, extra rows are filled as -1
| Pixel properties | Quadrant properties | ||||||
|---|---|---|---|---|---|---|---|
| Quadrant | DetID | PixID | Counts | Sigma | Mean | Median | Sigma |
| A | 4 | 2 | 10770 | 202.71 | 247 | 241 | 51.9 |
| A | 8 | 15 | 5457 | 100.42 | 247 | 241 | 51.9 |
| A | 1 | 162 | 3970 | 71.79 | 247 | 241 | 51.9 |
| B | 10 | 16 | 159771 | 3273.68 | 247 | 240 | 48.7 |
| B | 4 | 173 | 6548 | 129.44 | 247 | 240 | 48.7 |
| B | 0 | 214 | 6065 | 119.53 | 247 | 240 | 48.7 |
| C | 3 | 233 | 45978 | 779.6 | 247 | 247 | 58.7 |
| C | 8 | 128 | 4724 | 76.32 | 247 | 247 | 58.7 |
| C | 8 | 112 | 2301 | 35.02 | 247 | 247 | 58.7 |
| D | 1 | 52 | 690971 | 12080.83 | 236 | 230 | 57.2 |
| D | 13 | 122 | 329424 | 5757.49 | 236 | 230 | 57.2 |
| D | 13 | 104 | 122653 | 2141.14 | 236 | 230 | 57.2 |
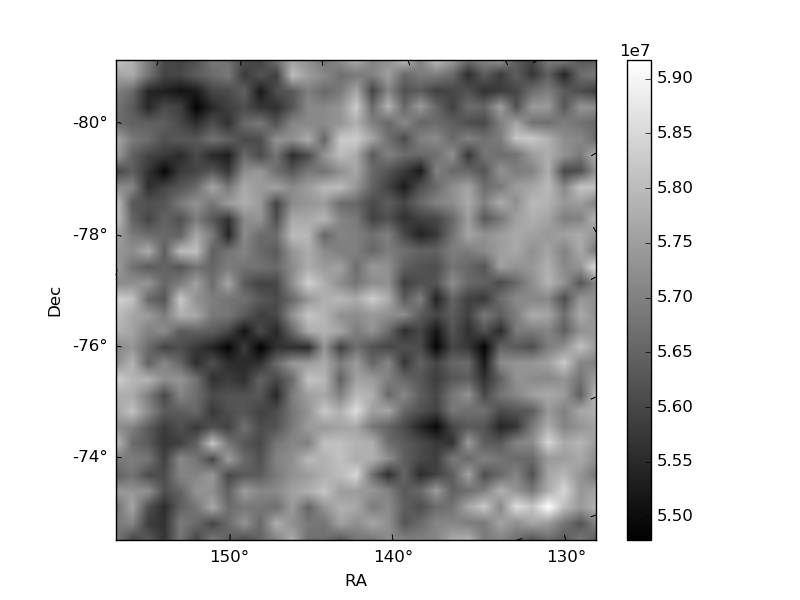
Histogram calculated using DETX and DETY for each event in the final _common_clean file
| Quadrant A | 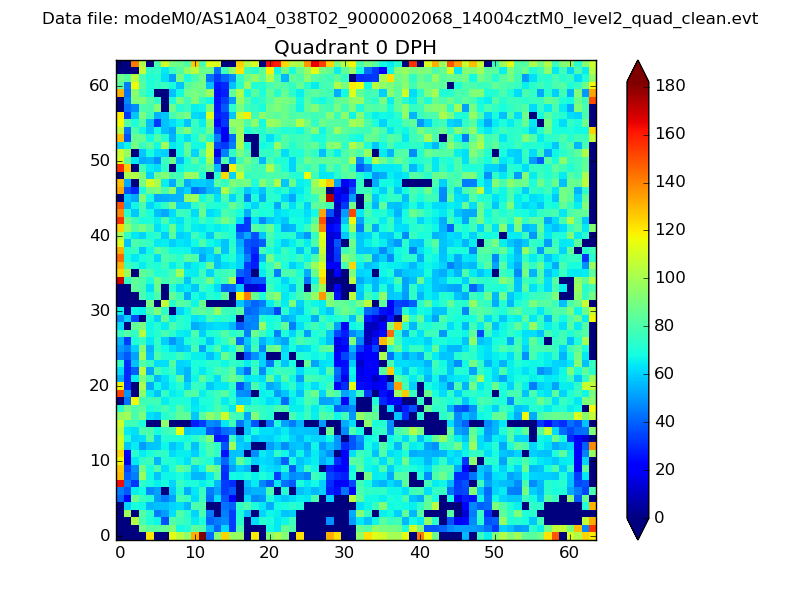 |
 |
Quadrant B |
|---|---|---|---|
| Quadrant D | 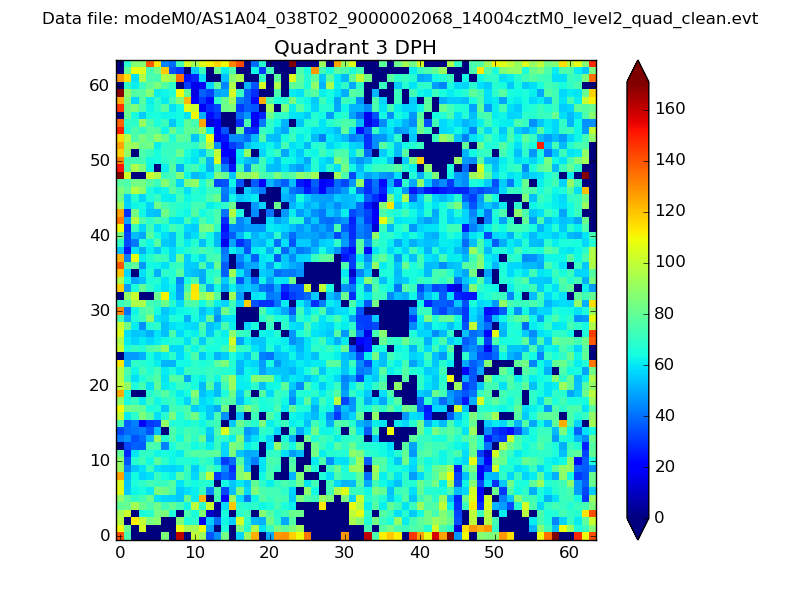 |
 |
Quadrant C |
| Plot type | Count rate plots | Images |
|---|---|---|
| Comparison with Poisson distribution Blue bars denote a histogram of data divided into 1 sec bins. Red curve is a Poisson curve with rate = median count rate of data. |
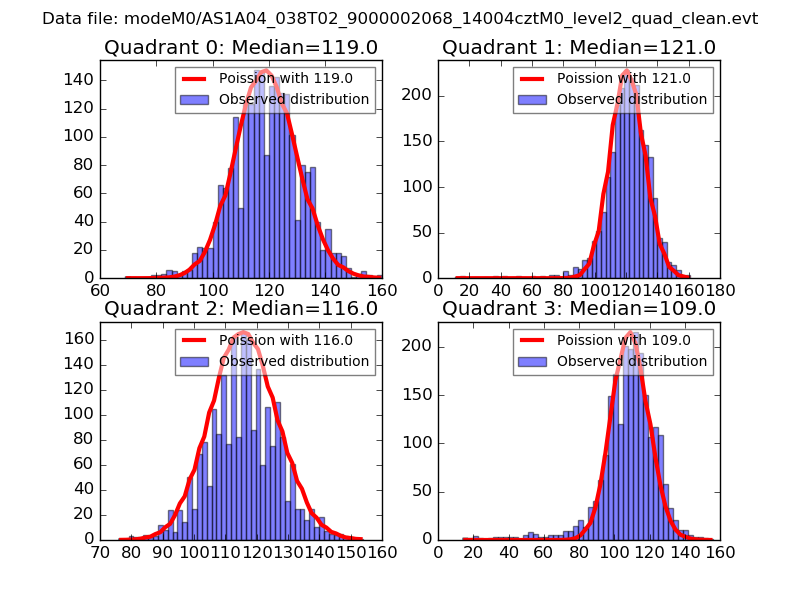 |
 |
| Quadrant-wise count rates Data is divided into 100 sec bins |
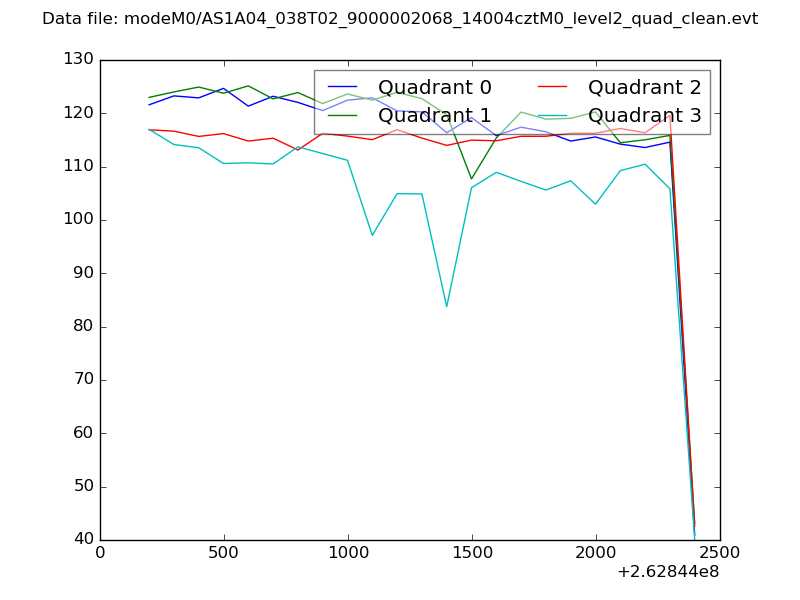 |
|
| Module-wise count rates for Quadrant A Data is divided into 100 sec bins |
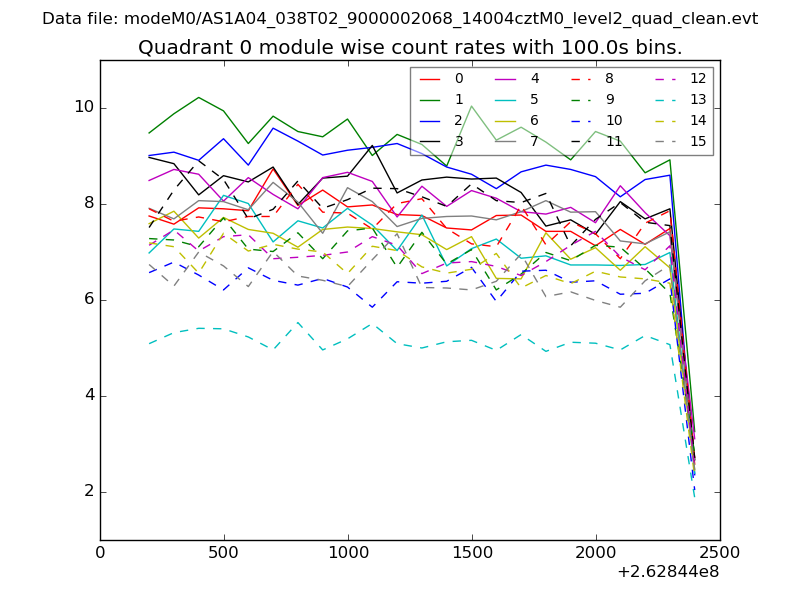 |
 |
| Module-wise count rates for Quadrant B Data is divided into 100 sec bins |
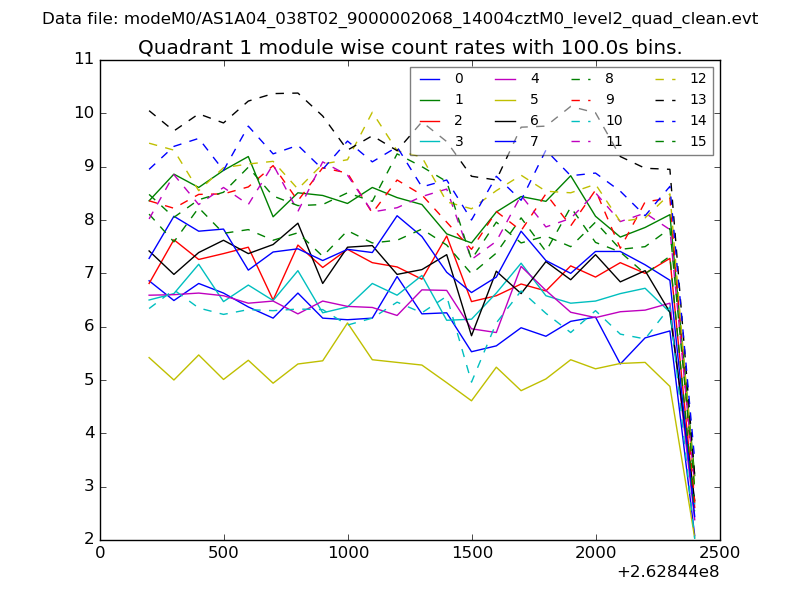 |
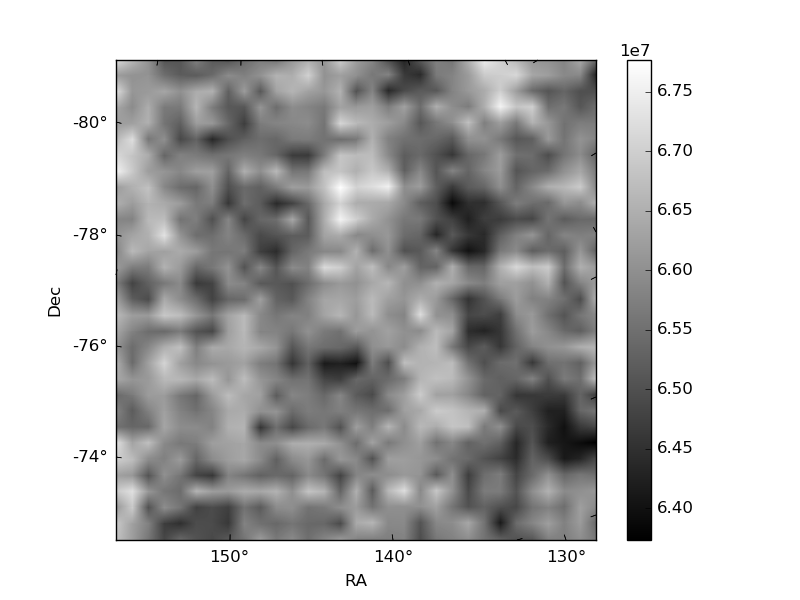 |
| Module-wise count rates for Quadrant C Data is divided into 100 sec bins |
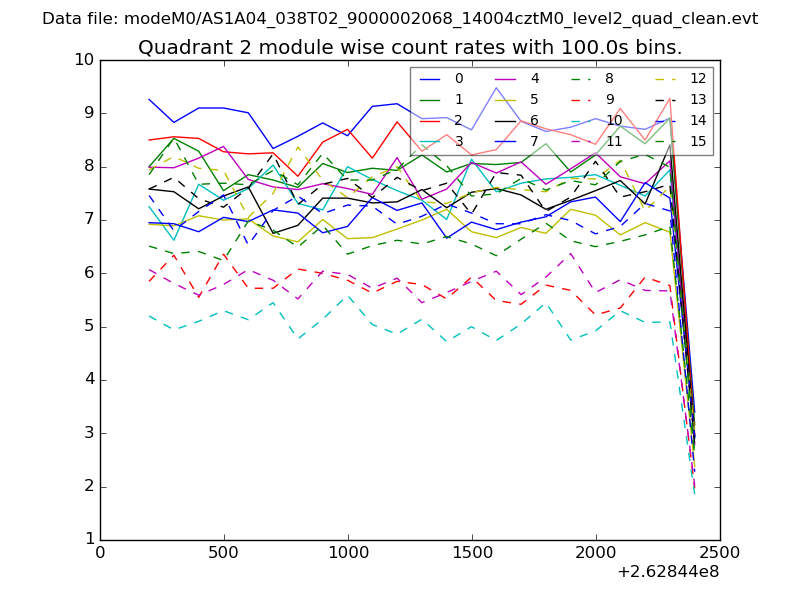 |
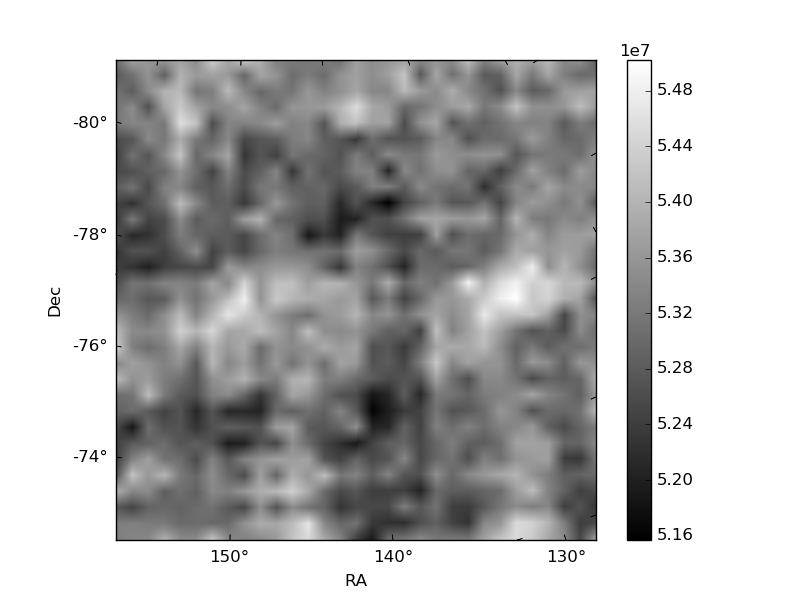 |
| Module-wise count rates for Quadrant D Data is divided into 100 sec bins |
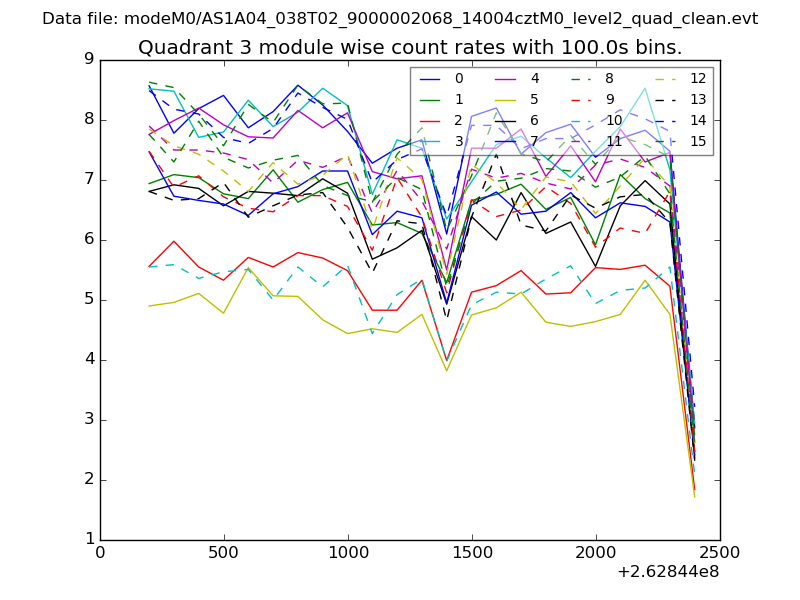 |
 |
| Parameter | Plot |
|---|---|
| CZT HV Monitor | 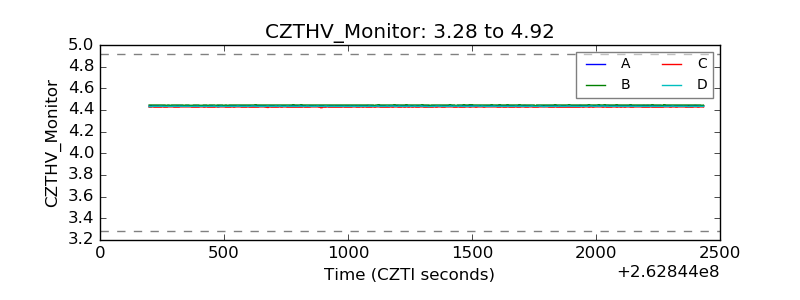 |
| D_VDD | 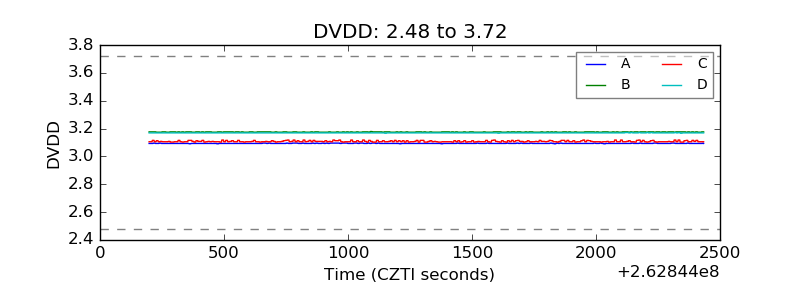 |
| Temperature 1 | 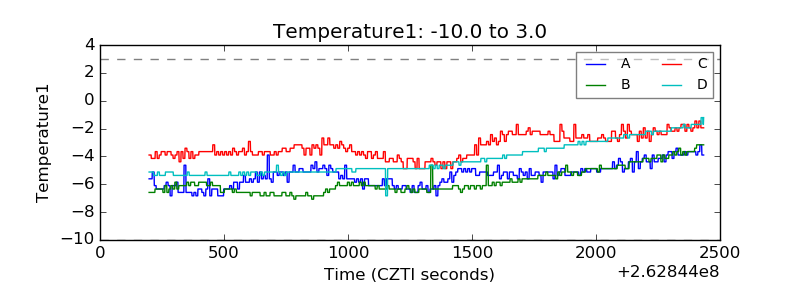 |
| Veto HV Monitor | 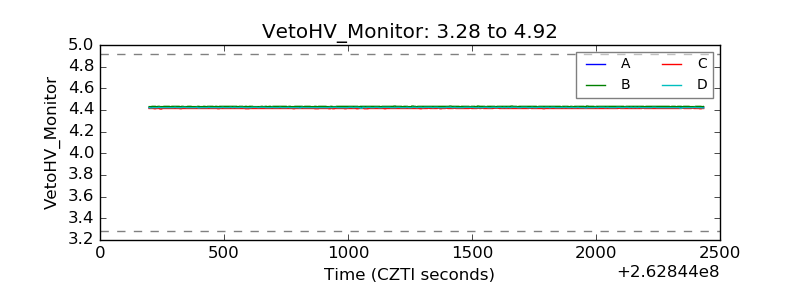 |
| Veto LLD | 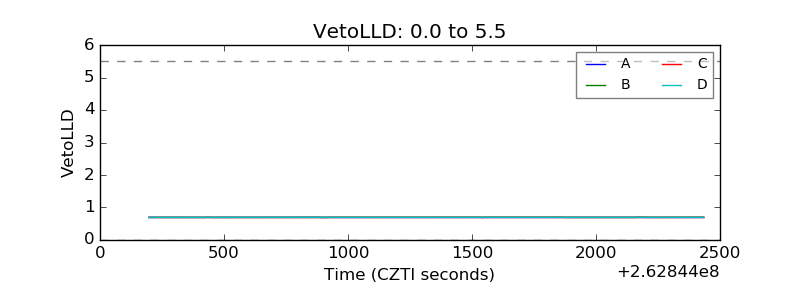 |
| Alpha Counter | 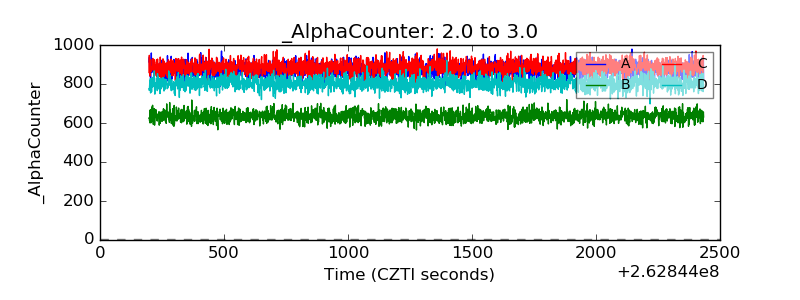 |
| _CPM_Rate | 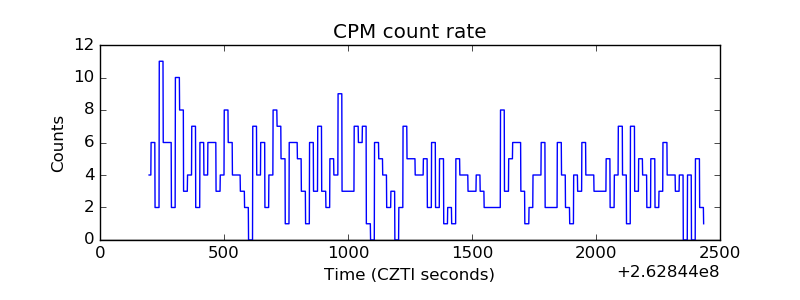 |
| CZT Counter | 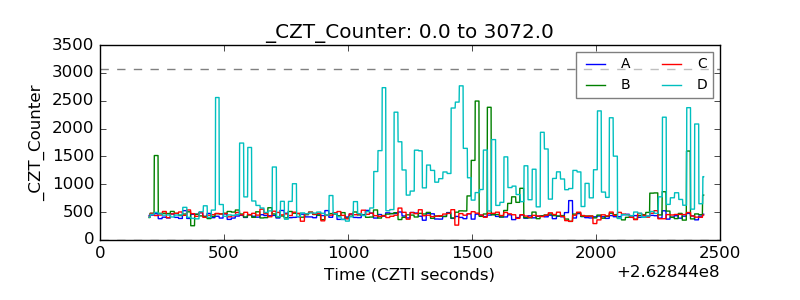 |
| +2.5 Volts monitor |  |
| +5 Volts monitor | 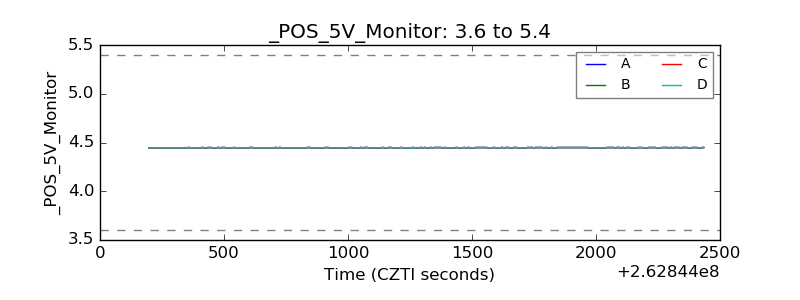 |
| _ROLL_ROT | 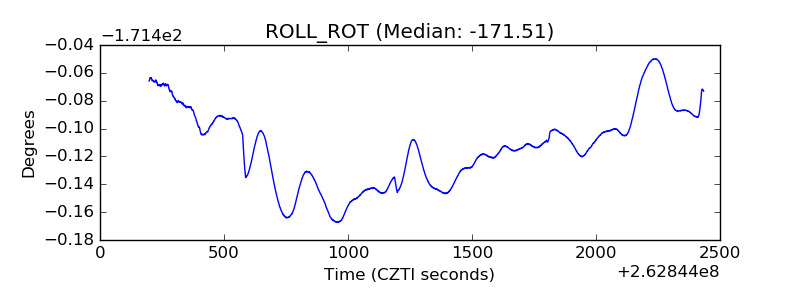 |
| _Roll_DEC | 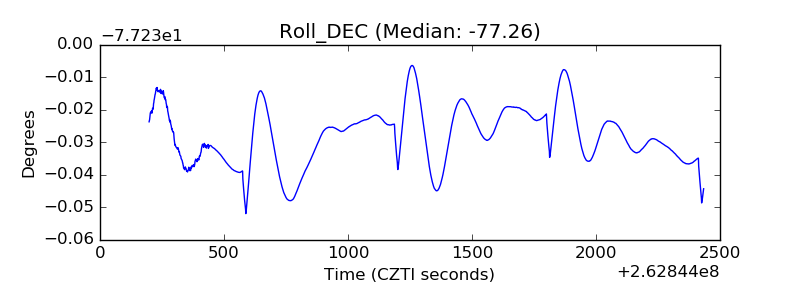 |
| _Roll_RA | 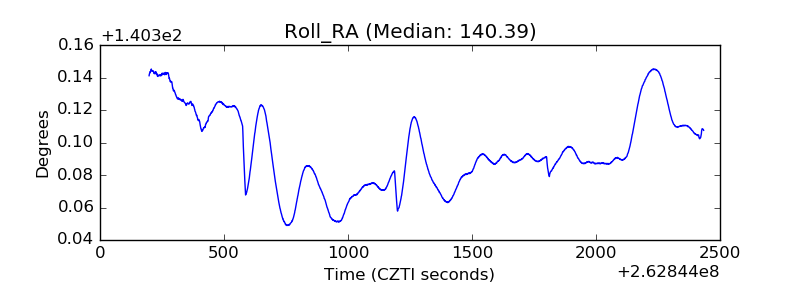 |
| Veto Counter | 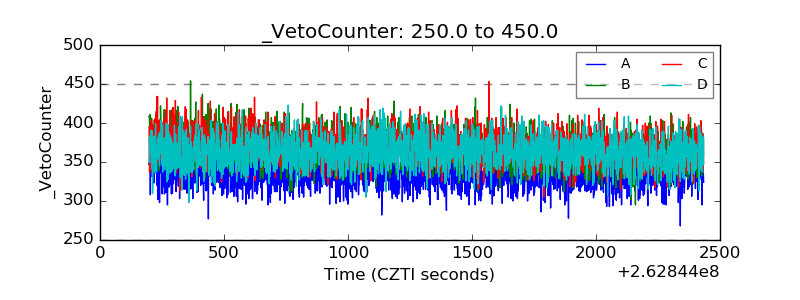 |