| Param | Original file | Final file |
|---|---|---|
| Filename | modeM0/AS1A04_038T02_9000002068_14005cztM0_level2.evt | modeM0/AS1A04_038T02_9000002068_14005cztM0_level2_quad_clean.evt |
| Size (bytes) | 1,018,287,360 | 241,542,720 |
| Size | 971.1 MB | 230.4 MB |
| Events in quadrant A | 6,184,761 | 1,618,286 |
| Events in quadrant B | 7,479,724 | 1,624,679 |
| Events in quadrant C | 6,176,466 | 1,609,428 |
| Events in quadrant D | 10,085,181 | 1,531,122 |
| Mode SS | |||
|---|---|---|---|
| Quadrant | BADHDUFLAG | Total packets | Discarded packets |
| A | 0 | 274 | 0 |
| B | 0 | 274 | 0 |
| C | 0 | 274 | 0 |
| D | 0 | 274 | 0 |
| Mode M9 | |||
|---|---|---|---|
| Quadrant | BADHDUFLAG | Total packets | Discarded packets |
| A | 0 | 10 | 0 |
| B | 0 | 10 | 0 |
| C | 0 | 10 | 0 |
| D | 0 | 10 | 0 |
| Mode M0 | |||
|---|---|---|---|
| Quadrant | BADHDUFLAG | Total packets | Discarded packets |
| A | 0 | 27610 | 2 |
| B | 0 | 30960 | 2 |
| C | 0 | 27456 | 2 |
| D | 0 | 39234 | 2 |
| Quadrant | Total seconds | Saturated seconds | Saturation percentage |
|---|---|---|---|
| A | 13499 | 207 | 1.533447% |
| B | 13499 | 401 | 2.970590% |
| C | 13499 | 185 | 1.370472% |
| D | 13499 | 687 | 5.089266% |
Noise dominated data is calculated using 1-second bins in cleaned event files. If a bin has >2000 counts, and if more than 50% of those come from <1% of pixels, then it is considered to be noise-dominated and hence unusable.
| Quadrant | # 1 sec bins | Bins with >0 counts | Bins with >2000 counts | High rate bins dominated by noise | Noise dominated (total time) | Noise dominated (detector-on time) | Marked lightcurve |
|---|---|---|---|---|---|---|---|
| A | 14575 | 13502 | 0 | 0 | 0.00% | 0.00% | 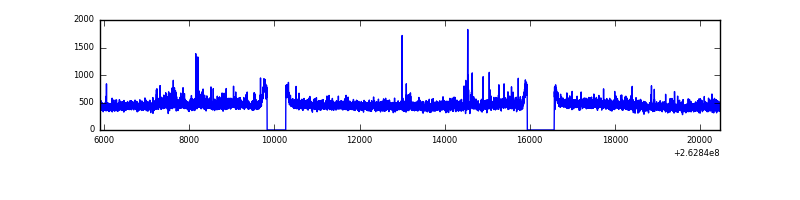 |
| B | 14575 | 13502 | 107 | 107 | 0.73% | 0.79% | 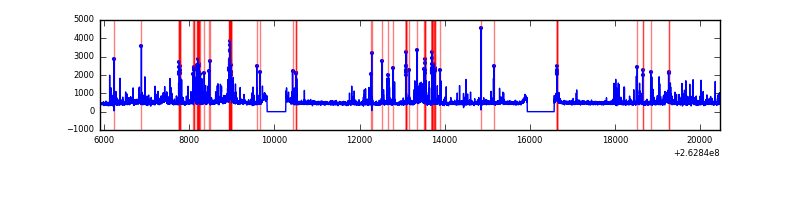 |
| C | 14575 | 13502 | 0 | 0 | 0.00% | 0.00% | 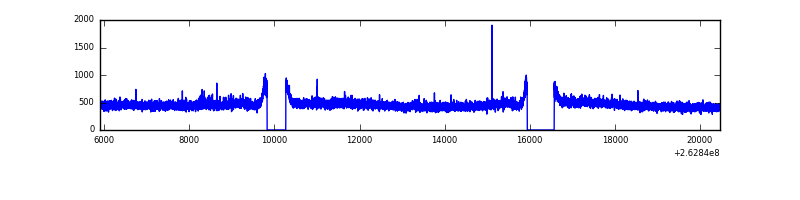 |
| D | 14575 | 13502 | 610 | 610 | 4.19% | 4.52% | 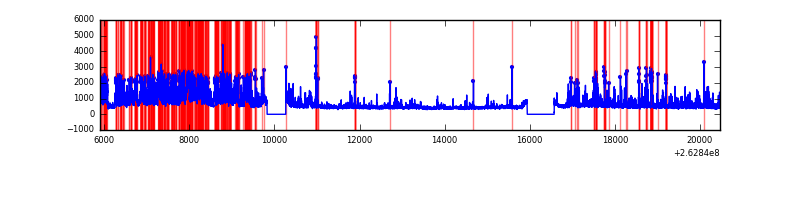 |
Top three noisy pixels from each quadrant. If the there are fewer than three noisy pixels in the level2.evt file, extra rows are filled as -1
| Pixel properties | Quadrant properties | ||||||
|---|---|---|---|---|---|---|---|
| Quadrant | DetID | PixID | Counts | Sigma | Mean | Median | Sigma |
| A | 12 | 189 | 57664 | 177.28 | 1555 | 1516 | 316.7 |
| A | 8 | 15 | 50521 | 154.73 | 1555 | 1516 | 316.7 |
| A | 1 | 162 | 31451 | 94.52 | 1555 | 1516 | 316.7 |
| B | 10 | 16 | 437711 | 1486.65 | 1540 | 1501 | 293.4 |
| B | 0 | 189 | 352524 | 1196.32 | 1540 | 1501 | 293.4 |
| B | 3 | 64 | 142490 | 480.5 | 1540 | 1501 | 293.4 |
| C | 3 | 233 | 310582 | 894.93 | 1501 | 1502 | 345.4 |
| C | 13 | 61 | 10918 | 27.26 | 1501 | 1502 | 345.4 |
| C | 8 | 128 | 7868 | 18.43 | 1501 | 1502 | 345.4 |
| D | 1 | 52 | 3563413 | 9868.19 | 1488 | 1448 | 361.0 |
| D | 10 | 157 | 212134 | 583.69 | 1488 | 1448 | 361.0 |
| D | 13 | 189 | 193855 | 533.05 | 1488 | 1448 | 361.0 |
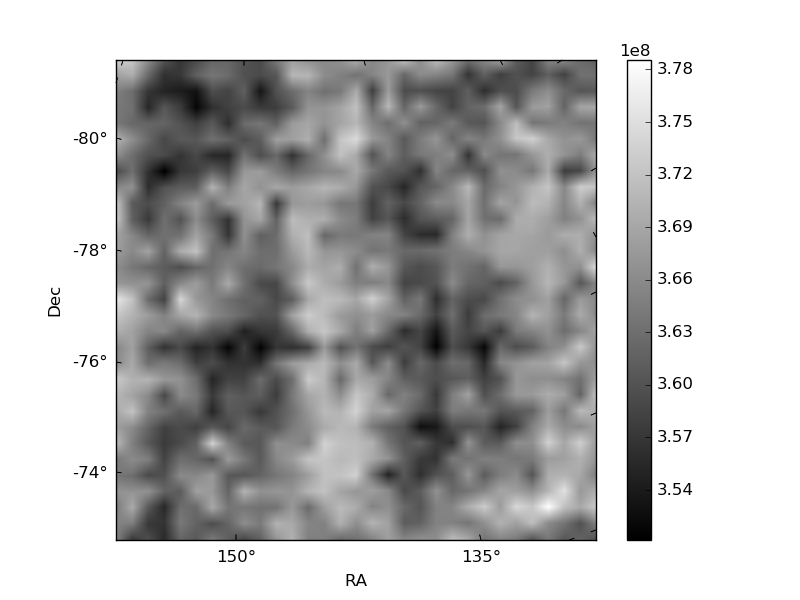
Histogram calculated using DETX and DETY for each event in the final _common_clean file
| Quadrant A | 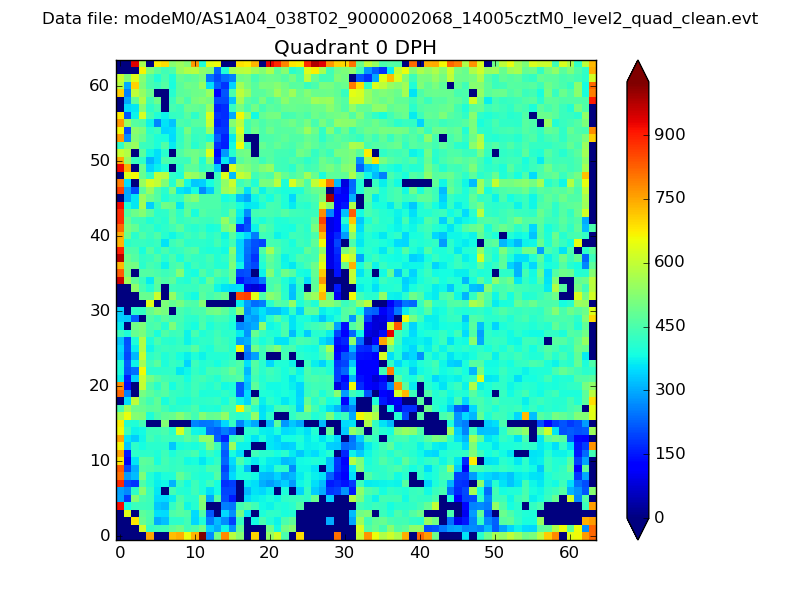 |
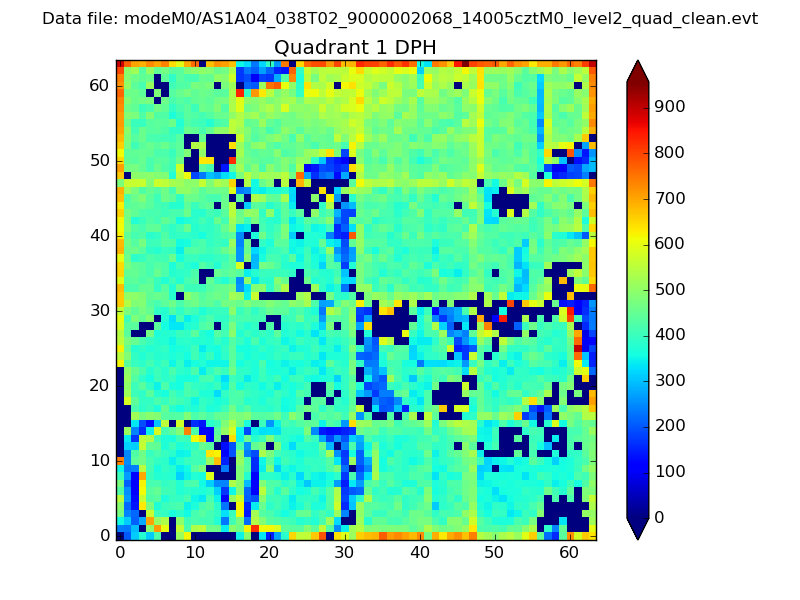 |
Quadrant B |
|---|---|---|---|
| Quadrant D | 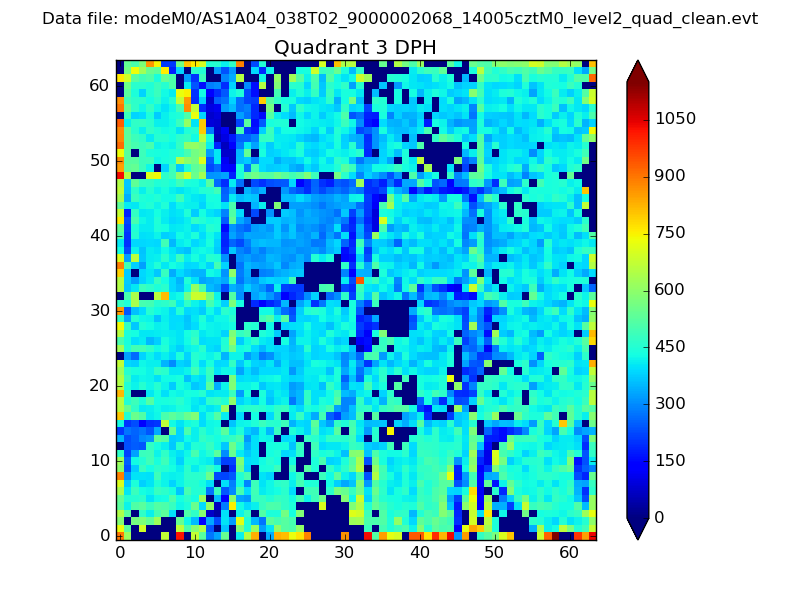 |
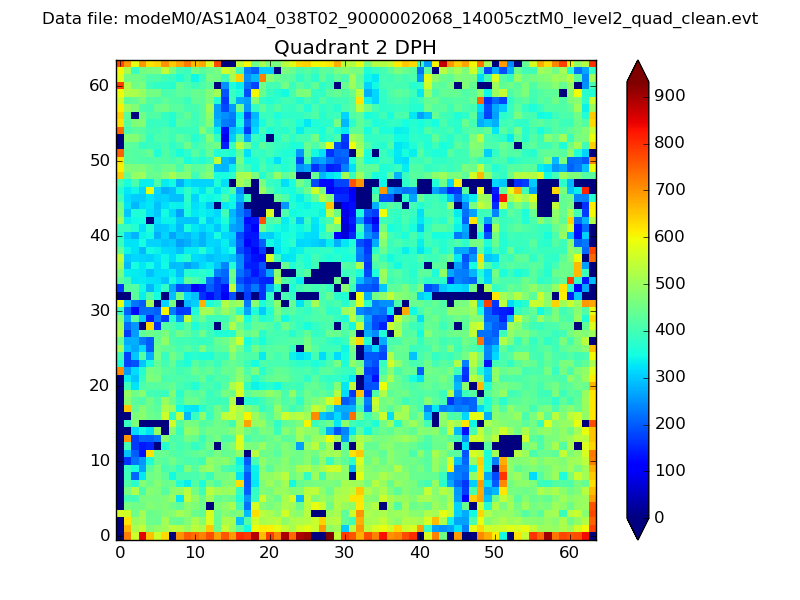 |
Quadrant C |
| Plot type | Count rate plots | Images |
|---|---|---|
| Comparison with Poisson distribution Blue bars denote a histogram of data divided into 1 sec bins. Red curve is a Poisson curve with rate = median count rate of data. |
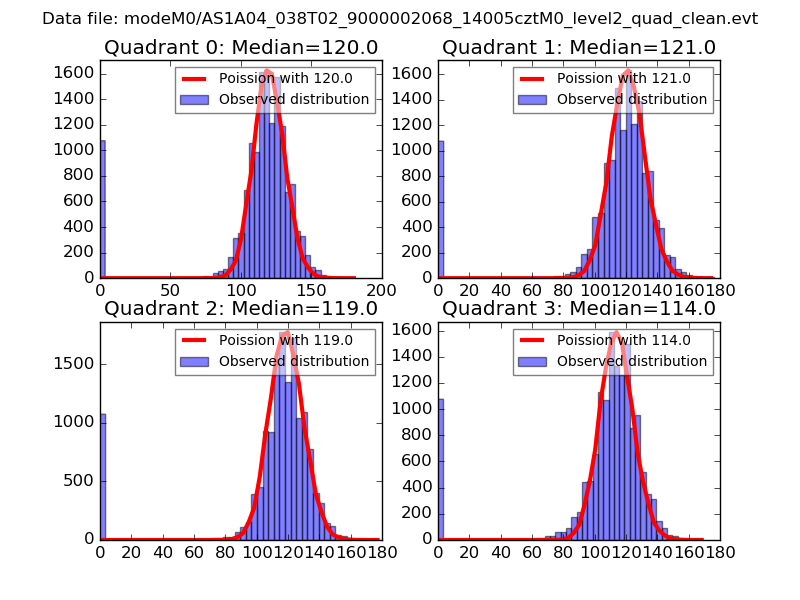 |
 |
| Quadrant-wise count rates Data is divided into 100 sec bins |
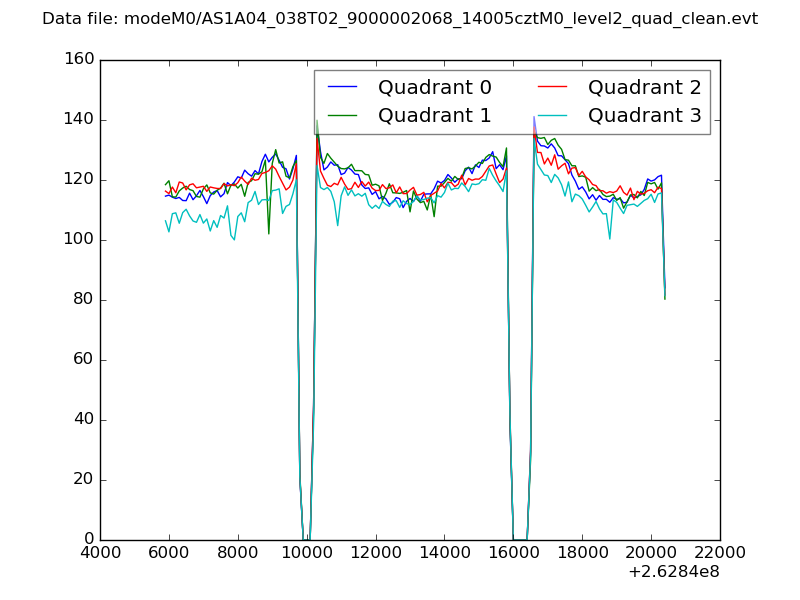 |
|
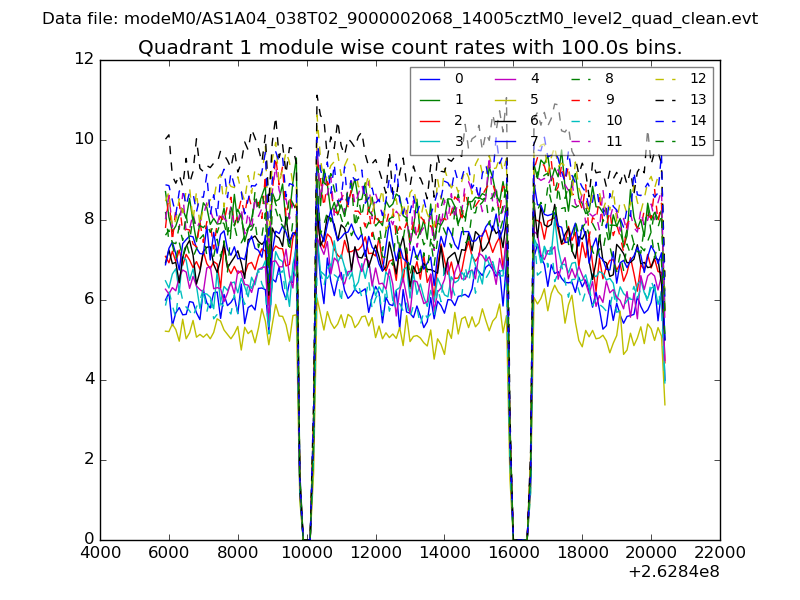
| Module-wise count rates for Quadrant A Data is divided into 100 sec bins |
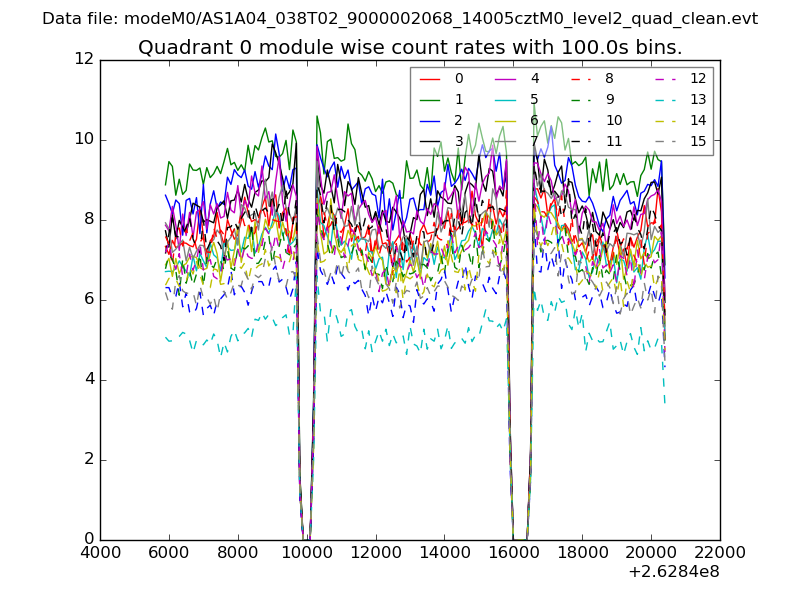 |
 |
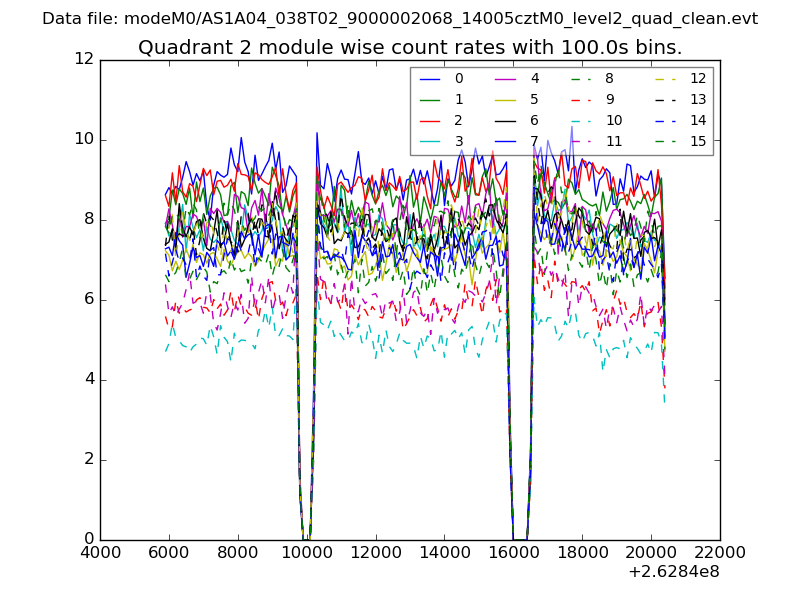
| Module-wise count rates for Quadrant B Data is divided into 100 sec bins |
 |
 |
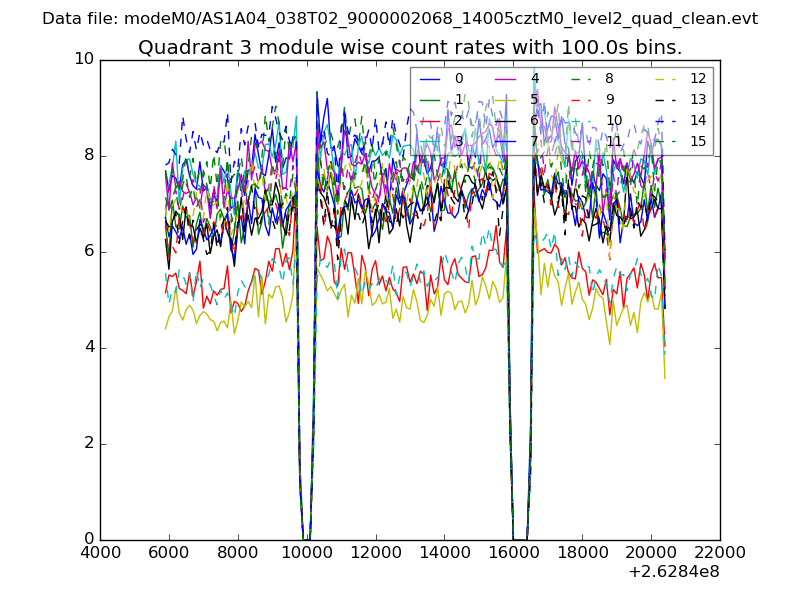
| Module-wise count rates for Quadrant C Data is divided into 100 sec bins |
 |
 |
| Module-wise count rates for Quadrant D Data is divided into 100 sec bins |
 |
 |
| Parameter | Plot |
|---|---|
| CZT HV Monitor | 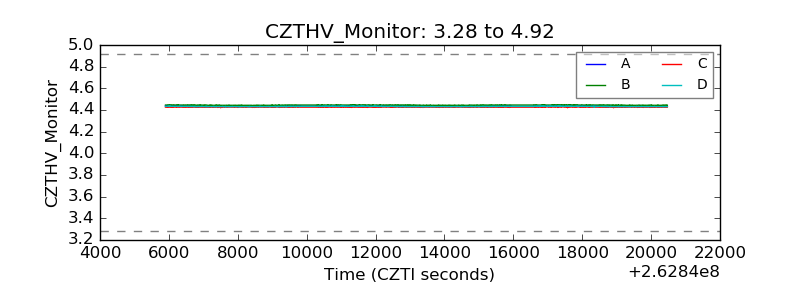 |
| D_VDD |  |
| Temperature 1 | 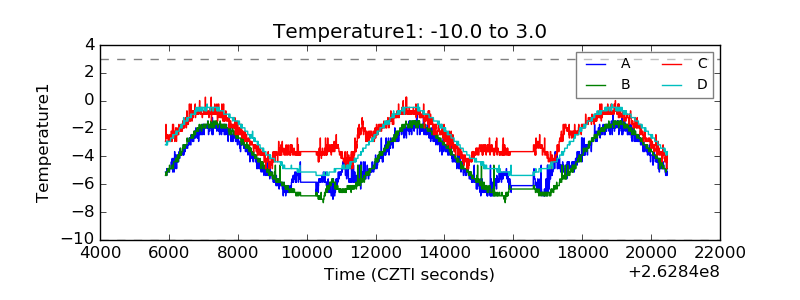 |
| Veto HV Monitor |  |
| Veto LLD | 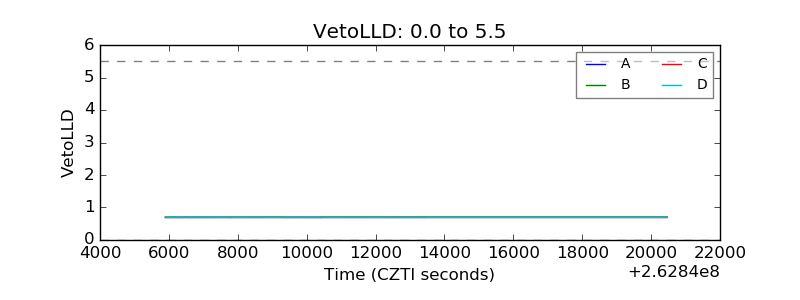 |
| Alpha Counter | 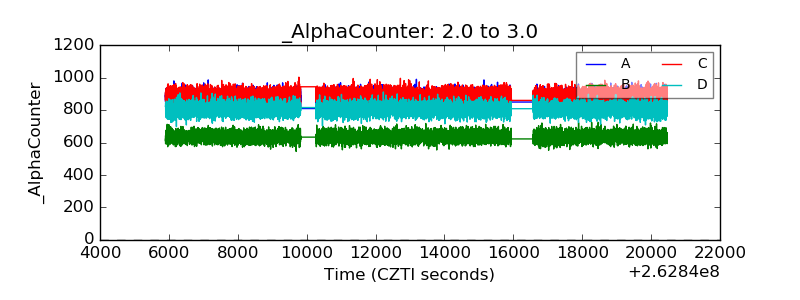 |
| _CPM_Rate | 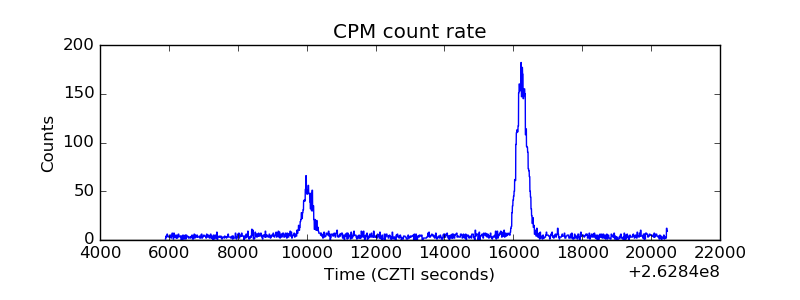 |
| CZT Counter | 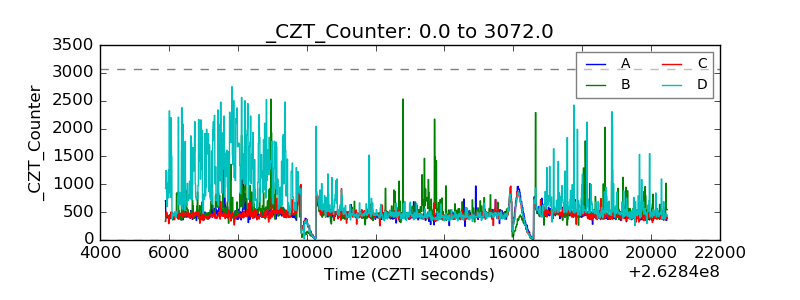 |
| +2.5 Volts monitor |  |
| +5 Volts monitor |  |
| _ROLL_ROT | 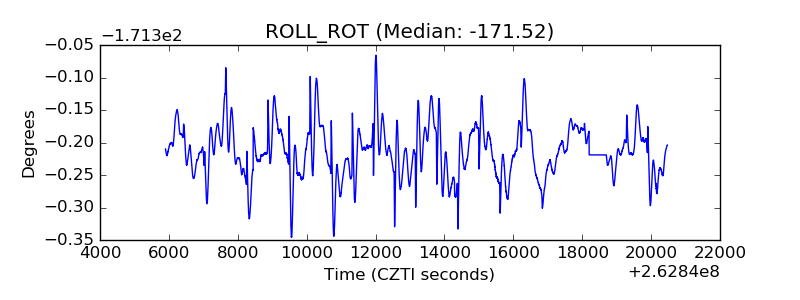 |
| _Roll_DEC | 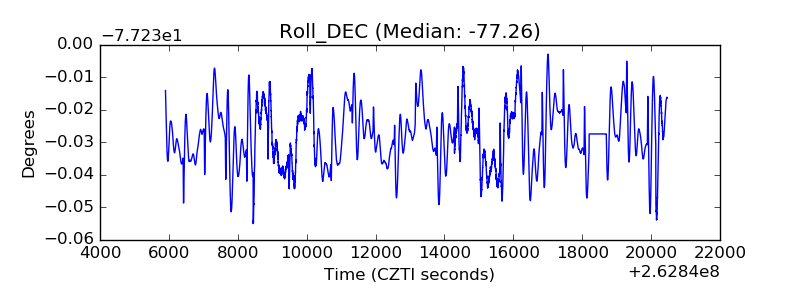 |
| _Roll_RA |  |
| Veto Counter | 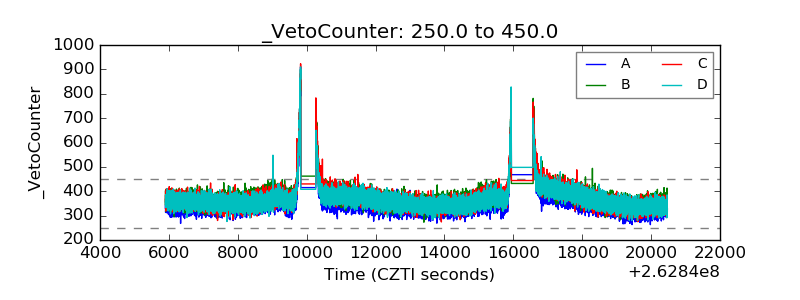 |