| Param | Original file | Final file |
|---|---|---|
| Filename | modeM0/AS1A04_075T05_9000002066cztM0_level2.fits | modeM0/AS1A04_075T05_9000002066cztM0_level2_quad_clean.evt |
| Size (bytes) | 125,328,960 | 93,643,200 |
| Size | 119.5 MB | 89.3 MB |
| Events in quadrant A | 776,938 | 516,628 |
| Events in quadrant B | 742,486 | 515,555 |
| Events in quadrant C | 755,716 | 491,820 |
| Events in quadrant D | 635,372 | 425,749 |
| Mode M9 | |||
|---|---|---|---|
| Quadrant | BADHDUFLAG | Total packets | Discarded packets |
| A | 0 | 30 | 0 |
| B | 0 | 30 | 0 |
| C | 0 | 30 | 0 |
| D | 0 | 30 | 0 |
| Mode SS | |||
|---|---|---|---|
| Quadrant | BADHDUFLAG | Total packets | Discarded packets |
| A | 0 | 260 | 0 |
| B | 0 | 260 | 0 |
| C | 0 | 260 | 0 |
| D | 0 | 260 | 0 |
| Mode M0 | |||
|---|---|---|---|
| Quadrant | BADHDUFLAG | Total packets | Discarded packets |
| A | 0 | 27167 | 0 |
| B | 0 | 28329 | 0 |
| C | 0 | 27115 | 0 |
| D | 0 | 39302 | 0 |
| Quadrant | Total seconds | Saturated seconds | Saturation percentage |
|---|---|---|---|
| A | 12807 | 126 | 0.983837% |
| B | 12807 | 158 | 1.233700% |
| C | 12807 | 73 | 0.570001% |
| D | 12807 | 784 | 6.121652% |
Noise dominated data is calculated using 1-second bins in cleaned event files. If a bin has >2000 counts, and if more than 50% of those come from <1% of pixels, then it is considered to be noise-dominated and hence unusable.
| Quadrant | # 1 sec bins | Bins with >0 counts | Bins with >2000 counts | High rate bins dominated by noise | Noise dominated (total time) | Noise dominated (detector-on time) | Marked lightcurve |
|---|---|---|---|---|---|---|---|
| A | 15061 | 12806 | 0 | 0 | 0.00% | 0.00% |  |
| B | 15061 | 12806 | 0 | 0 | 0.00% | 0.00% |  |
| C | 15061 | 12805 | 0 | 0 | 0.00% | 0.00% | 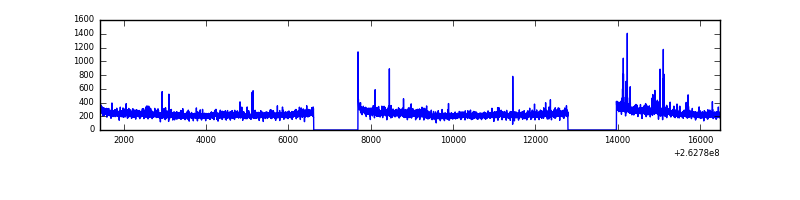 |
| D | 15061 | 12801 | 0 | 0 | 0.00% | 0.00% |  |
Top three noisy pixels from each quadrant. If the there are fewer than three noisy pixels in the level2.evt file, extra rows are filled as -1
| Pixel properties | Quadrant properties | ||||||
|---|---|---|---|---|---|---|---|
| Quadrant | DetID | PixID | Counts | Sigma | Mean | Median | Sigma |
| A | 0 | 29 | 702 | 10.02 | 201 | 189 | 51.2 |
| A | 7 | 110 | 656 | 9.12 | 201 | 189 | 51.2 |
| A | 14 | 79 | 574 | 7.52 | 201 | 189 | 51.2 |
| B | 2 | 9 | 636 | 10.98 | 196 | 187 | 40.9 |
| B | 5 | 128 | 535 | 8.51 | 196 | 187 | 40.9 |
| B | 14 | 254 | 489 | 7.39 | 196 | 187 | 40.9 |
| C | 1 | 81 | 527 | 6.38 | 199 | 186 | 53.5 |
| C | 12 | 241 | 505 | 5.97 | 199 | 186 | 53.5 |
| C | 7 | 233 | 502 | 5.91 | 199 | 186 | 53.5 |
| D | 10 | 189 | 459 | 5.87 | 181 | 165 | 50.1 |
| D | 6 | 231 | 459 | 5.87 | 181 | 165 | 50.1 |
| D | 3 | 14 | 449 | 5.67 | 181 | 165 | 50.1 |
Histogram calculated using DETX and DETY for each event in the final _common_clean file
| Quadrant A | 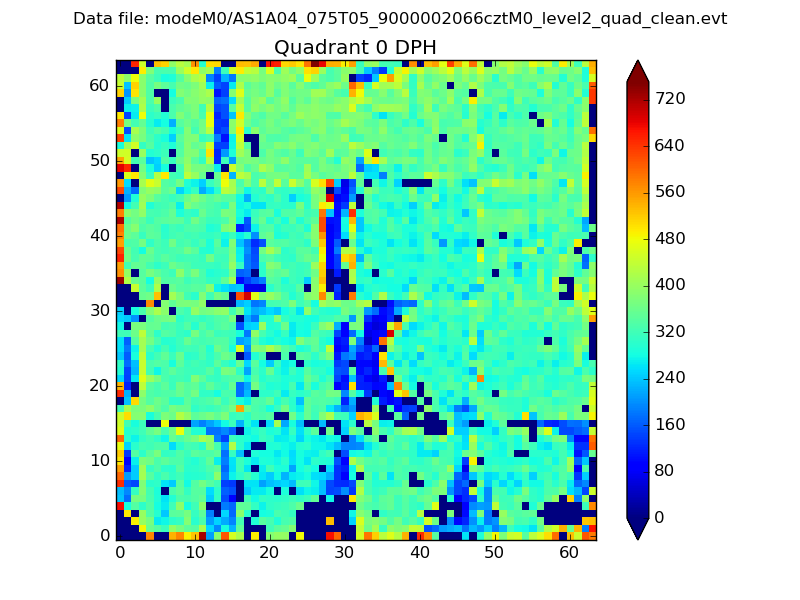 |
 |
Quadrant B |
|---|---|---|---|
| Quadrant D | 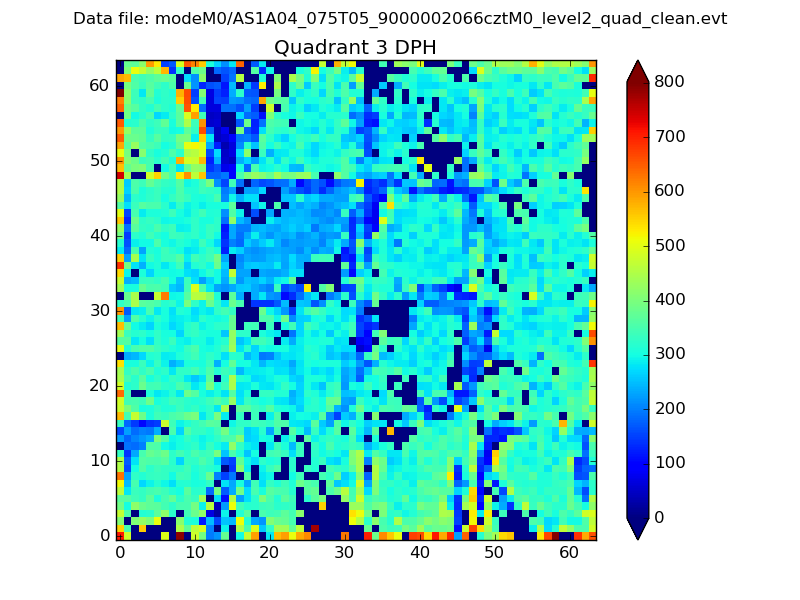 |
 |
Quadrant C |
| Plot type | Count rate plots | Images |
|---|---|---|
| Comparison with Poisson distribution Blue bars denote a histogram of data divided into 1 sec bins. Red curve is a Poisson curve with rate = median count rate of data. |
 |
 |
| Quadrant-wise count rates Data is divided into 100 sec bins |
 |
|
| Module-wise count rates for Quadrant A Data is divided into 100 sec bins |
 |
 |
| Module-wise count rates for Quadrant B Data is divided into 100 sec bins |
 |
 |
| Module-wise count rates for Quadrant C Data is divided into 100 sec bins |
 |
 |
| Module-wise count rates for Quadrant D Data is divided into 100 sec bins |
 |
 |
| Parameter | Plot |
|---|---|
| CZT HV Monitor |  |
| D_VDD | 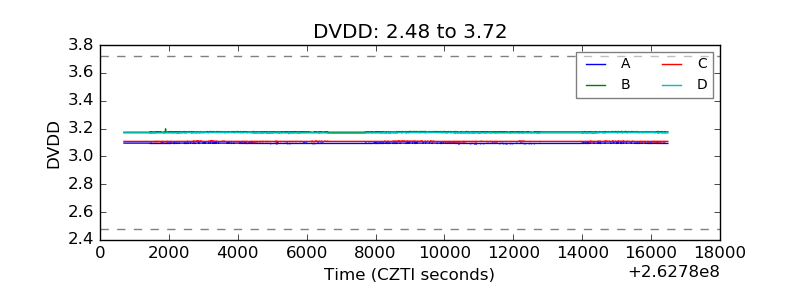 |
| Temperature 1 | 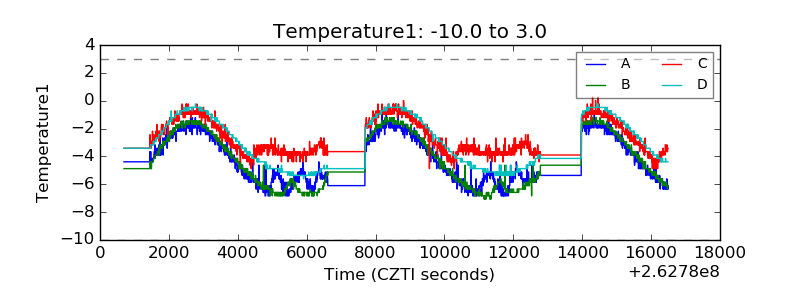 |
| Veto HV Monitor | 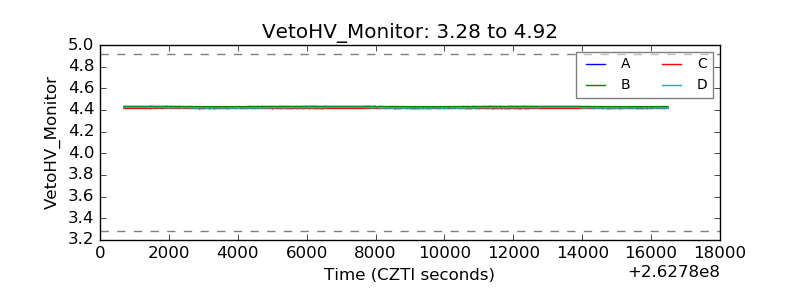 |
| Veto LLD | 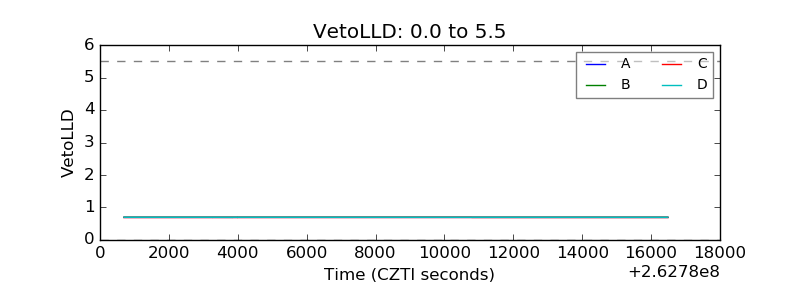 |
| Alpha Counter |  |
| _CPM_Rate | 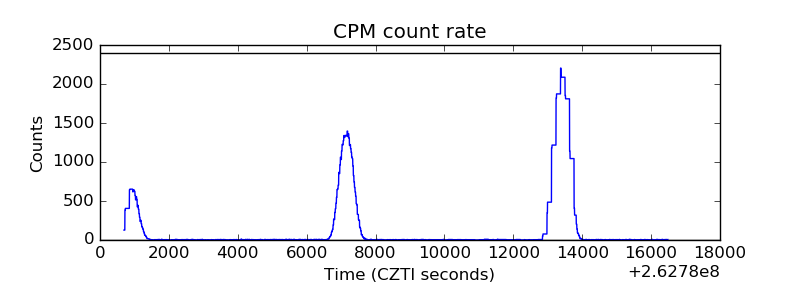 |
| CZT Counter | 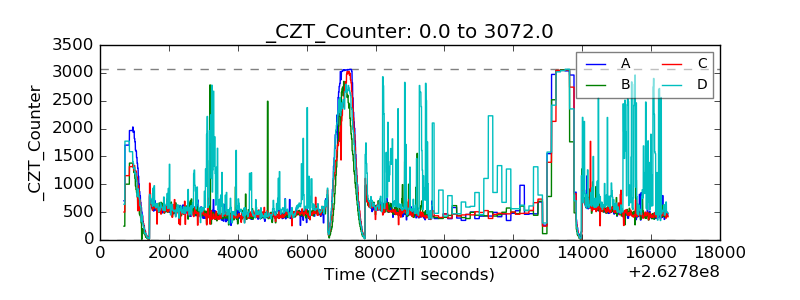 |
| +2.5 Volts monitor |  |
| +5 Volts monitor |  |
| _ROLL_ROT | 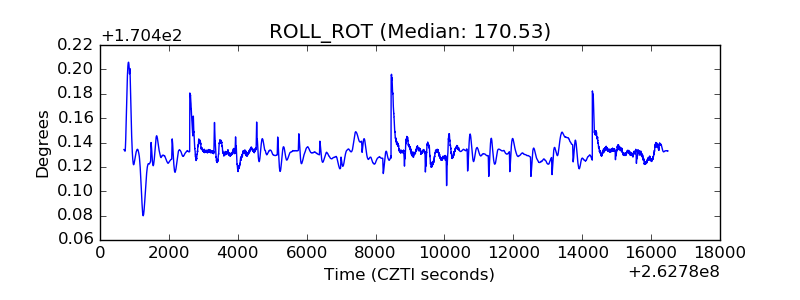 |
| _Roll_DEC |  |
| _Roll_RA |  |
| Veto Counter |  |