| Param | Original file | Final file |
|---|---|---|
| Filename | modeM0/AS1A04_075T05_9000002066_13991cztM0_level2.evt | modeM0/AS1A04_075T05_9000002066_13991cztM0_level2_quad_clean.evt |
| Size (bytes) | 122,114,880 | 31,406,400 |
| Size | 116.5 MB | 30.0 MB |
| Events in quadrant A | 845,719 | 211,299 |
| Events in quadrant B | 902,532 | 214,032 |
| Events in quadrant C | 831,039 | 208,980 |
| Events in quadrant D | 1,010,501 | 201,304 |
| Mode M9 | |||
|---|---|---|---|
| Quadrant | BADHDUFLAG | Total packets | Discarded packets |
| A | 0 | 8 | 0 |
| B | 0 | 8 | 0 |
| C | 0 | 8 | 0 |
| D | 0 | 8 | 0 |
| Mode SS | |||
|---|---|---|---|
| Quadrant | BADHDUFLAG | Total packets | Discarded packets |
| A | 0 | 30 | 0 |
| B | 0 | 30 | 0 |
| C | 0 | 30 | 0 |
| D | 0 | 30 | 0 |
| Mode M0 | |||
|---|---|---|---|
| Quadrant | BADHDUFLAG | Total packets | Discarded packets |
| A | 0 | 3434 | 2 |
| B | 0 | 3629 | 1 |
| C | 0 | 3358 | 1 |
| D | 0 | 4044 | 1 |
| Quadrant | Total seconds | Saturated seconds | Saturation percentage |
|---|---|---|---|
| A | 1560 | 7 | 0.448718% |
| B | 1560 | 12 | 0.769231% |
| C | 1560 | 2 | 0.128205% |
| D | 1560 | 18 | 1.153846% |
Noise dominated data is calculated using 1-second bins in cleaned event files. If a bin has >2000 counts, and if more than 50% of those come from <1% of pixels, then it is considered to be noise-dominated and hence unusable.
| Quadrant | # 1 sec bins | Bins with >0 counts | Bins with >2000 counts | High rate bins dominated by noise | Noise dominated (total time) | Noise dominated (detector-on time) | Marked lightcurve |
|---|---|---|---|---|---|---|---|
| A | 1561 | 1561 | 0 | 0 | 0.00% | 0.00% | 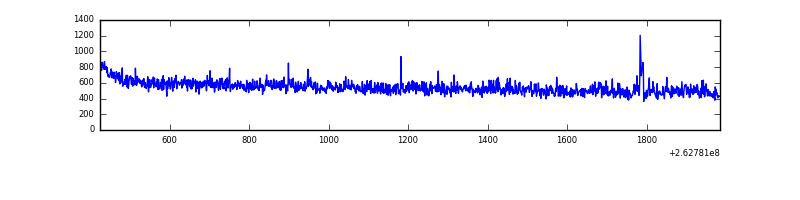 |
| B | 1561 | 1561 | 4 | 4 | 0.26% | 0.26% | 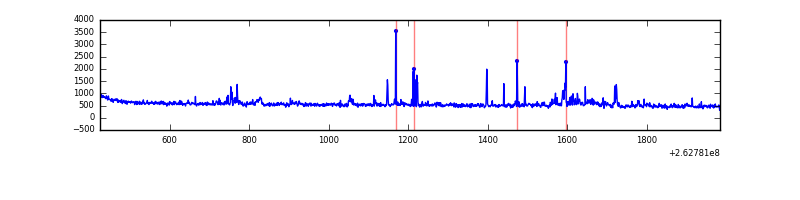 |
| C | 1561 | 1561 | 0 | 0 | 0.00% | 0.00% | 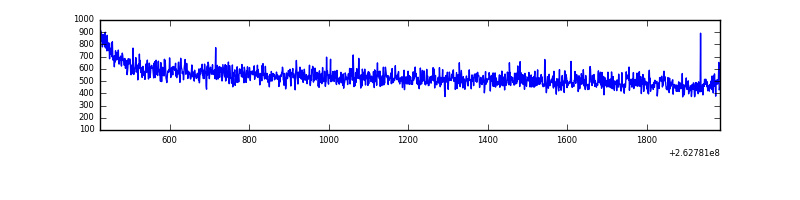 |
| D | 1561 | 1561 | 8 | 8 | 0.51% | 0.51% | 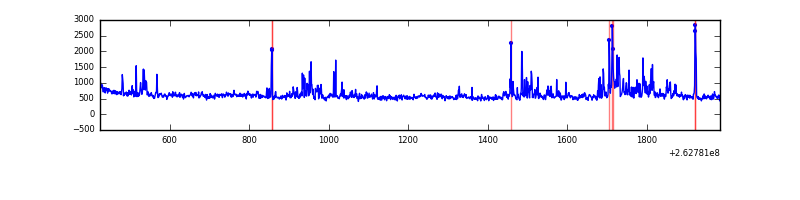 |
Top three noisy pixels from each quadrant. If the there are fewer than three noisy pixels in the level2.evt file, extra rows are filled as -1
| Pixel properties | Quadrant properties | ||||||
|---|---|---|---|---|---|---|---|
| Quadrant | DetID | PixID | Counts | Sigma | Mean | Median | Sigma |
| A | 8 | 15 | 21396 | 474.98 | 210 | 206 | 44.6 |
| A | 12 | 189 | 5893 | 127.47 | 210 | 206 | 44.6 |
| A | 1 | 162 | 4181 | 89.1 | 210 | 206 | 44.6 |
| B | 0 | 189 | 36027 | 849.35 | 206 | 202 | 42.2 |
| B | 4 | 80 | 14298 | 334.19 | 206 | 202 | 42.2 |
| B | 4 | 142 | 13427 | 313.54 | 206 | 202 | 42.2 |
| C | 3 | 233 | 49395 | 1030.31 | 200 | 200 | 47.7 |
| C | 13 | 61 | 1441 | 25.99 | 200 | 200 | 47.7 |
| C | 3 | 202 | 459 | 5.42 | 200 | 200 | 47.7 |
| D | 13 | 189 | 96065 | 1922.13 | 202 | 197 | 49.9 |
| D | 8 | 195 | 93095 | 1862.59 | 202 | 197 | 49.9 |
| D | 7 | 80 | 20696 | 411.0 | 202 | 197 | 49.9 |
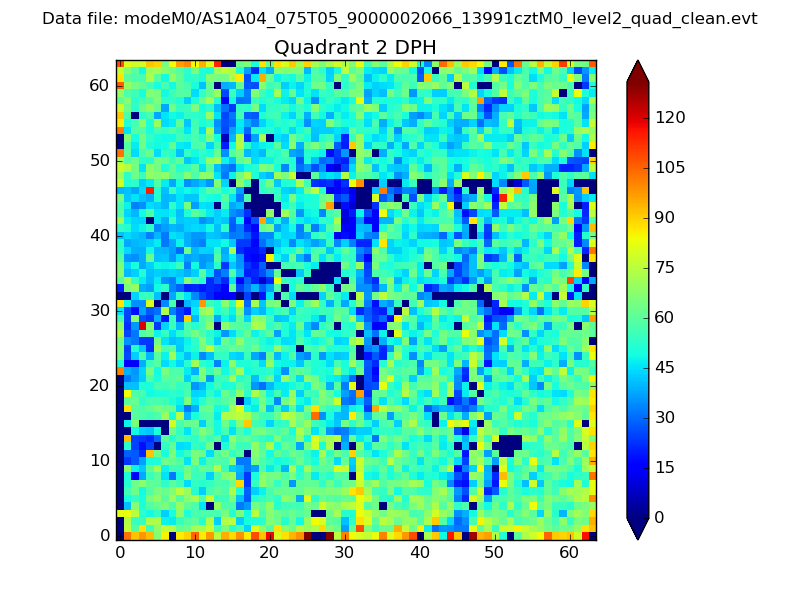
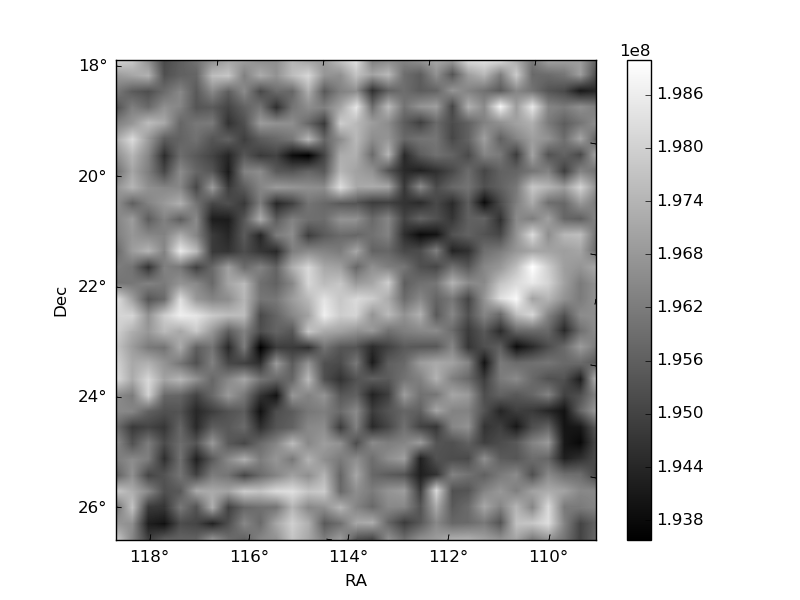
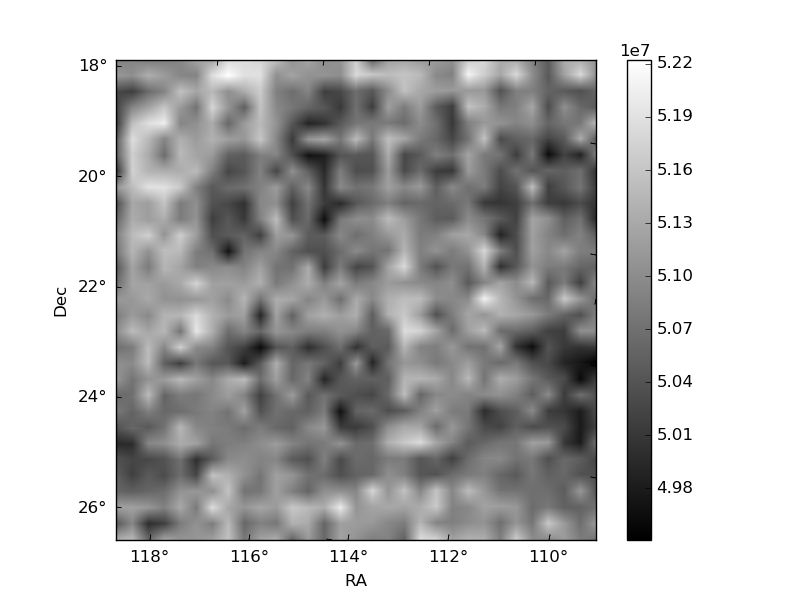
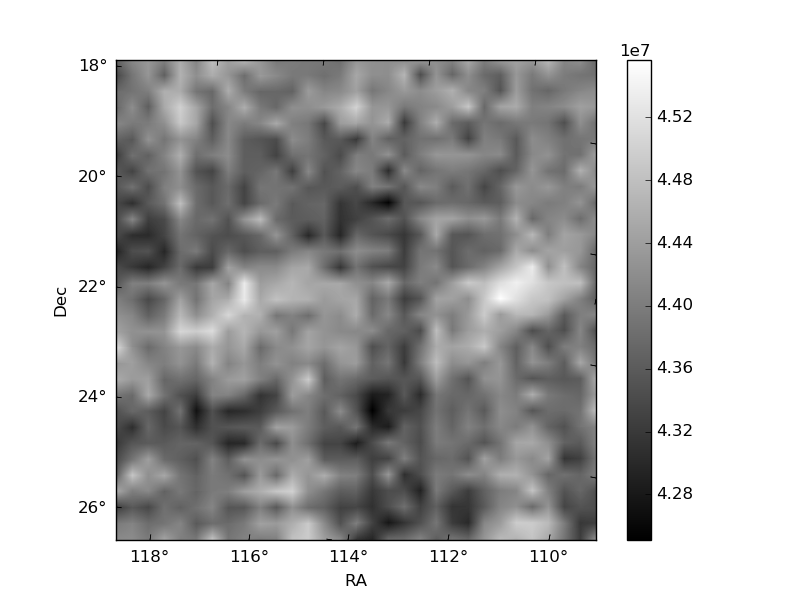
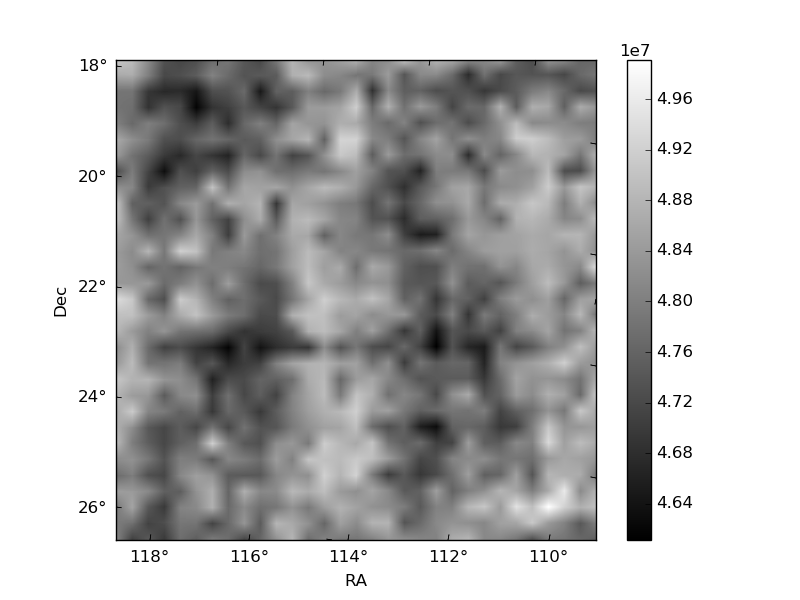
Histogram calculated using DETX and DETY for each event in the final _common_clean file
| Quadrant A | 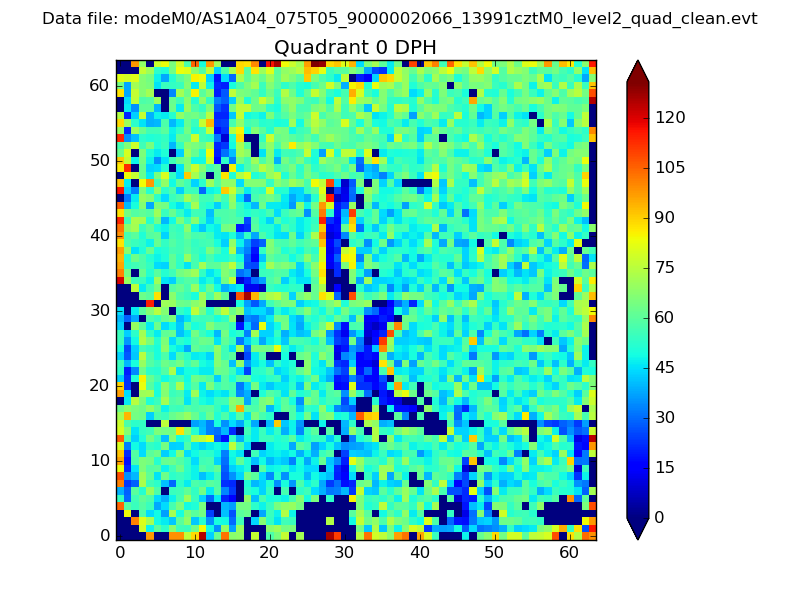 |
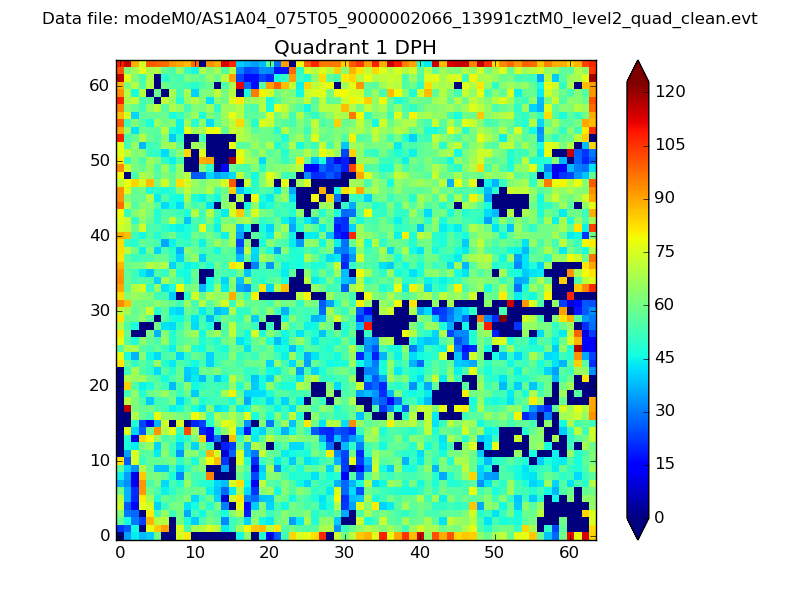 |
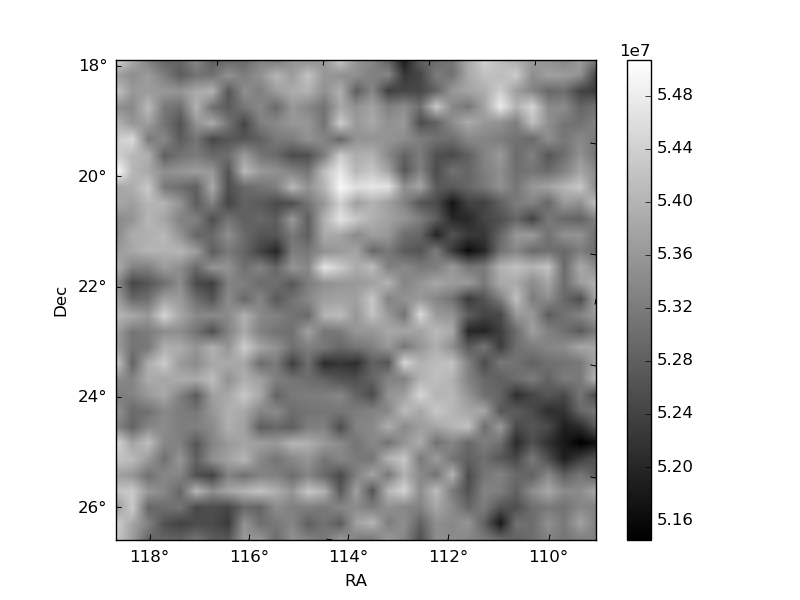
Quadrant B |
|---|---|---|---|
| Quadrant D | 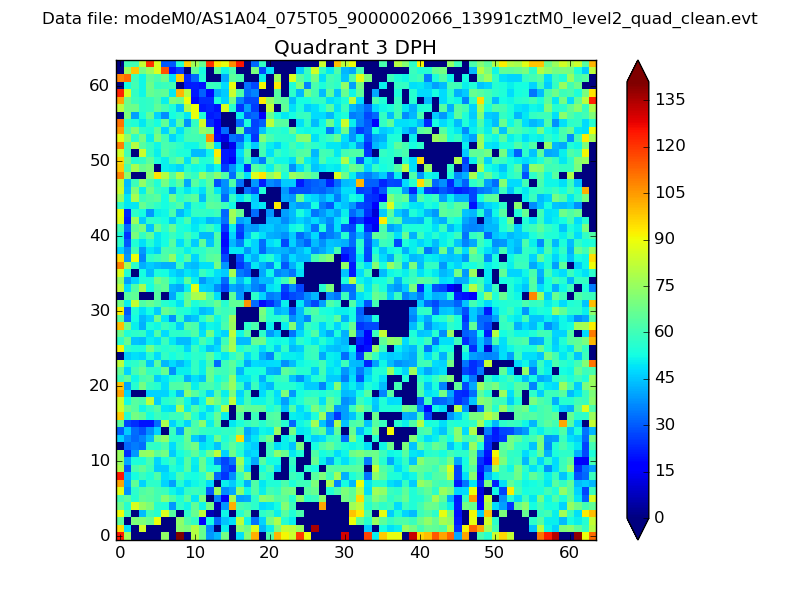 |
 |
Quadrant C |
| Plot type | Count rate plots | Images |
|---|---|---|
| Comparison with Poisson distribution Blue bars denote a histogram of data divided into 1 sec bins. Red curve is a Poisson curve with rate = median count rate of data. |
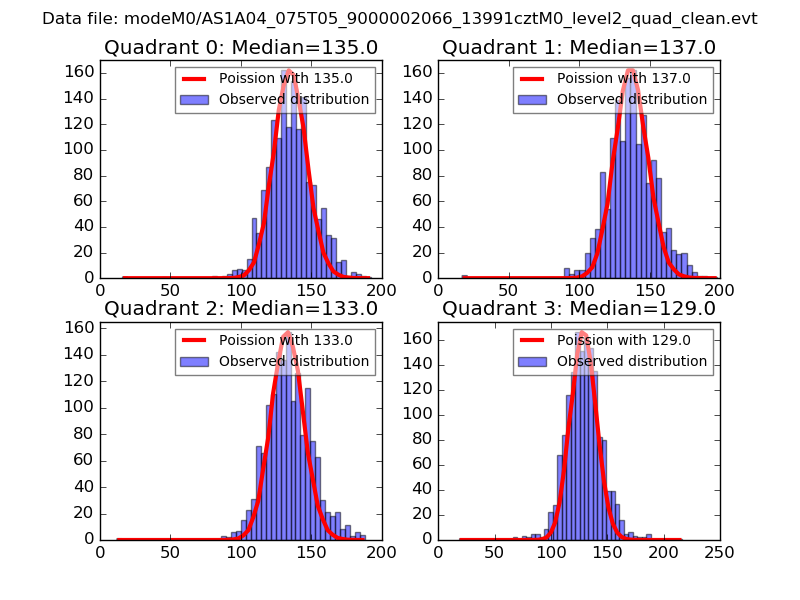 |
 |
| Quadrant-wise count rates Data is divided into 100 sec bins |
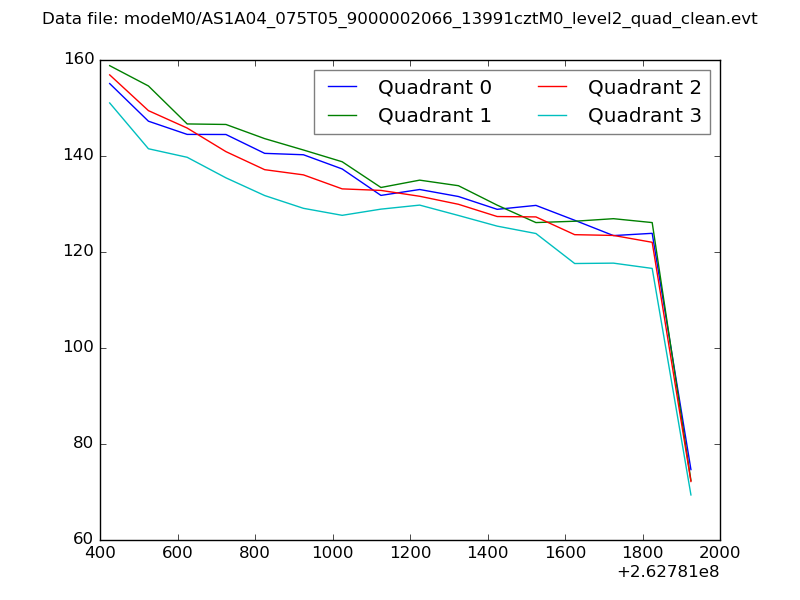 |
|
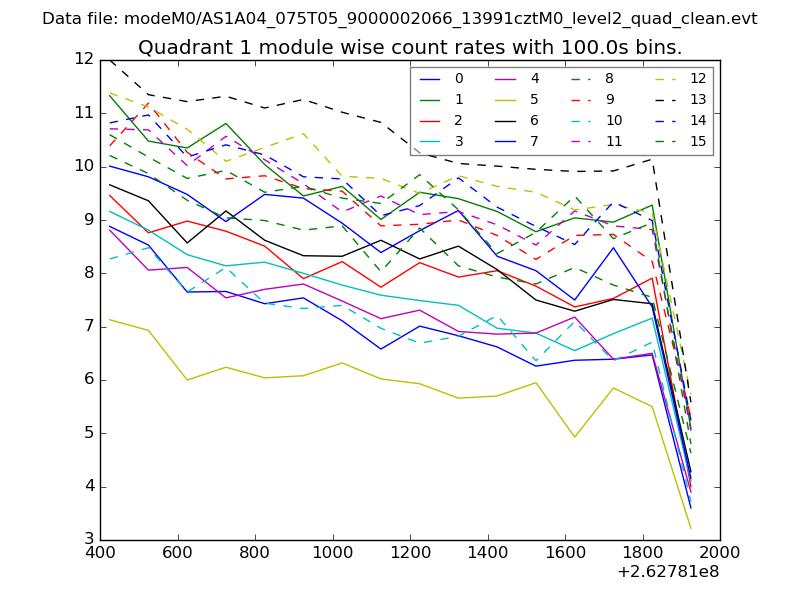
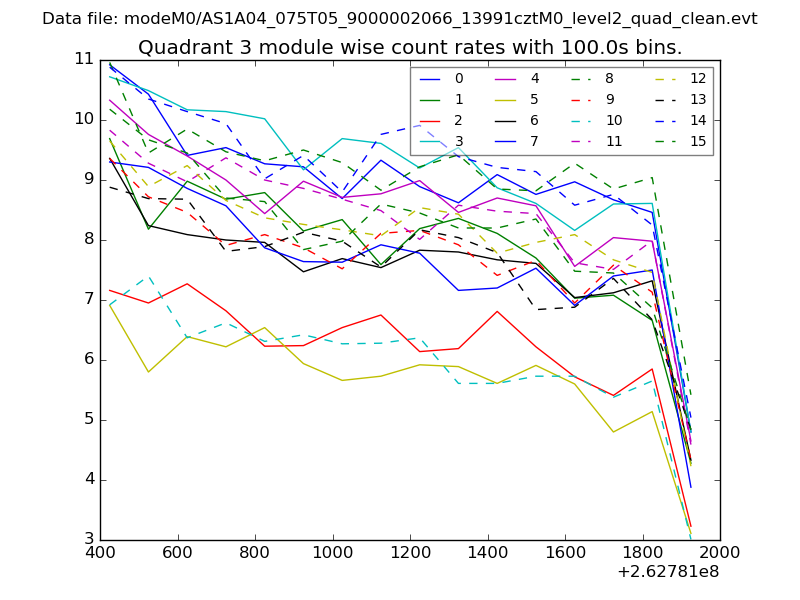
| Module-wise count rates for Quadrant A Data is divided into 100 sec bins |
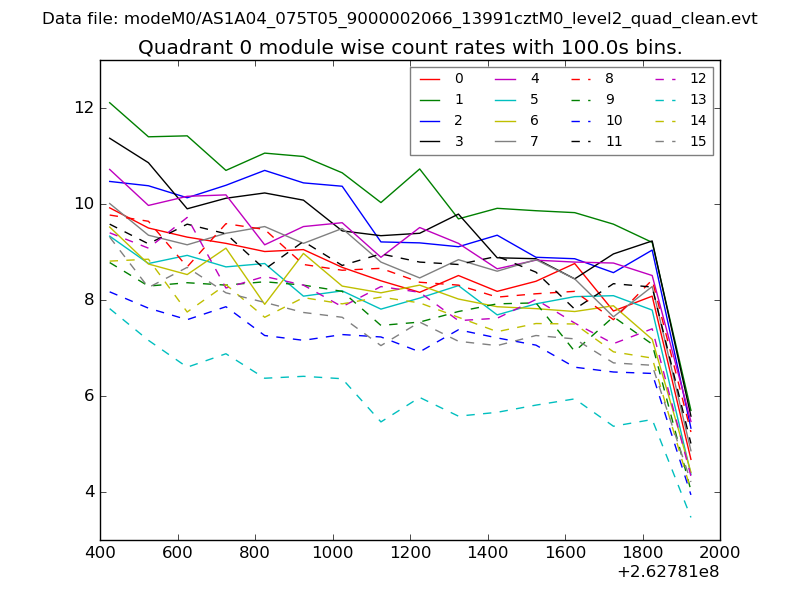 |
 |
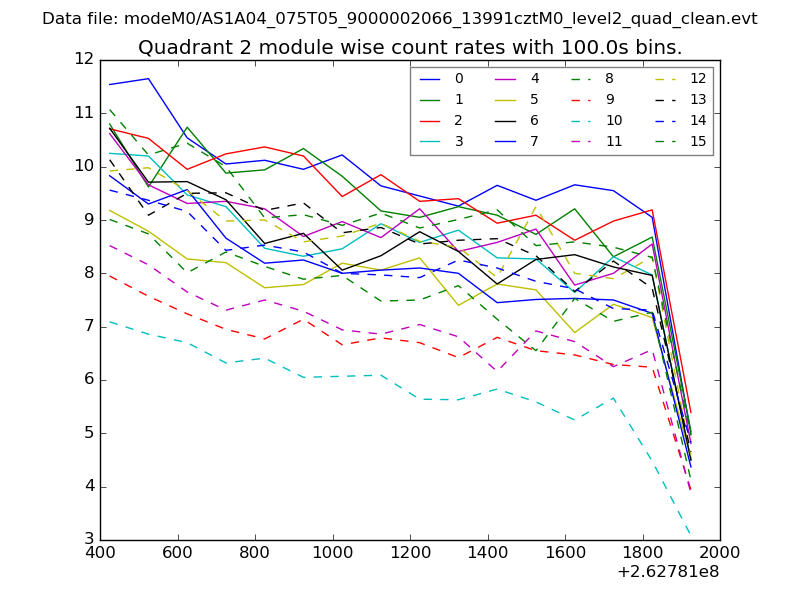
| Module-wise count rates for Quadrant B Data is divided into 100 sec bins |
 |
 |
| Module-wise count rates for Quadrant C Data is divided into 100 sec bins |
 |
 |
| Module-wise count rates for Quadrant D Data is divided into 100 sec bins |
 |
 |
| Parameter | Plot |
|---|---|
| CZT HV Monitor | 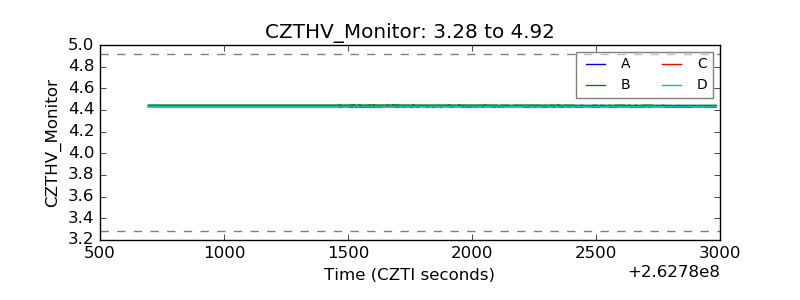 |
| D_VDD | 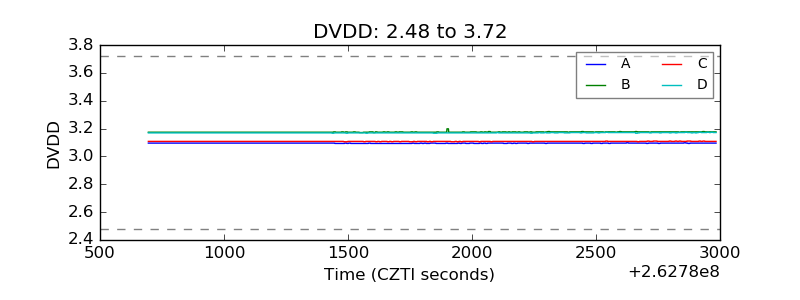 |
| Temperature 1 | 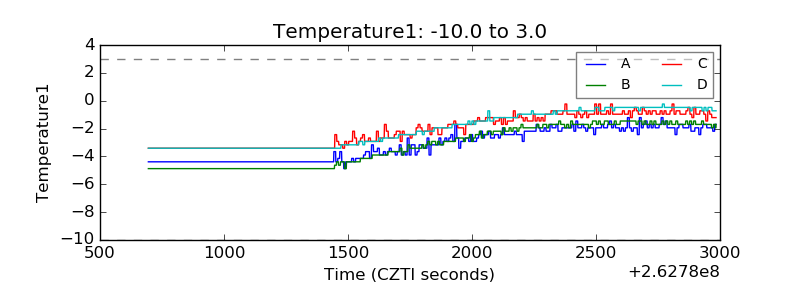 |
| Veto HV Monitor | 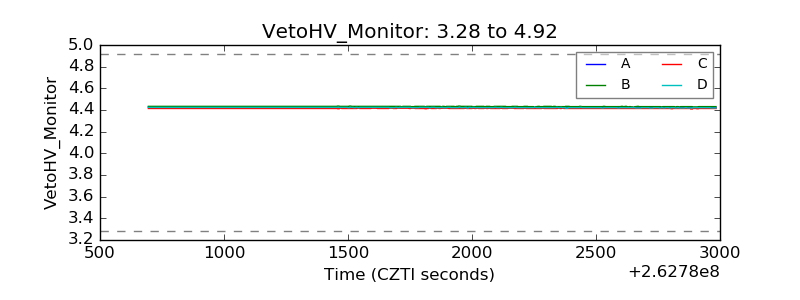 |
| Veto LLD | 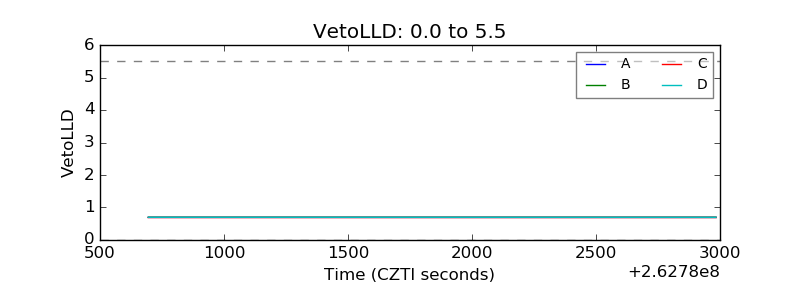 |
| Alpha Counter | 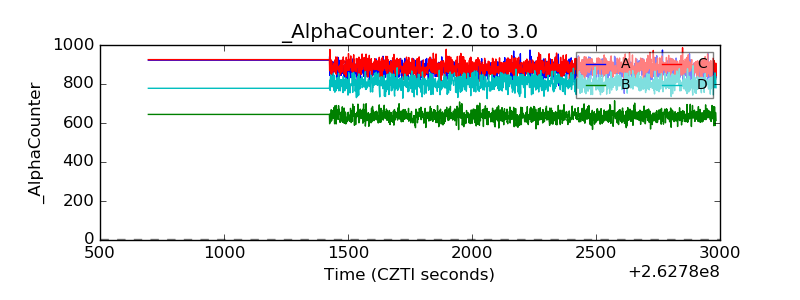 |
| _CPM_Rate | 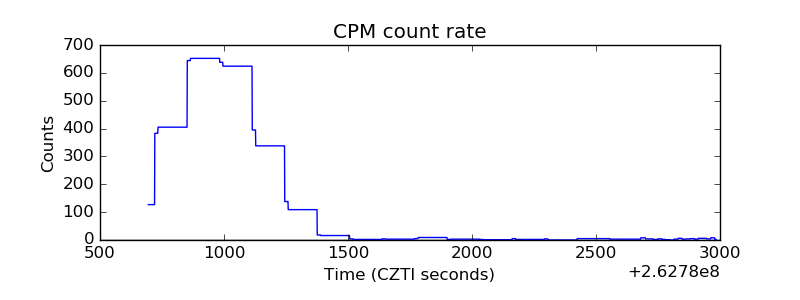 |
| CZT Counter | 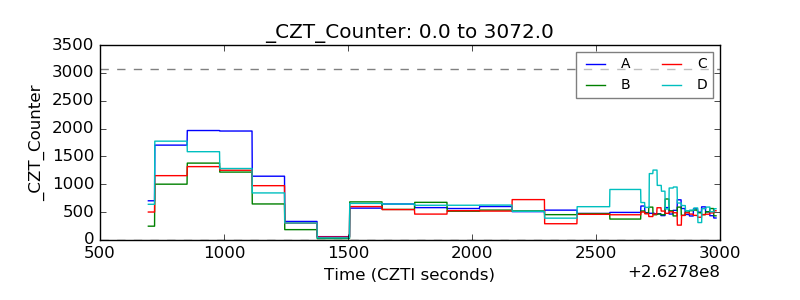 |
| +2.5 Volts monitor |  |
| +5 Volts monitor | 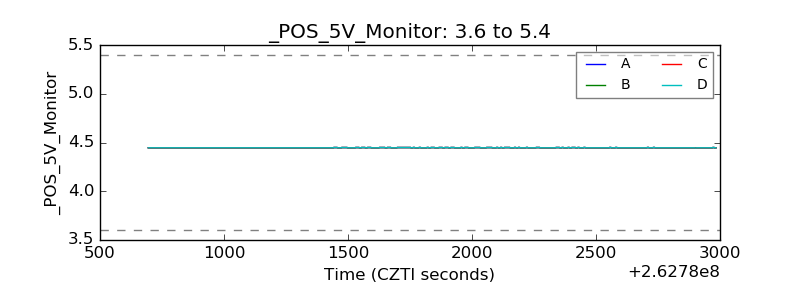 |
| _ROLL_ROT | 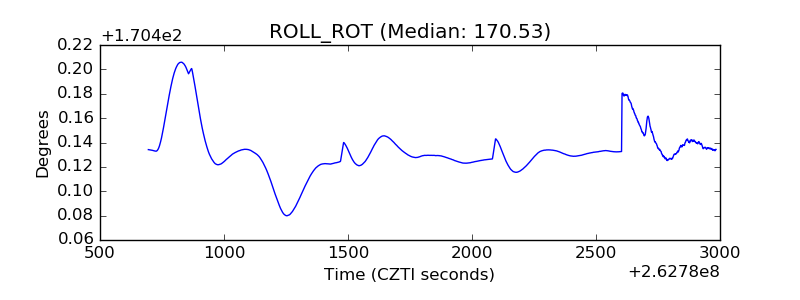 |
| _Roll_DEC | 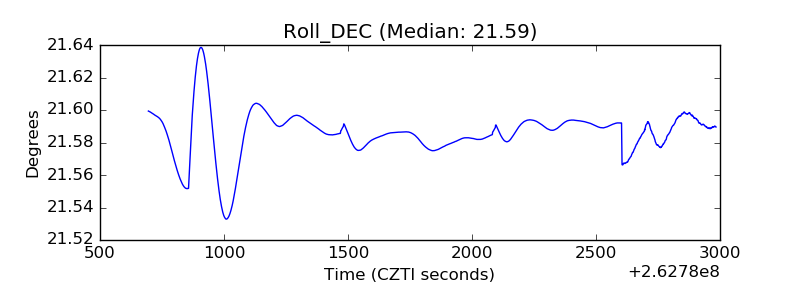 |
| _Roll_RA | 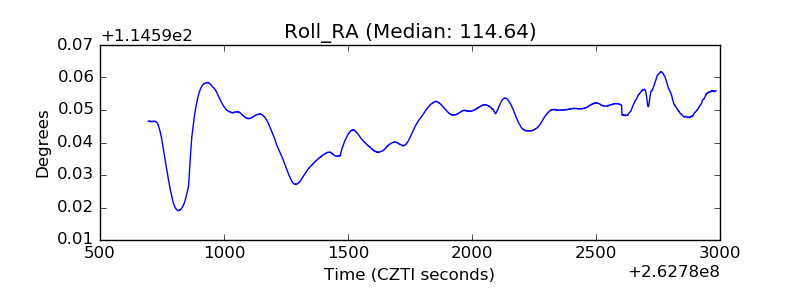 |
| Veto Counter | 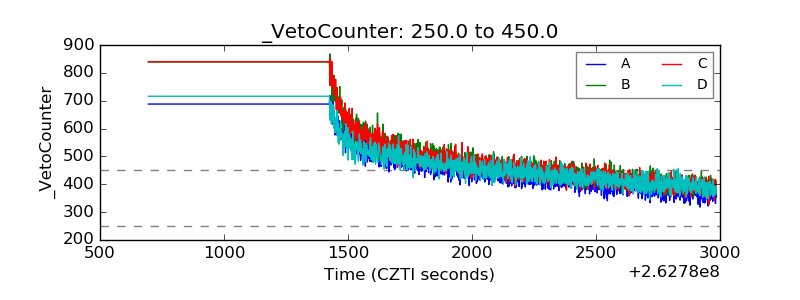 |