| Param | Original file | Final file |
|---|---|---|
| Filename | modeM0/AS1A04_075T05_9000002066_13992cztM0_level2.evt | modeM0/AS1A04_075T05_9000002066_13992cztM0_level2_quad_clean.evt |
| Size (bytes) | 492,837,120 | 99,115,200 |
| Size | 470.0 MB | 94.5 MB |
| Events in quadrant A | 3,231,086 | 647,680 |
| Events in quadrant B | 3,383,642 | 656,023 |
| Events in quadrant C | 3,225,396 | 640,003 |
| Events in quadrant D | 4,642,657 | 602,832 |
| Mode M9 | |||
|---|---|---|---|
| Quadrant | BADHDUFLAG | Total packets | Discarded packets |
| A | 0 | 10 | 0 |
| B | 0 | 10 | 0 |
| C | 0 | 10 | 0 |
| D | 0 | 10 | 0 |
| Mode SS | |||
|---|---|---|---|
| Quadrant | BADHDUFLAG | Total packets | Discarded packets |
| A | 0 | 134 | 0 |
| B | 0 | 134 | 0 |
| C | 0 | 134 | 0 |
| D | 0 | 134 | 0 |
| Mode M0 | |||
|---|---|---|---|
| Quadrant | BADHDUFLAG | Total packets | Discarded packets |
| A | 0 | 13791 | 2 |
| B | 0 | 14344 | 1 |
| C | 0 | 13653 | 1 |
| D | 0 | 18058 | 1 |
| Quadrant | Total seconds | Saturated seconds | Saturation percentage |
|---|---|---|---|
| A | 6520 | 52 | 0.797546% |
| B | 6520 | 67 | 1.027607% |
| C | 6520 | 23 | 0.352761% |
| D | 6520 | 259 | 3.972393% |
Noise dominated data is calculated using 1-second bins in cleaned event files. If a bin has >2000 counts, and if more than 50% of those come from <1% of pixels, then it is considered to be noise-dominated and hence unusable.
| Quadrant | # 1 sec bins | Bins with >0 counts | Bins with >2000 counts | High rate bins dominated by noise | Noise dominated (total time) | Noise dominated (detector-on time) | Marked lightcurve |
|---|---|---|---|---|---|---|---|
| A | 7596 | 6522 | 0 | 0 | 0.00% | 0.00% | 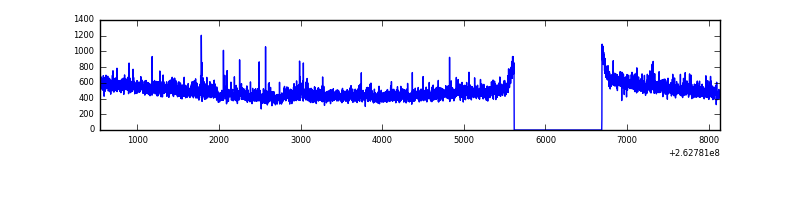 |
| B | 7596 | 6522 | 13 | 13 | 0.17% | 0.20% | 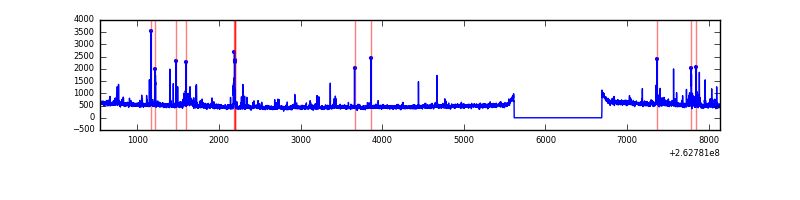 |
| C | 7596 | 6522 | 0 | 0 | 0.00% | 0.00% | 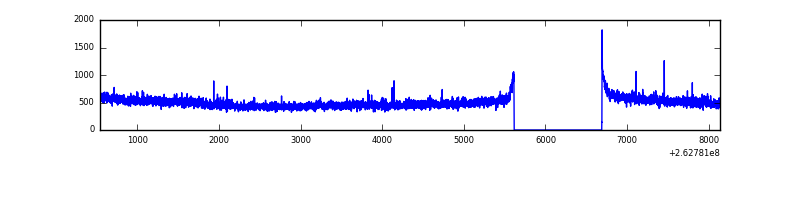 |
| D | 7596 | 6522 | 186 | 186 | 2.45% | 2.85% | 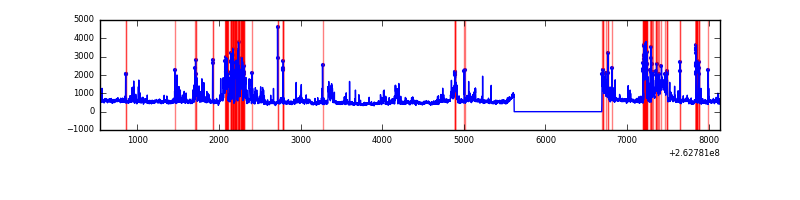 |
Top three noisy pixels from each quadrant. If the there are fewer than three noisy pixels in the level2.evt file, extra rows are filled as -1
| Pixel properties | Quadrant properties | ||||||
|---|---|---|---|---|---|---|---|
| Quadrant | DetID | PixID | Counts | Sigma | Mean | Median | Sigma |
| A | 8 | 15 | 105421 | 638.0 | 803 | 784 | 164.0 |
| A | 12 | 189 | 16900 | 98.26 | 803 | 784 | 164.0 |
| A | 1 | 162 | 13648 | 78.44 | 803 | 784 | 164.0 |
| B | 0 | 189 | 72662 | 471.7 | 797 | 776 | 152.4 |
| B | 0 | 219 | 45717 | 294.89 | 797 | 776 | 152.4 |
| B | 3 | 64 | 44408 | 286.3 | 797 | 776 | 152.4 |
| C | 3 | 233 | 203257 | 1133.44 | 774 | 778 | 178.6 |
| C | 13 | 61 | 5594 | 26.96 | 774 | 778 | 178.6 |
| C | 14 | 234 | 3693 | 16.31 | 774 | 778 | 178.6 |
| D | 8 | 195 | 434931 | 2401.38 | 763 | 745 | 180.8 |
| D | 1 | 52 | 342945 | 1892.63 | 763 | 745 | 180.8 |
| D | 10 | 199 | 302660 | 1669.82 | 763 | 745 | 180.8 |
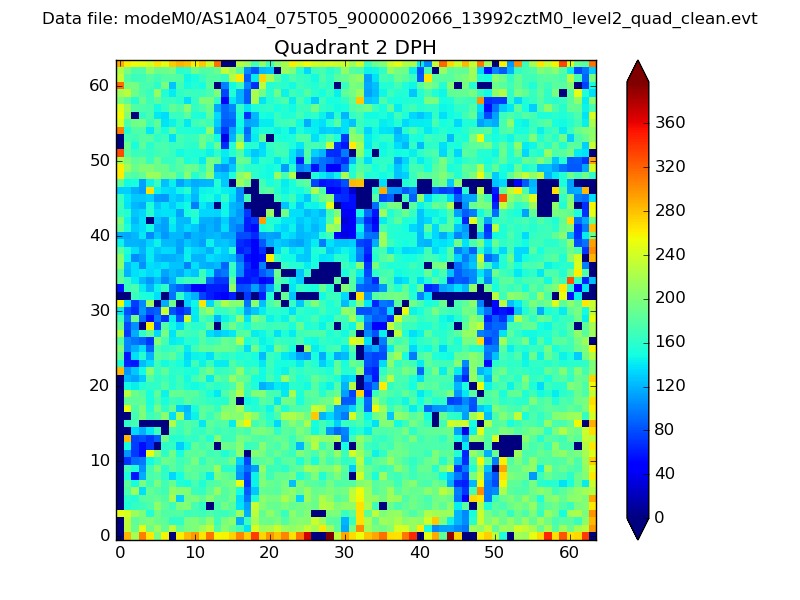
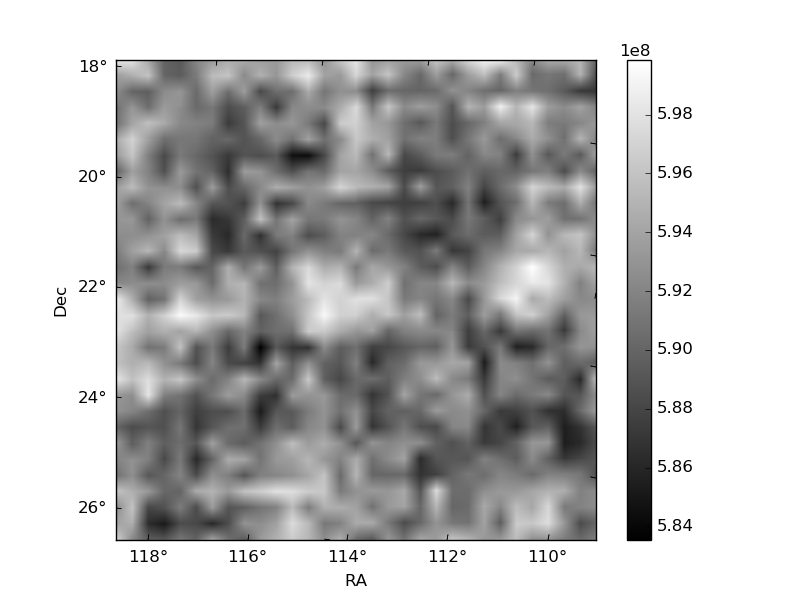
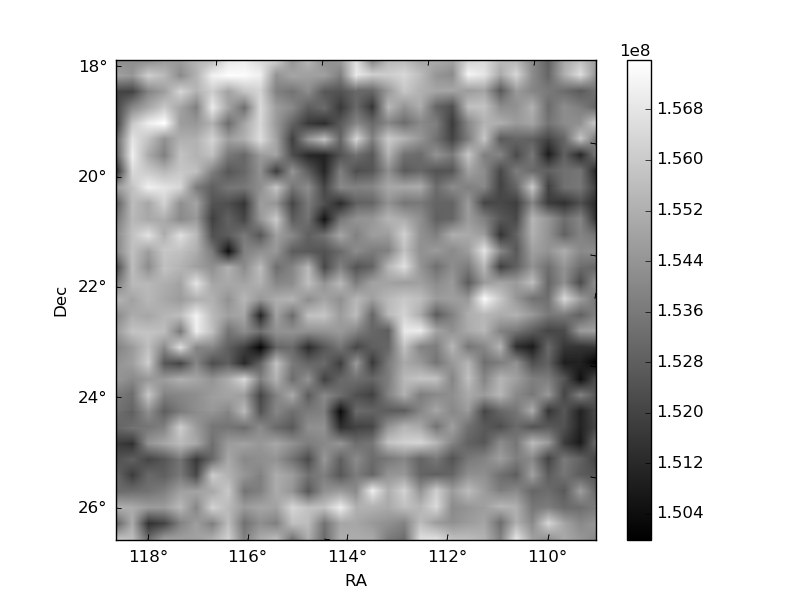
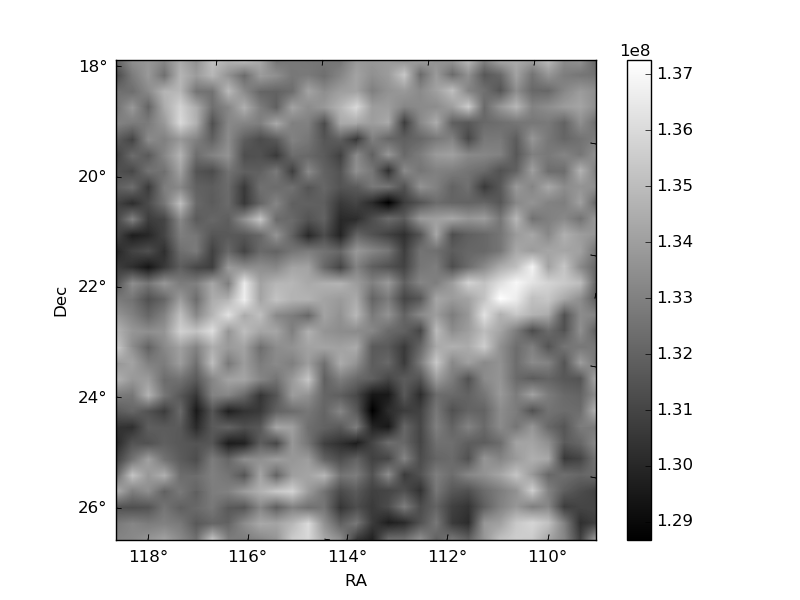
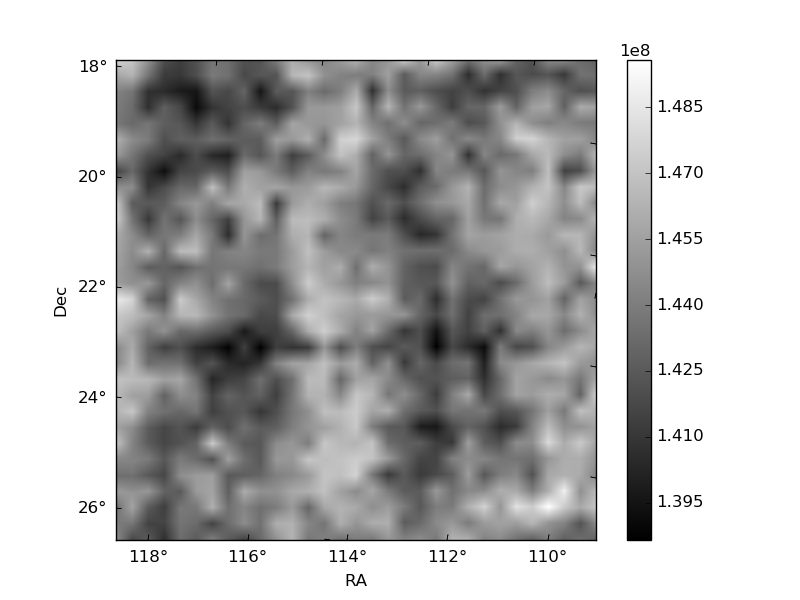
Histogram calculated using DETX and DETY for each event in the final _common_clean file
| Quadrant A | 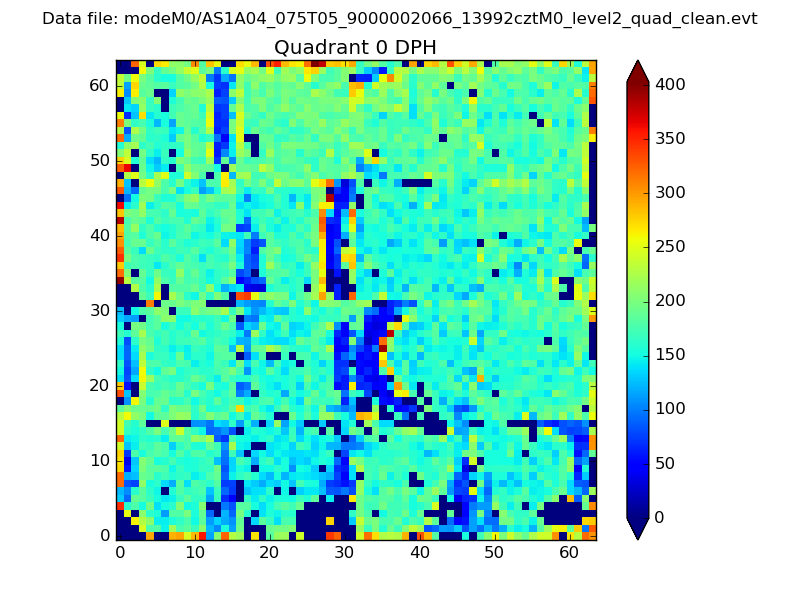 |
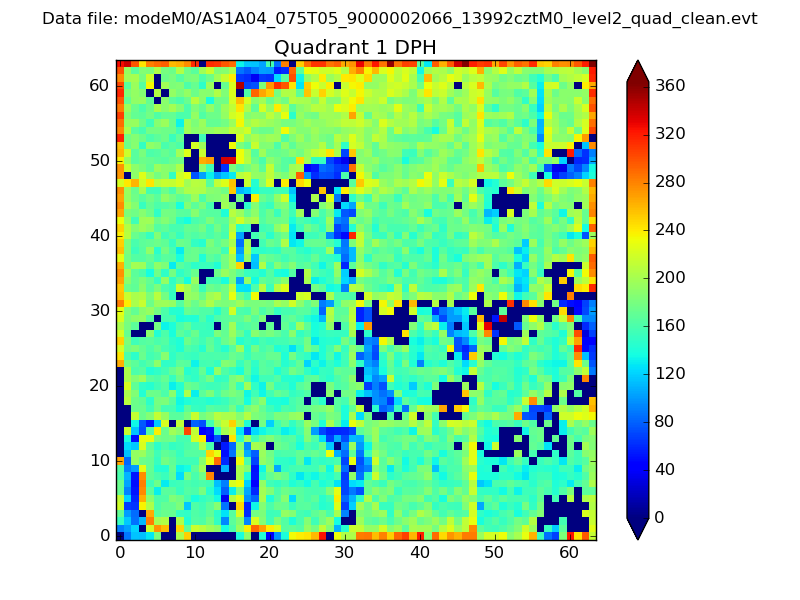 |
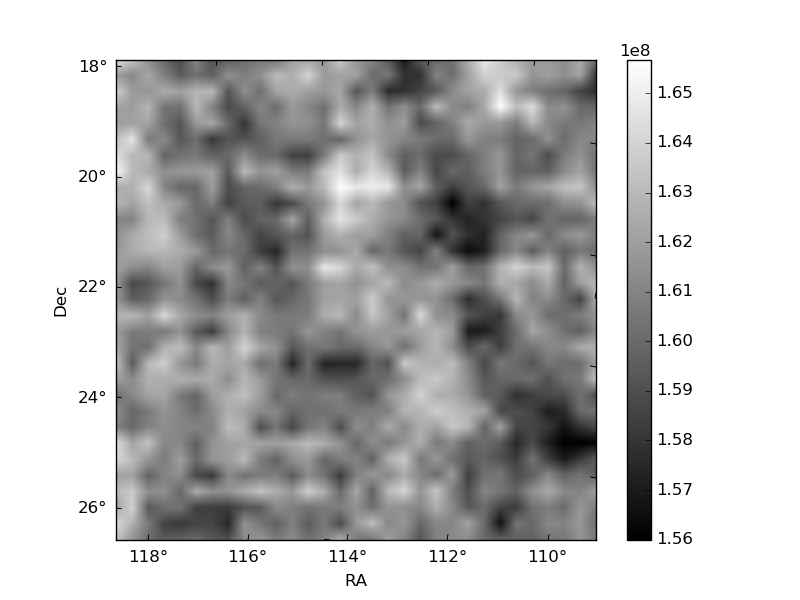
Quadrant B |
|---|---|---|---|
| Quadrant D | 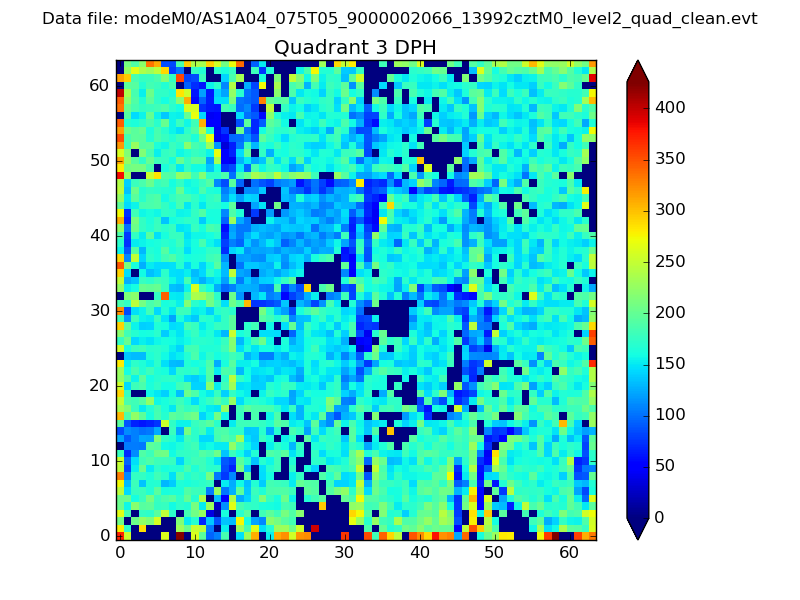 |
 |
Quadrant C |
| Plot type | Count rate plots | Images |
|---|---|---|
| Comparison with Poisson distribution Blue bars denote a histogram of data divided into 1 sec bins. Red curve is a Poisson curve with rate = median count rate of data. |
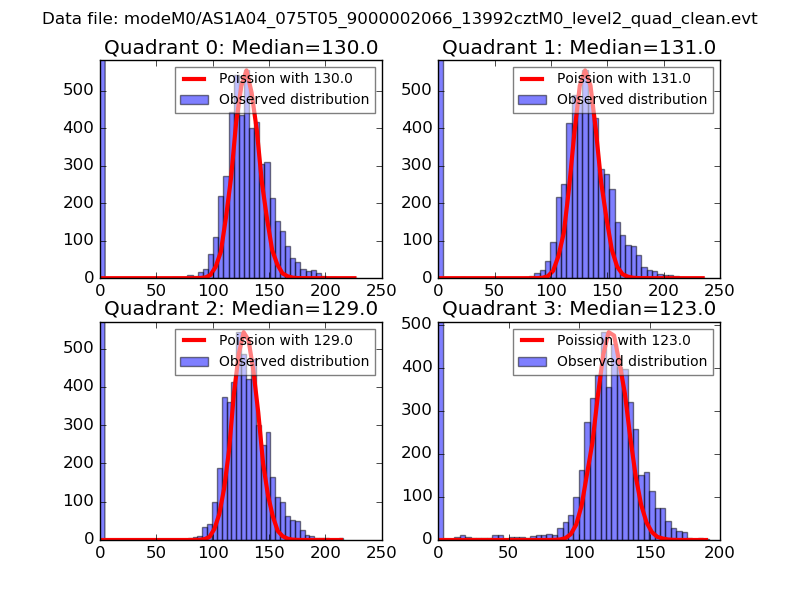 |
 |
| Quadrant-wise count rates Data is divided into 100 sec bins |
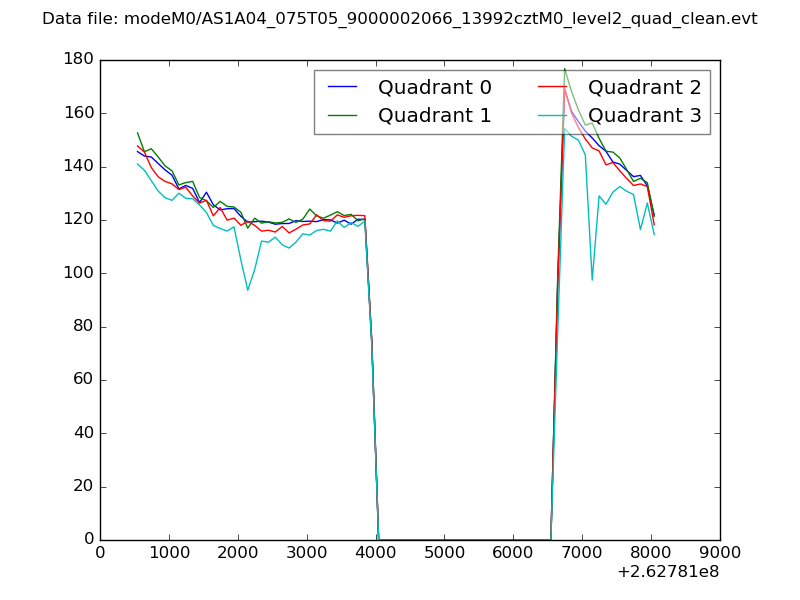 |
|
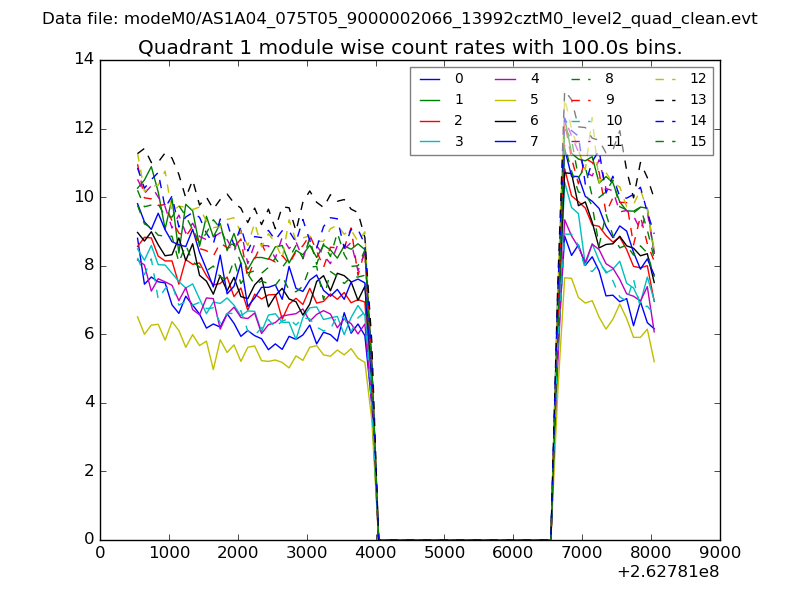
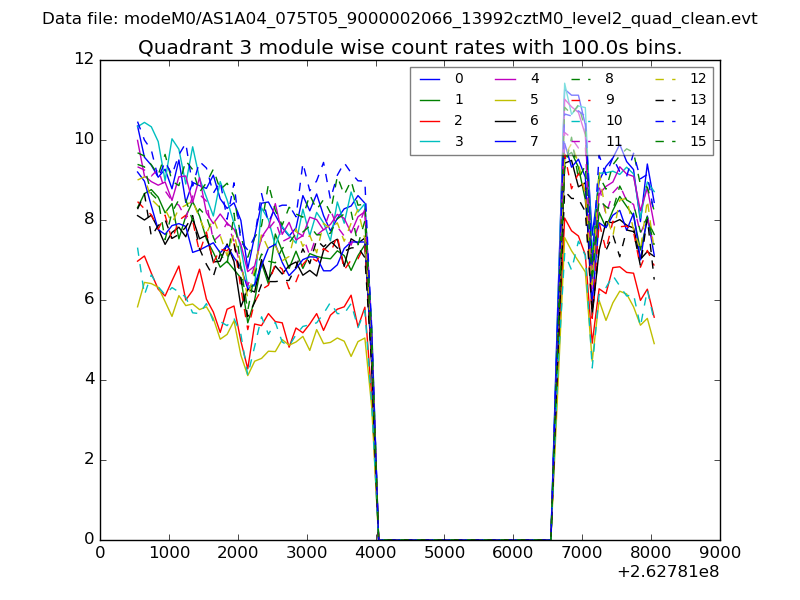
| Module-wise count rates for Quadrant A Data is divided into 100 sec bins |
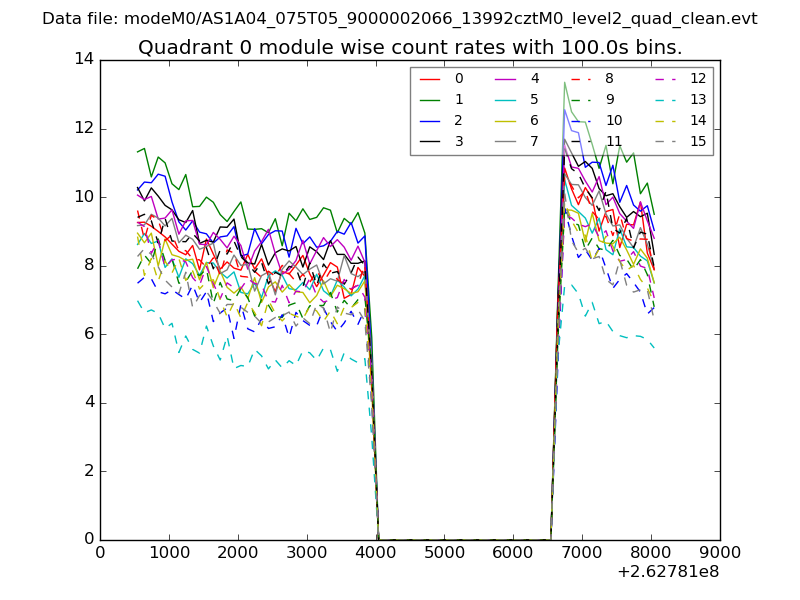 |
 |
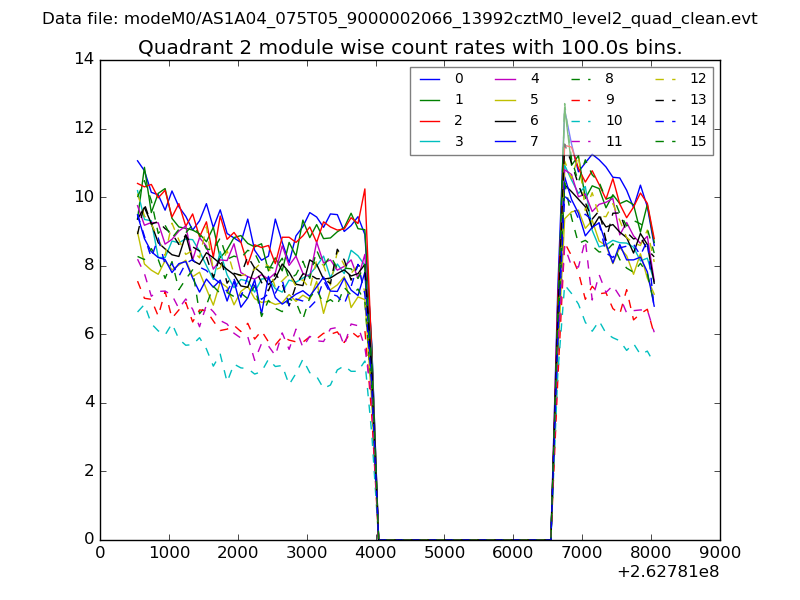
| Module-wise count rates for Quadrant B Data is divided into 100 sec bins |
 |
 |
| Module-wise count rates for Quadrant C Data is divided into 100 sec bins |
 |
 |
| Module-wise count rates for Quadrant D Data is divided into 100 sec bins |
 |
 |
| Parameter | Plot |
|---|---|
| CZT HV Monitor | 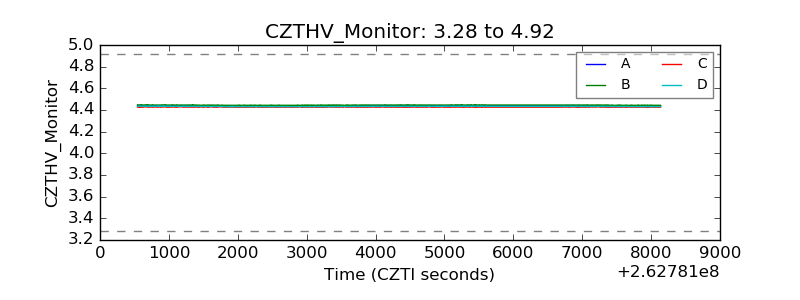 |
| D_VDD | 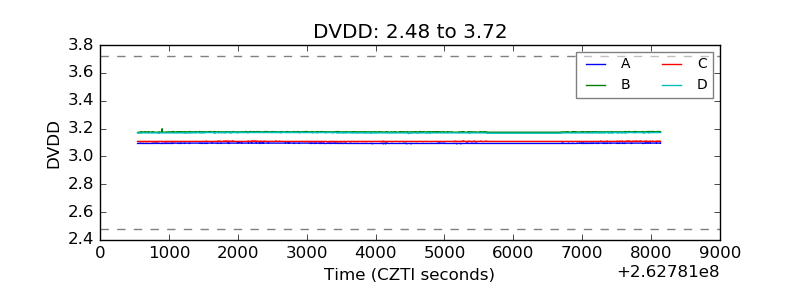 |
| Temperature 1 | 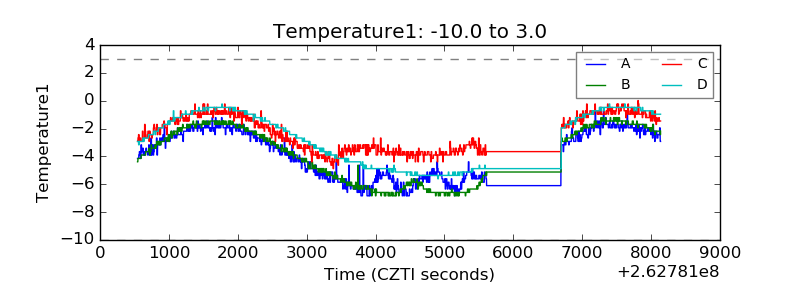 |
| Veto HV Monitor | 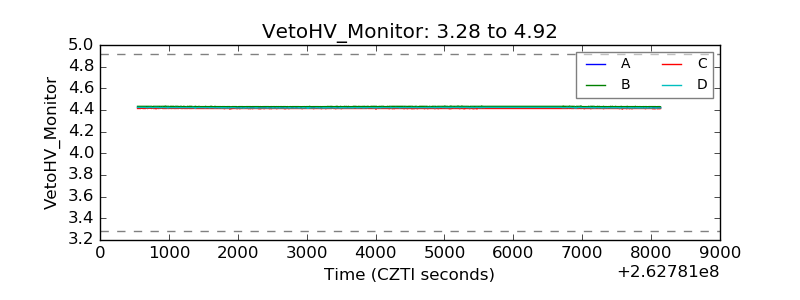 |
| Veto LLD | 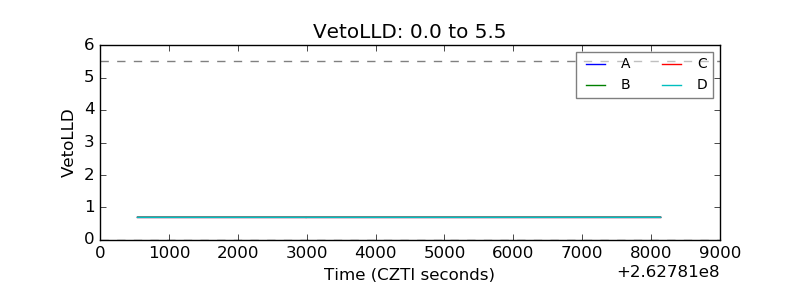 |
| Alpha Counter | 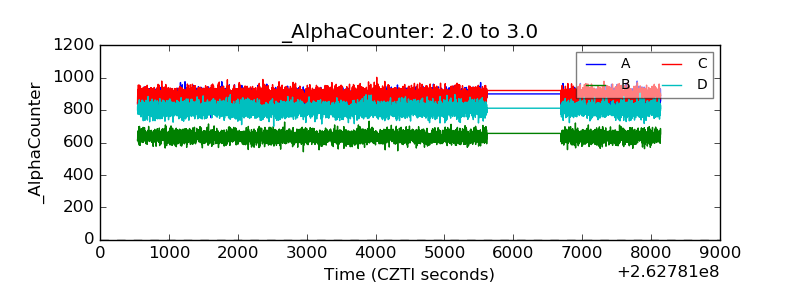 |
| _CPM_Rate | 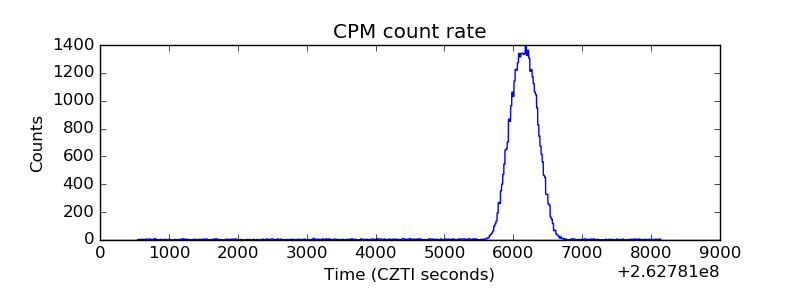 |
| CZT Counter | 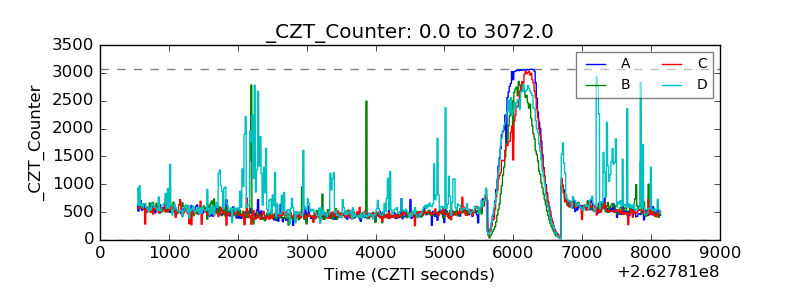 |
| +2.5 Volts monitor |  |
| +5 Volts monitor |  |
| _ROLL_ROT | 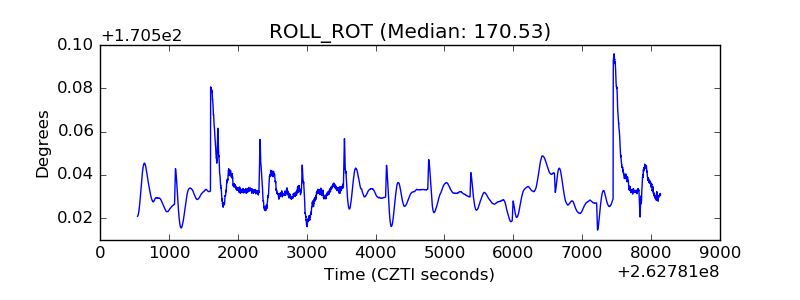 |
| _Roll_DEC | 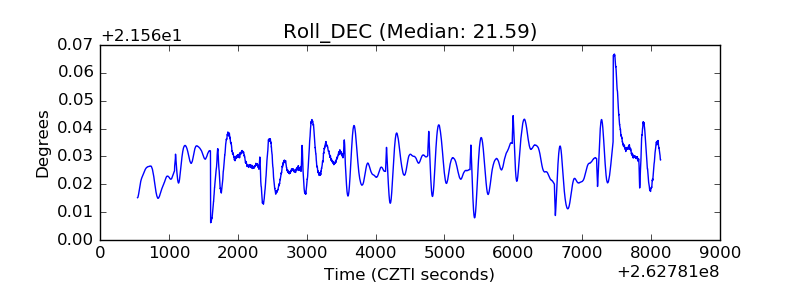 |
| _Roll_RA | 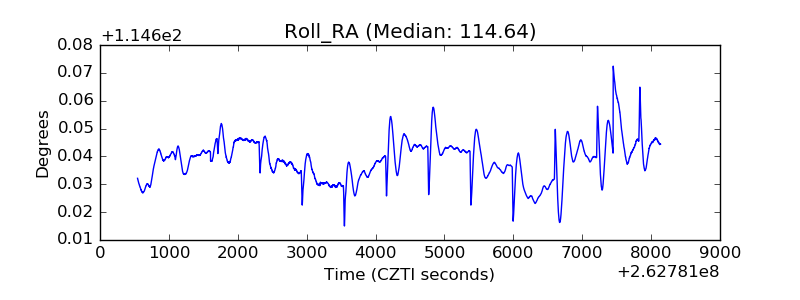 |
| Veto Counter | 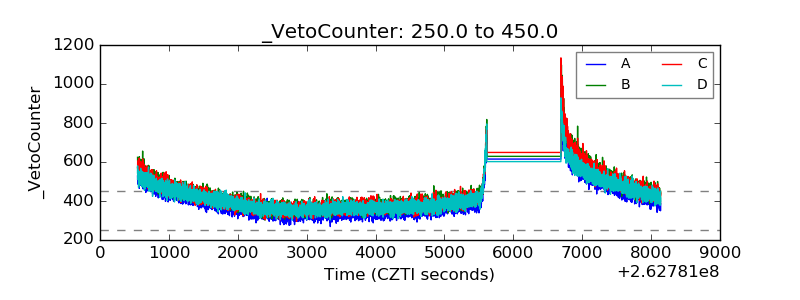 |