| Param | Original file | Final file |
|---|---|---|
| Filename | modeM0/AS1A04_075T05_9000002066_13995cztM0_level2.evt | modeM0/AS1A04_075T05_9000002066_13995cztM0_level2_quad_clean.evt |
| Size (bytes) | 178,865,280 | 41,760,000 |
| Size | 170.6 MB | 39.8 MB |
| Events in quadrant A | 989,316 | 287,192 |
| Events in quadrant B | 1,081,804 | 291,483 |
| Events in quadrant C | 1,033,077 | 283,813 |
| Events in quadrant D | 2,170,452 | 252,099 |
| Mode SS | |||
|---|---|---|---|
| Quadrant | BADHDUFLAG | Total packets | Discarded packets |
| A | 0 | 40 | 0 |
| B | 0 | 40 | 0 |
| C | 0 | 40 | 0 |
| D | 0 | 40 | 0 |
| Mode M0 | |||
|---|---|---|---|
| Quadrant | BADHDUFLAG | Total packets | Discarded packets |
| A | 0 | 4256 | 0 |
| B | 0 | 4494 | 0 |
| C | 0 | 4351 | 0 |
| D | 0 | 7812 | 0 |
| Quadrant | Total seconds | Saturated seconds | Saturation percentage |
|---|---|---|---|
| A | 2067 | 1 | 0.048379% |
| B | 2067 | 9 | 0.435414% |
| C | 2067 | 0 | 0.000000% |
| D | 2067 | 257 | 12.433478% |
Noise dominated data is calculated using 1-second bins in cleaned event files. If a bin has >2000 counts, and if more than 50% of those come from <1% of pixels, then it is considered to be noise-dominated and hence unusable.
| Quadrant | # 1 sec bins | Bins with >0 counts | Bins with >2000 counts | High rate bins dominated by noise | Noise dominated (total time) | Noise dominated (detector-on time) | Marked lightcurve |
|---|---|---|---|---|---|---|---|
| A | 2068 | 2068 | 0 | 0 | 0.00% | 0.00% | 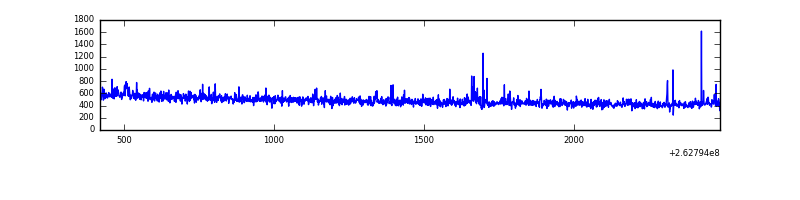 |
| B | 2068 | 2068 | 9 | 9 | 0.44% | 0.44% | 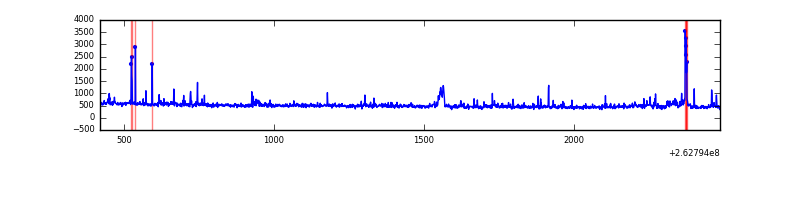 |
| C | 2068 | 2068 | 0 | 0 | 0.00% | 0.00% | 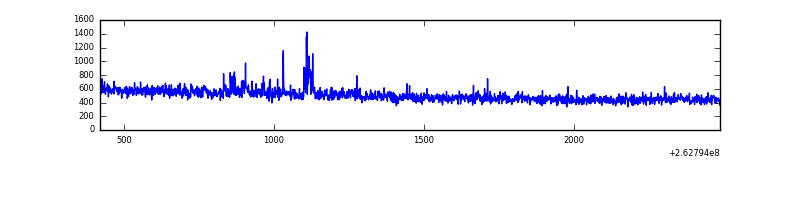 |
| D | 2068 | 2068 | 301 | 301 | 14.56% | 14.56% | 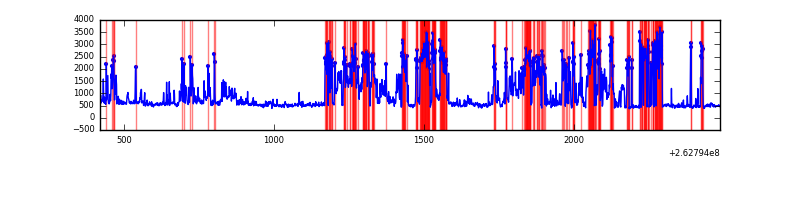 |
Top three noisy pixels from each quadrant. If the there are fewer than three noisy pixels in the level2.evt file, extra rows are filled as -1
| Pixel properties | Quadrant properties | ||||||
|---|---|---|---|---|---|---|---|
| Quadrant | DetID | PixID | Counts | Sigma | Mean | Median | Sigma |
| A | 8 | 15 | 23035 | 447.23 | 246 | 241 | 51.0 |
| A | 1 | 162 | 6857 | 129.81 | 246 | 241 | 51.0 |
| A | 2 | 79 | 3949 | 72.75 | 246 | 241 | 51.0 |
| B | 3 | 64 | 24517 | 514.11 | 246 | 240 | 47.2 |
| B | 0 | 190 | 21764 | 455.81 | 246 | 240 | 47.2 |
| B | 10 | 245 | 18597 | 388.74 | 246 | 240 | 47.2 |
| C | 3 | 233 | 83069 | 1465.14 | 240 | 242 | 56.5 |
| C | 0 | 207 | 11924 | 206.64 | 240 | 242 | 56.5 |
| C | 13 | 61 | 1787 | 27.33 | 240 | 242 | 56.5 |
| D | 1 | 52 | 1040510 | 18105.0 | 230 | 224 | 57.5 |
| D | 8 | 195 | 96895 | 1682.45 | 230 | 224 | 57.5 |
| D | 15 | 0 | 57698 | 1000.27 | 230 | 224 | 57.5 |
Histogram calculated using DETX and DETY for each event in the final _common_clean file
| Quadrant A | 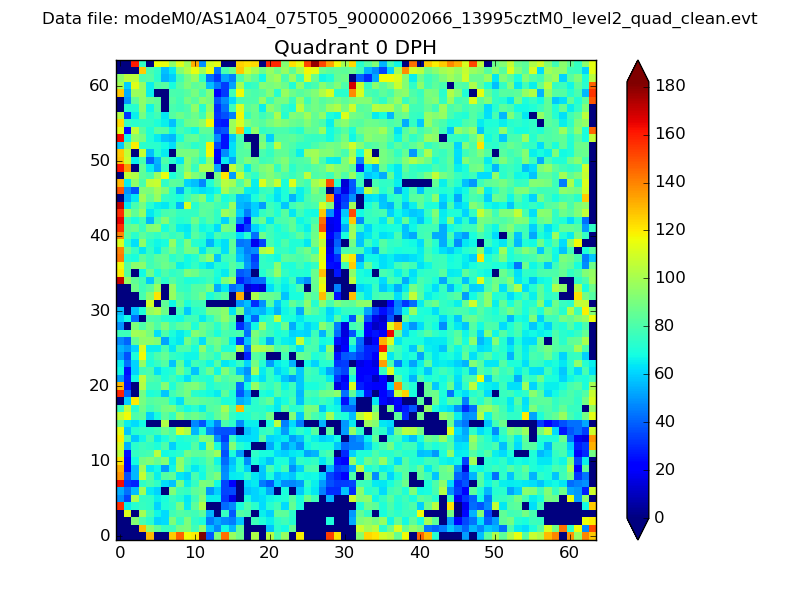 |
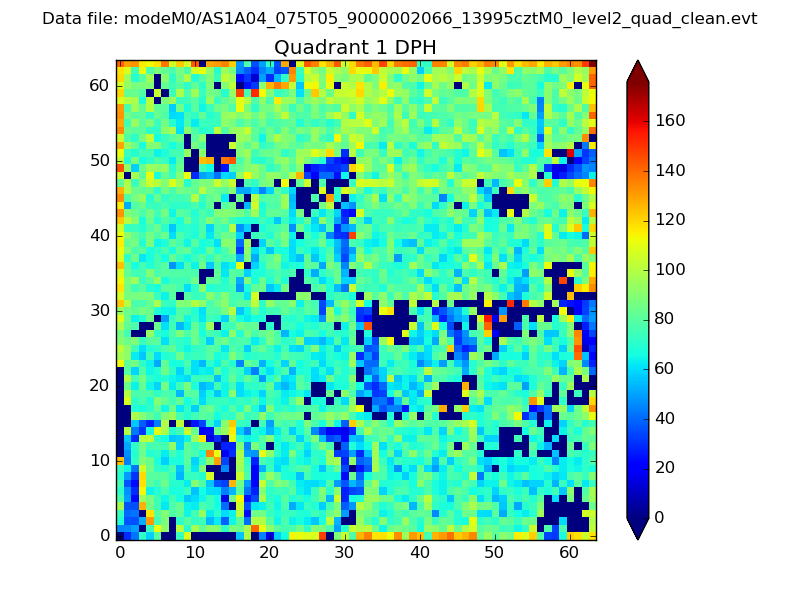 |
Quadrant B |
|---|---|---|---|
| Quadrant D | 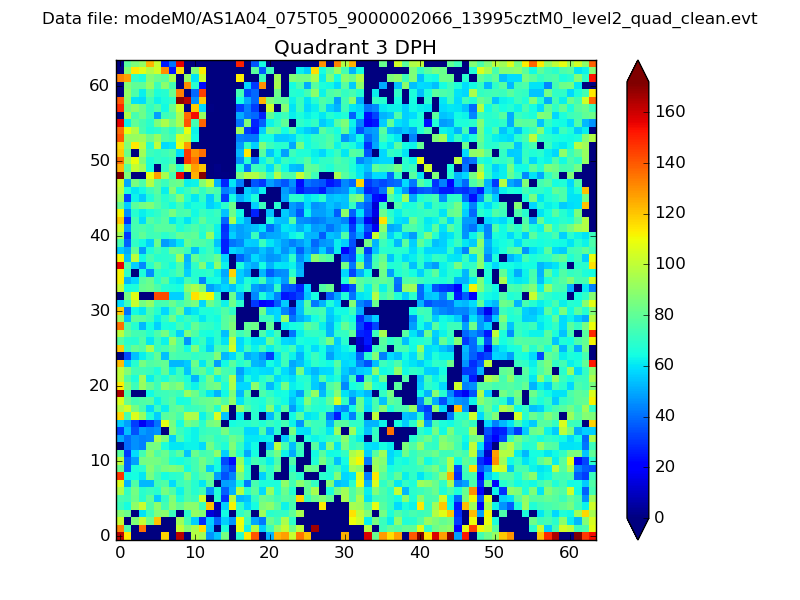 |
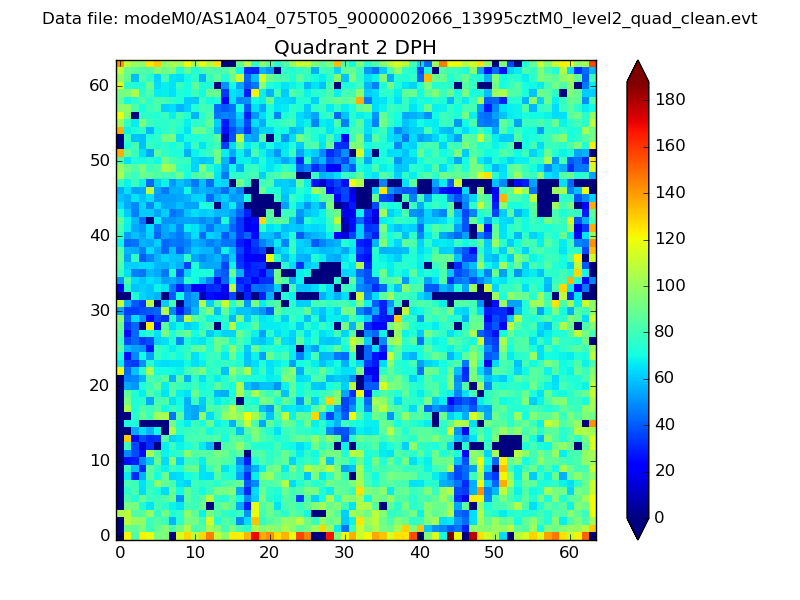 |
Quadrant C |
| Plot type | Count rate plots | Images |
|---|---|---|
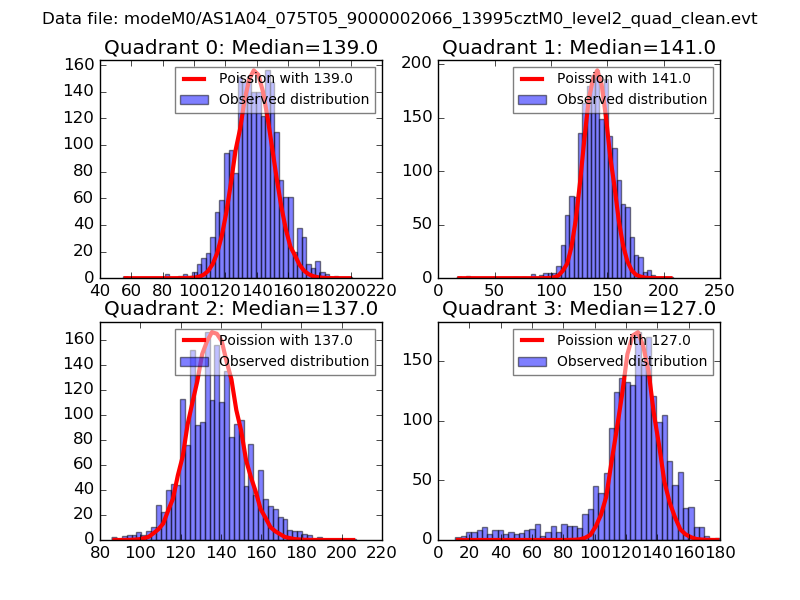
| Comparison with Poisson distribution Blue bars denote a histogram of data divided into 1 sec bins. Red curve is a Poisson curve with rate = median count rate of data. |
 |
 |
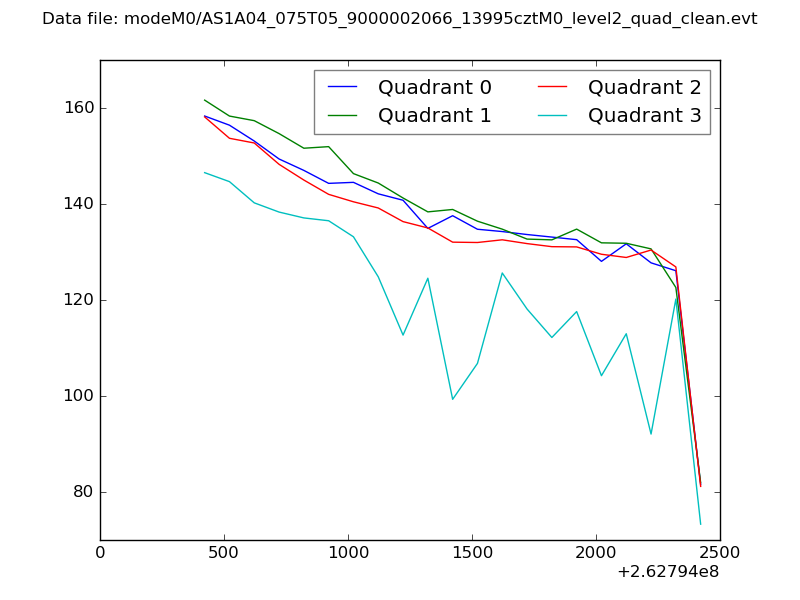
| Quadrant-wise count rates Data is divided into 100 sec bins |
 |
|
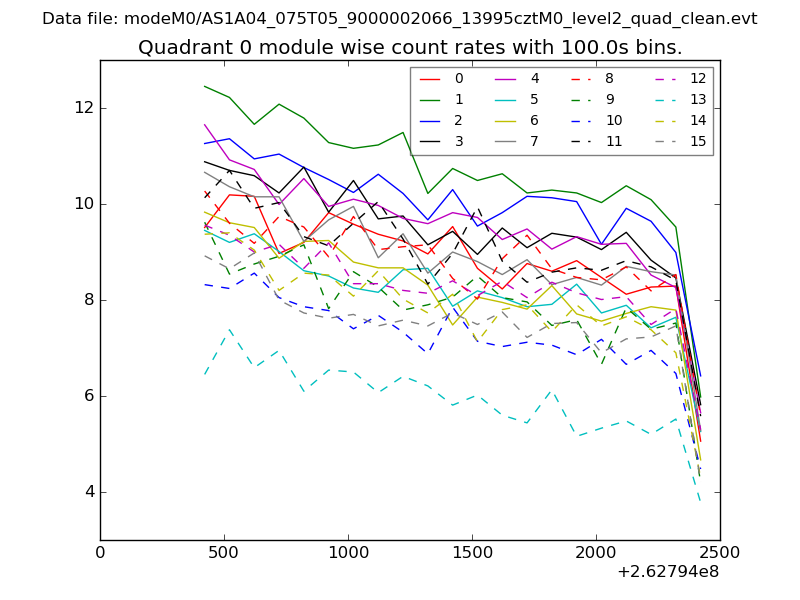
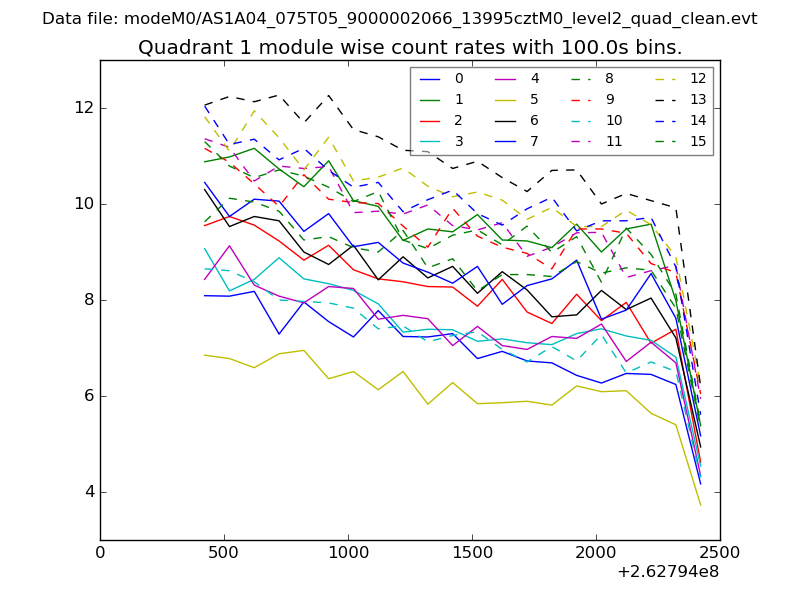
| Module-wise count rates for Quadrant A Data is divided into 100 sec bins |
 |
 |
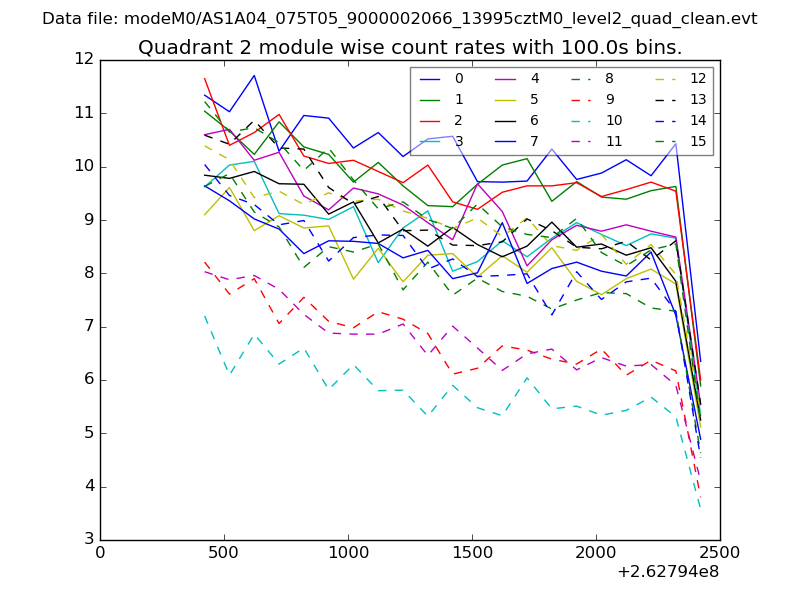
| Module-wise count rates for Quadrant B Data is divided into 100 sec bins |
 |
 |
| Module-wise count rates for Quadrant C Data is divided into 100 sec bins |
 |
 |
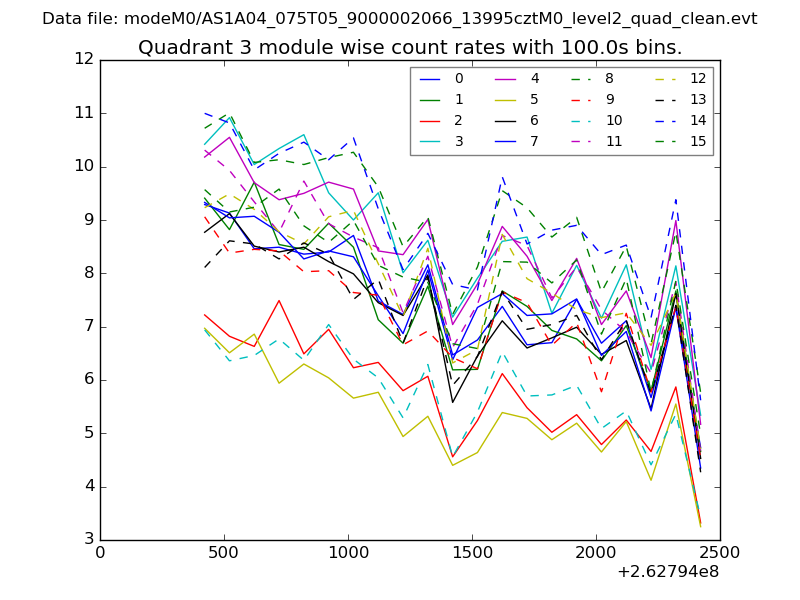
| Module-wise count rates for Quadrant D Data is divided into 100 sec bins |
 |
 |
| Parameter | Plot |
|---|---|
| CZT HV Monitor | 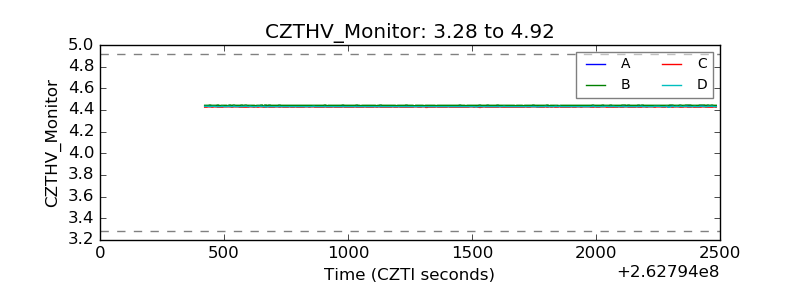 |
| D_VDD | 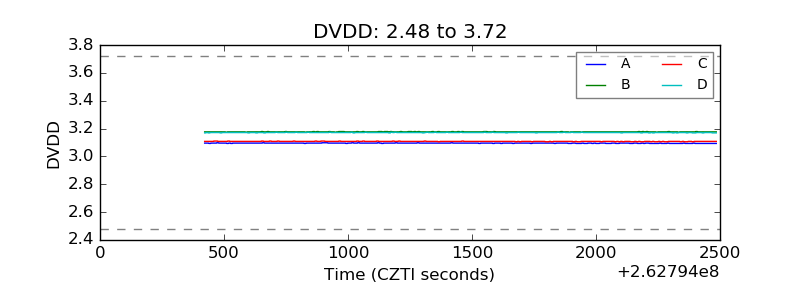 |
| Temperature 1 | 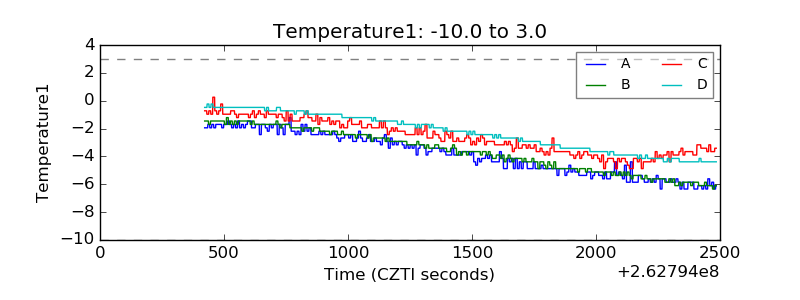 |
| Veto HV Monitor | 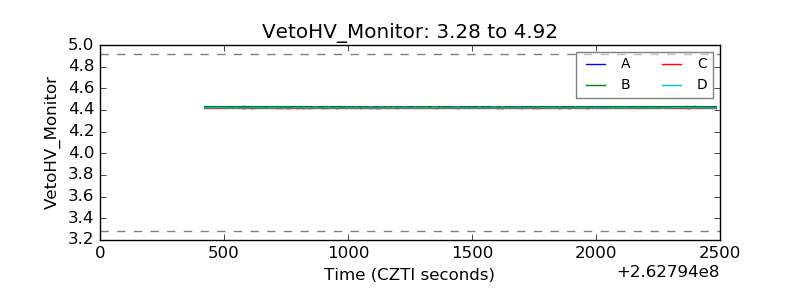 |
| Veto LLD | 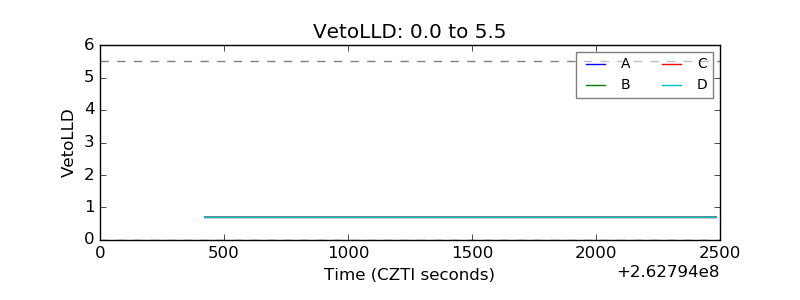 |
| Alpha Counter | 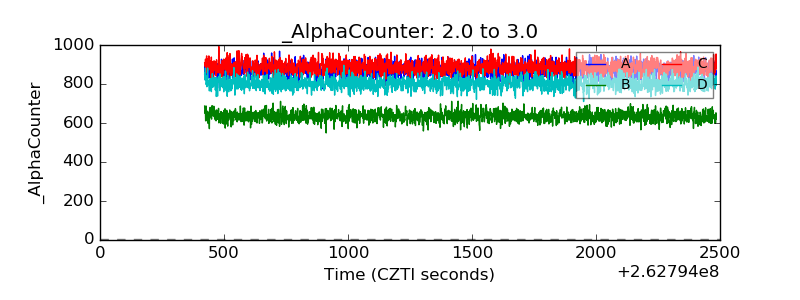 |
| _CPM_Rate | 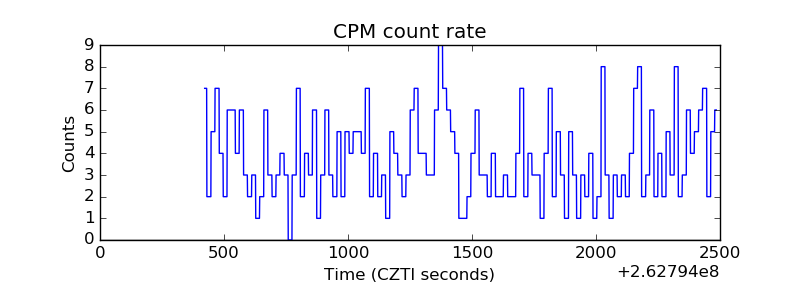 |
| CZT Counter | 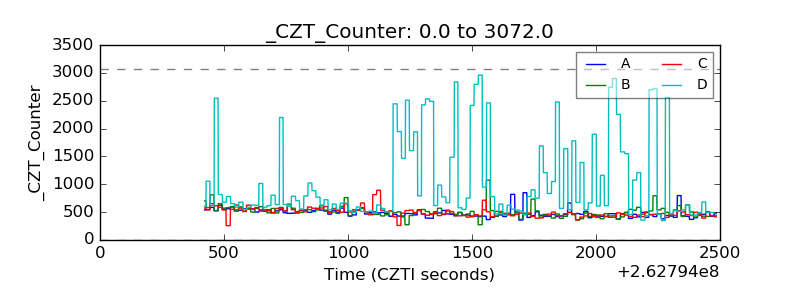 |
| +2.5 Volts monitor |  |
| +5 Volts monitor | 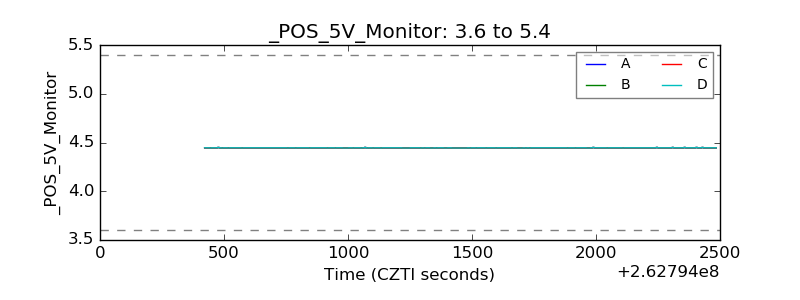 |
| _ROLL_ROT | 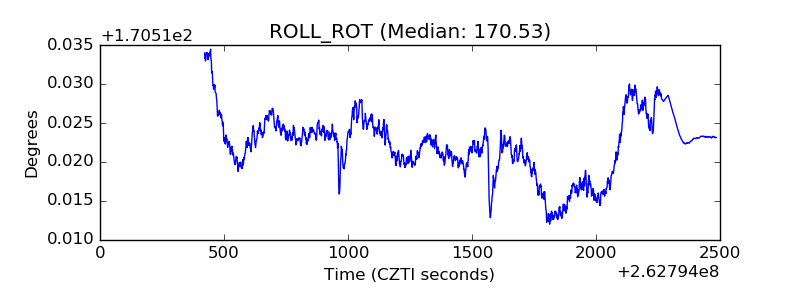 |
| _Roll_DEC | 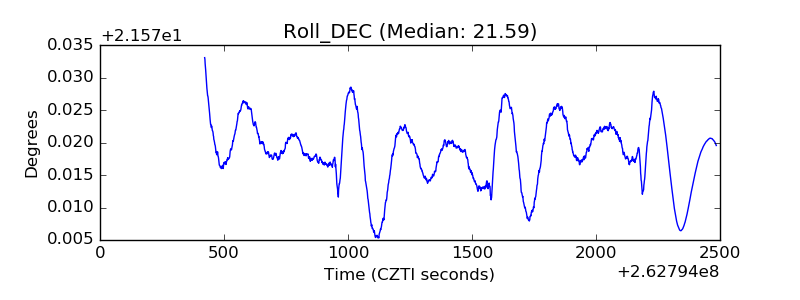 |
| _Roll_RA | 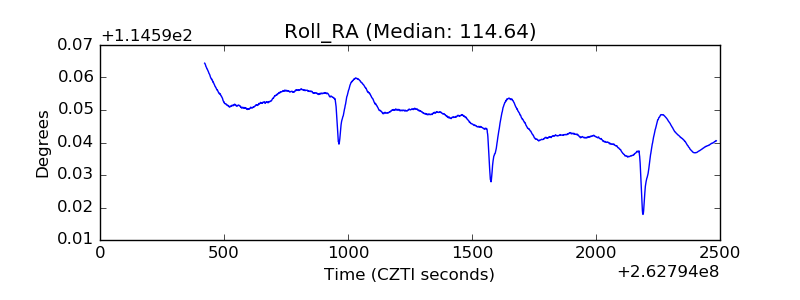 |
| Veto Counter | 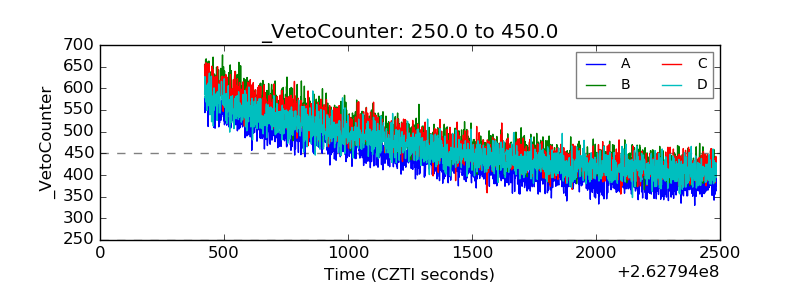 |