| Param | Original file | Final file |
|---|---|---|
| Filename | modeM0/AS1G08_064T01_9000002070cztM0_level2.fits | modeM0/AS1G08_064T01_9000002070cztM0_level2_quad_clean.evt |
| Size (bytes) | 858,424,320 | 791,982,720 |
| Size | 818.7 MB | 755.3 MB |
| Events in quadrant A | 5,259,934 | 4,689,535 |
| Events in quadrant B | 5,028,718 | 4,642,765 |
| Events in quadrant C | 5,180,808 | 4,481,569 |
| Events in quadrant D | 4,436,548 | 4,080,476 |
| Mode M0 | |||
|---|---|---|---|
| Quadrant | BADHDUFLAG | Total packets | Discarded packets |
| A | 0 | 186217 | 0 |
| B | 0 | 196082 | 0 |
| C | 0 | 185276 | 0 |
| D | 0 | 221842 | 0 |
| Mode SS | |||
|---|---|---|---|
| Quadrant | BADHDUFLAG | Total packets | Discarded packets |
| A | 0 | 1808 | 0 |
| B | 0 | 1808 | 0 |
| C | 0 | 1808 | 0 |
| D | 0 | 1808 | 0 |
| Mode M9 | |||
|---|---|---|---|
| Quadrant | BADHDUFLAG | Total packets | Discarded packets |
| A | 0 | 152 | 0 |
| B | 0 | 152 | 0 |
| C | 0 | 152 | 0 |
| D | 0 | 152 | 0 |
| Quadrant | Total seconds | Saturated seconds | Saturation percentage |
|---|---|---|---|
| A | 88862 | 1033 | 1.162477% |
| B | 88862 | 1894 | 2.131395% |
| C | 88862 | 809 | 0.910400% |
| D | 88862 | 2887 | 3.248858% |
Noise dominated data is calculated using 1-second bins in cleaned event files. If a bin has >2000 counts, and if more than 50% of those come from <1% of pixels, then it is considered to be noise-dominated and hence unusable.
| Quadrant | # 1 sec bins | Bins with >0 counts | Bins with >2000 counts | High rate bins dominated by noise | Noise dominated (total time) | Noise dominated (detector-on time) | Marked lightcurve |
|---|---|---|---|---|---|---|---|
| A | 103897 | 88862 | 0 | 0 | 0.00% | 0.00% |  |
| B | 103897 | 88780 | 0 | 0 | 0.00% | 0.00% |  |
| C | 103897 | 88861 | 0 | 0 | 0.00% | 0.00% |  |
| D | 103897 | 88800 | 0 | 0 | 0.00% | 0.00% |  |
Top three noisy pixels from each quadrant. If the there are fewer than three noisy pixels in the level2.evt file, extra rows are filled as -1
| Pixel properties | Quadrant properties | ||||||
|---|---|---|---|---|---|---|---|
| Quadrant | DetID | PixID | Counts | Sigma | Mean | Median | Sigma |
| A | 0 | 29 | 4931 | 10.67 | 1370 | 1280 | 342.2 |
| A | 7 | 110 | 4245 | 8.66 | 1370 | 1280 | 342.2 |
| A | 9 | 19 | 3917 | 7.71 | 1370 | 1280 | 342.2 |
| B | 2 | 9 | 4360 | 11.86 | 1325 | 1262 | 261.3 |
| B | 3 | 17 | 3284 | 7.74 | 1325 | 1262 | 261.3 |
| B | 2 | 8 | 3263 | 7.66 | 1325 | 1262 | 261.3 |
| C | 1 | 80 | 3925 | 7.52 | 1367 | 1274 | 352.7 |
| C | 1 | 81 | 3874 | 7.37 | 1367 | 1274 | 352.7 |
| C | 12 | 241 | 3614 | 6.63 | 1367 | 1274 | 352.7 |
| D | 6 | 231 | 3244 | 6.15 | 1266 | 1150 | 340.2 |
| D | 10 | 189 | 3168 | 5.93 | 1266 | 1150 | 340.2 |
| D | 3 | 14 | 3155 | 5.89 | 1266 | 1150 | 340.2 |
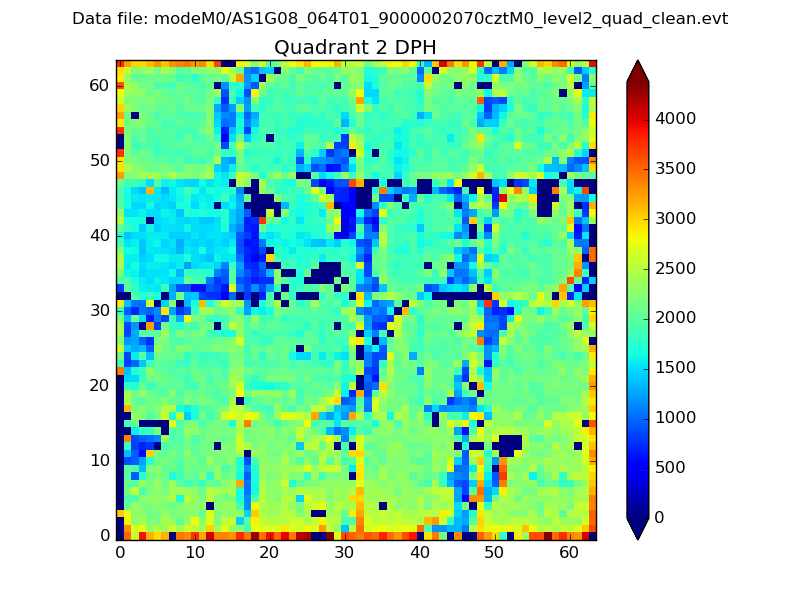
Histogram calculated using DETX and DETY for each event in the final _common_clean file
| Quadrant A |  |
 |
Quadrant B |
|---|---|---|---|
| Quadrant D |  |
 |
Quadrant C |
| Plot type | Count rate plots | Images |
|---|---|---|
| Comparison with Poisson distribution Blue bars denote a histogram of data divided into 1 sec bins. Red curve is a Poisson curve with rate = median count rate of data. |
 |
 |
| Quadrant-wise count rates Data is divided into 100 sec bins |
 |
|
| Module-wise count rates for Quadrant A Data is divided into 100 sec bins |
 |
 |
| Module-wise count rates for Quadrant B Data is divided into 100 sec bins |
 |
 |
| Module-wise count rates for Quadrant C Data is divided into 100 sec bins |
 |
 |
| Module-wise count rates for Quadrant D Data is divided into 100 sec bins |
 |
 |
| Parameter | Plot |
|---|---|
| CZT HV Monitor |  |
| D_VDD |  |
| Temperature 1 |  |
| Veto HV Monitor |  |
| Veto LLD |  |
| Alpha Counter |  |
| _CPM_Rate |  |
| CZT Counter |  |
| +2.5 Volts monitor |  |
| +5 Volts monitor |  |
| _ROLL_ROT |  |
| _Roll_DEC |  |
| _Roll_RA |  |
| Veto Counter |  |