| Param | Original file | Final file |
|---|---|---|
| Filename | modeM0/AS1G08_064T01_9000002070_14005cztM0_level2.evt | modeM0/AS1G08_064T01_9000002070_14005cztM0_level2_quad_clean.evt |
| Size (bytes) | 124,156,800 | 8,455,680 |
| Size | 118.4 MB | 8.1 MB |
| Events in quadrant A | 915,416 | 31,528 |
| Events in quadrant B | 914,697 | 32,314 |
| Events in quadrant C | 933,538 | 32,086 |
| Events in quadrant D | 875,180 | 31,409 |
| Mode M0 | |||
|---|---|---|---|
| Quadrant | BADHDUFLAG | Total packets | Discarded packets |
| A | 0 | 3718 | 2 |
| B | 0 | 3689 | 1 |
| C | 0 | 3758 | 1 |
| D | 0 | 3699 | 1 |
| Mode SS | |||
|---|---|---|---|
| Quadrant | BADHDUFLAG | Total packets | Discarded packets |
| A | 0 | 36 | 0 |
| B | 0 | 36 | 0 |
| C | 0 | 36 | 0 |
| D | 0 | 36 | 0 |
| Mode M9 | |||
|---|---|---|---|
| Quadrant | BADHDUFLAG | Total packets | Discarded packets |
| A | 0 | 9 | 0 |
| B | 0 | 9 | 0 |
| C | 0 | 9 | 0 |
| D | 0 | 9 | 0 |
| Quadrant | Total seconds | Saturated seconds | Saturation percentage |
|---|---|---|---|
| A | 1747 | 50 | 2.862049% |
| B | 1747 | 54 | 3.091013% |
| C | 1747 | 39 | 2.232398% |
| D | 1747 | 33 | 1.888952% |
Noise dominated data is calculated using 1-second bins in cleaned event files. If a bin has >2000 counts, and if more than 50% of those come from <1% of pixels, then it is considered to be noise-dominated and hence unusable.
| Quadrant | # 1 sec bins | Bins with >0 counts | Bins with >2000 counts | High rate bins dominated by noise | Noise dominated (total time) | Noise dominated (detector-on time) | Marked lightcurve |
|---|---|---|---|---|---|---|---|
| A | 2603 | 1749 | 0 | 0 | 0.00% | 0.00% | 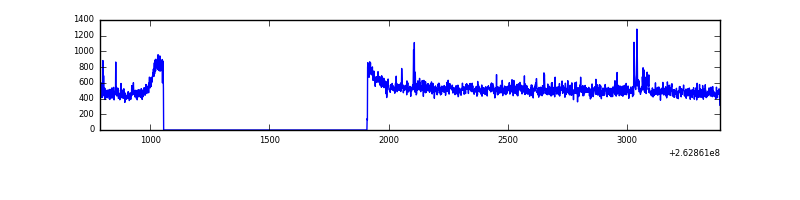 |
| B | 2603 | 1749 | 2 | 2 | 0.08% | 0.11% | 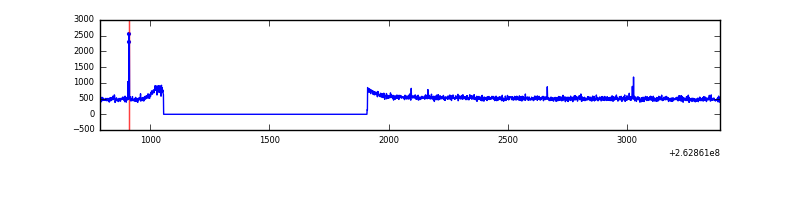 |
| C | 2603 | 1749 | 2 | 2 | 0.08% | 0.11% | 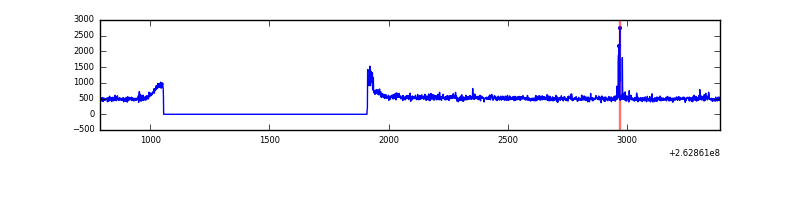 |
| D | 2603 | 1749 | 0 | 0 | 0.00% | 0.00% | 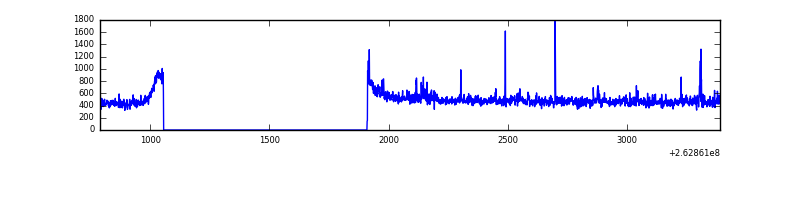 |
Top three noisy pixels from each quadrant. If the there are fewer than three noisy pixels in the level2.evt file, extra rows are filled as -1
| Pixel properties | Quadrant properties | ||||||
|---|---|---|---|---|---|---|---|
| Quadrant | DetID | PixID | Counts | Sigma | Mean | Median | Sigma |
| A | 12 | 189 | 14659 | 293.51 | 231 | 225 | 49.2 |
| A | 1 | 162 | 3545 | 67.51 | 231 | 225 | 49.2 |
| A | 2 | 79 | 3056 | 57.57 | 231 | 225 | 49.2 |
| B | 4 | 80 | 7189 | 150.55 | 230 | 224 | 46.3 |
| B | 12 | 111 | 5619 | 116.61 | 230 | 224 | 46.3 |
| B | 11 | 111 | 4724 | 97.27 | 230 | 224 | 46.3 |
| C | 3 | 233 | 63195 | 1191.25 | 219 | 220 | 52.9 |
| C | 0 | 207 | 12292 | 228.36 | 219 | 220 | 52.9 |
| C | 13 | 61 | 1566 | 25.46 | 219 | 220 | 52.9 |
| D | 13 | 189 | 23543 | 429.37 | 219 | 212 | 54.3 |
| D | 7 | 80 | 5726 | 101.48 | 219 | 212 | 54.3 |
| D | 2 | 234 | 5100 | 89.96 | 219 | 212 | 54.3 |
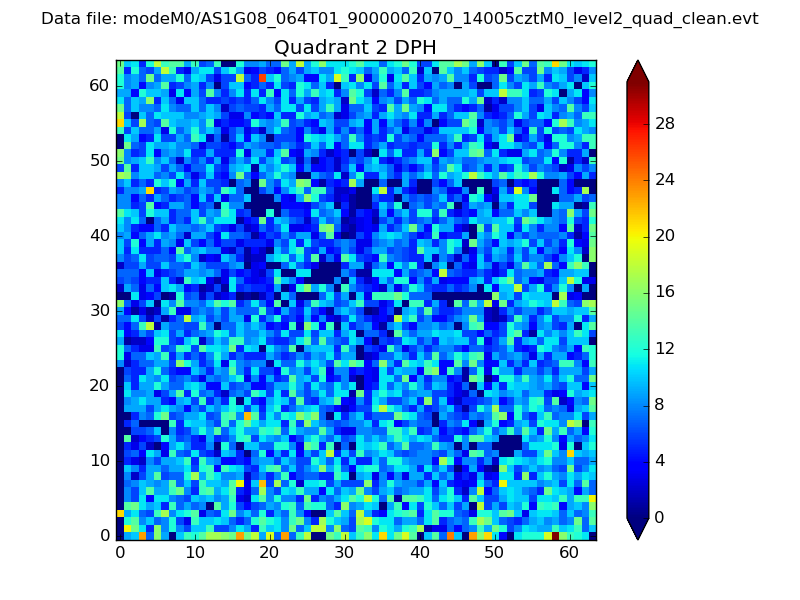
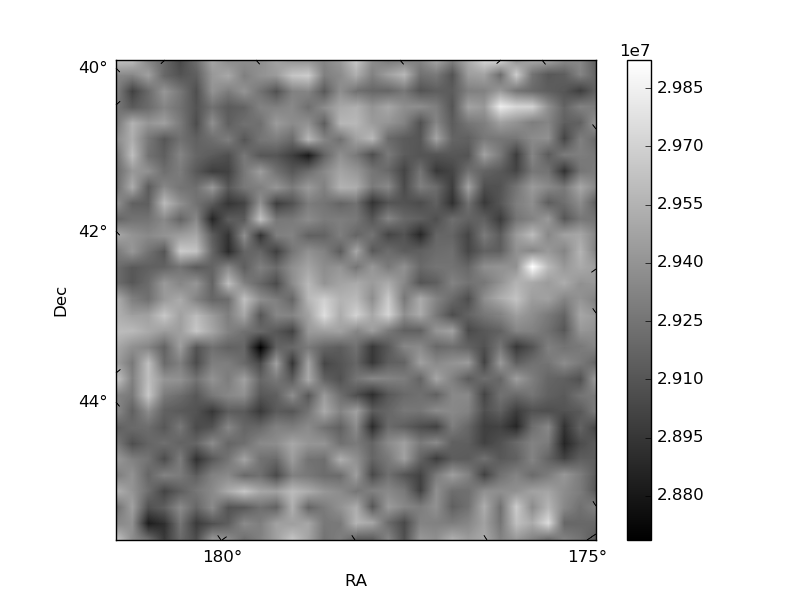
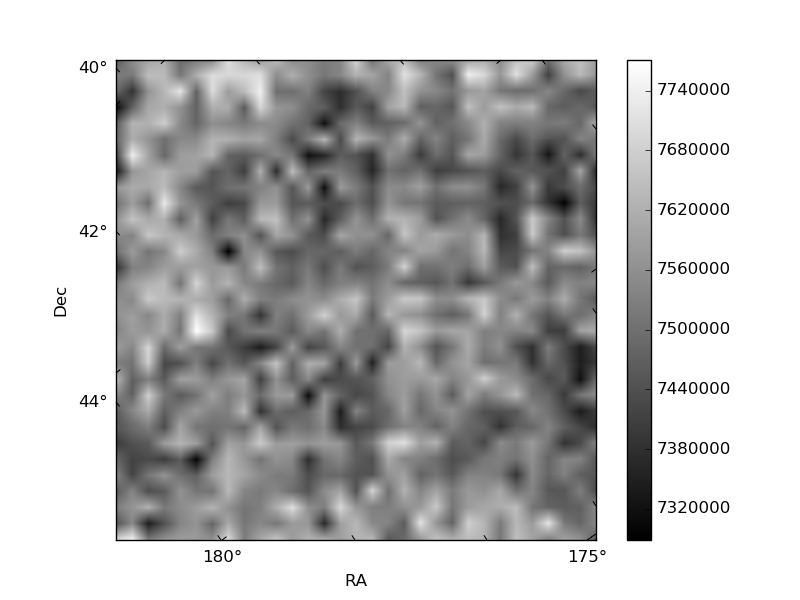
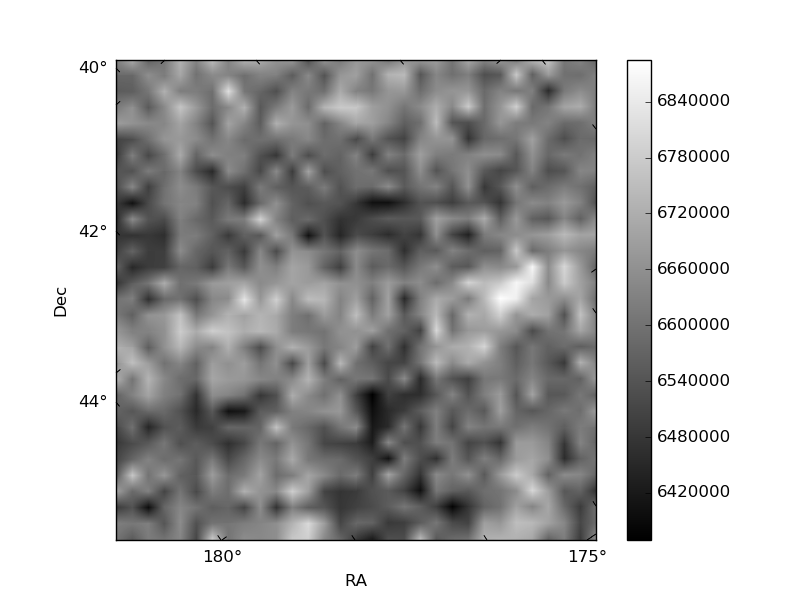
Histogram calculated using DETX and DETY for each event in the final _common_clean file
| Quadrant A | 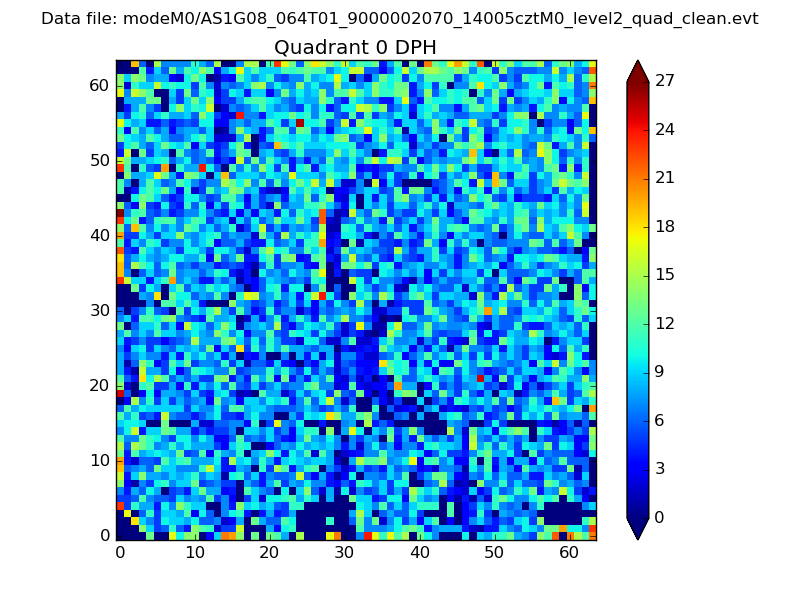 |
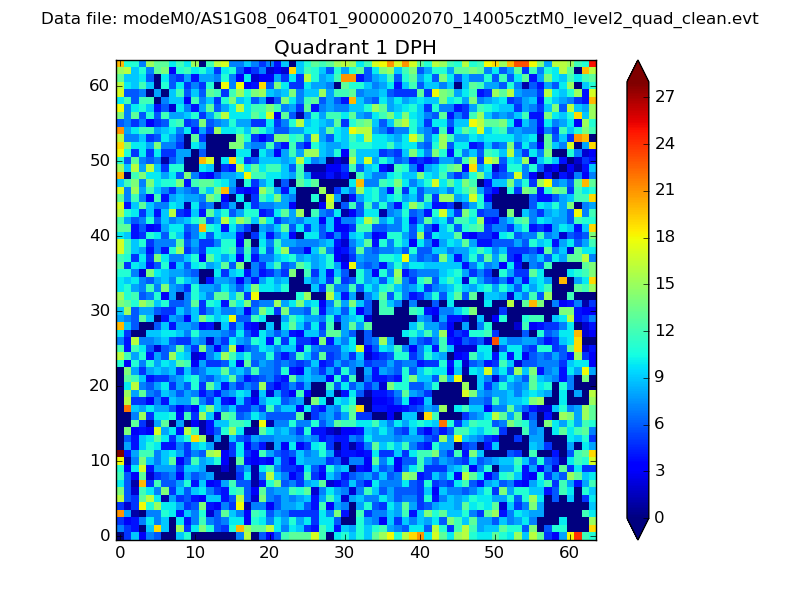 |
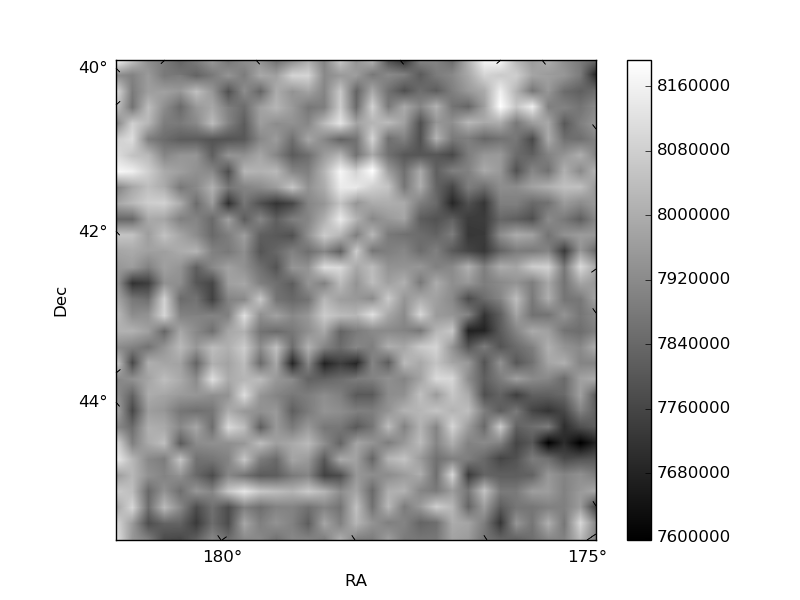
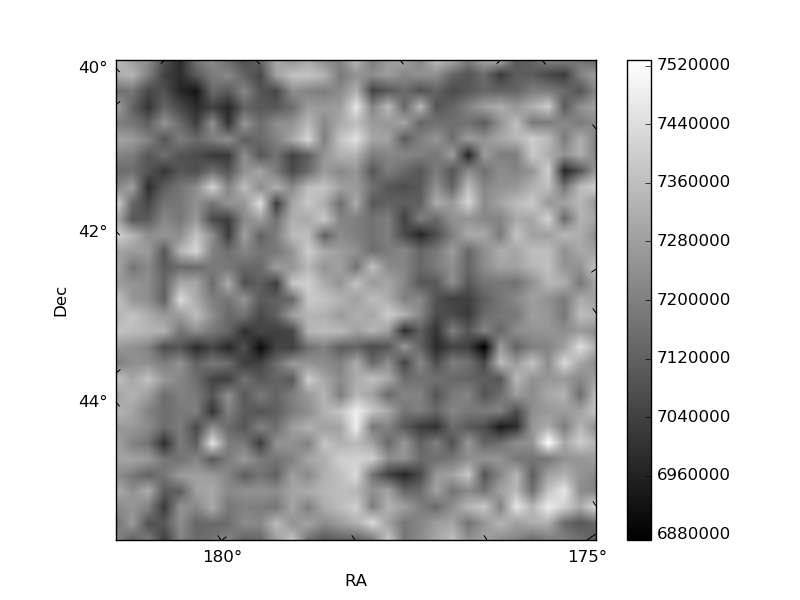
Quadrant B |
|---|---|---|---|
| Quadrant D | 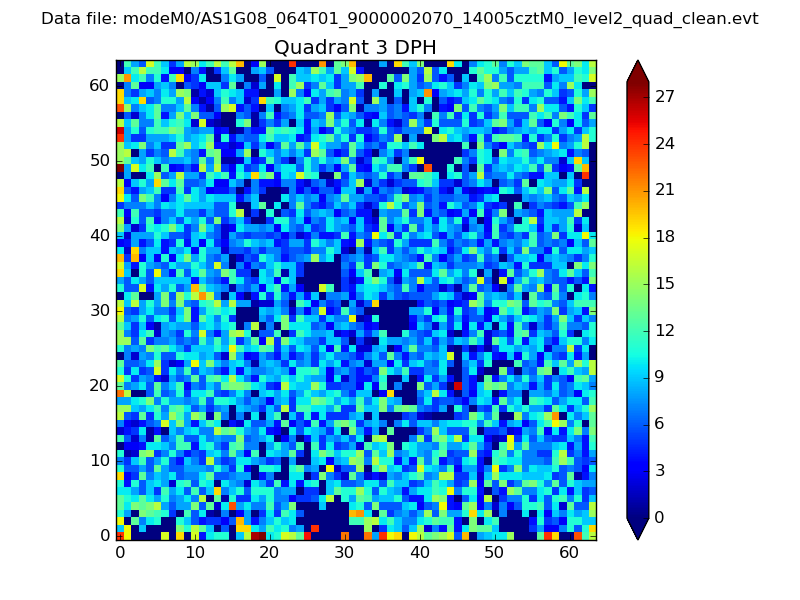 |
 |
Quadrant C |
| Plot type | Count rate plots | Images |
|---|---|---|
| Comparison with Poisson distribution Blue bars denote a histogram of data divided into 1 sec bins. Red curve is a Poisson curve with rate = median count rate of data. |
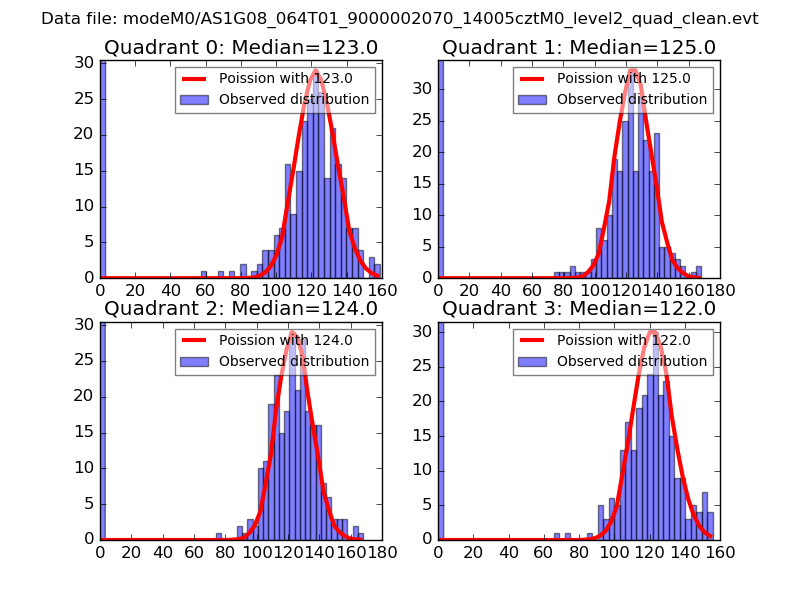 |
 |
| Quadrant-wise count rates Data is divided into 100 sec bins |
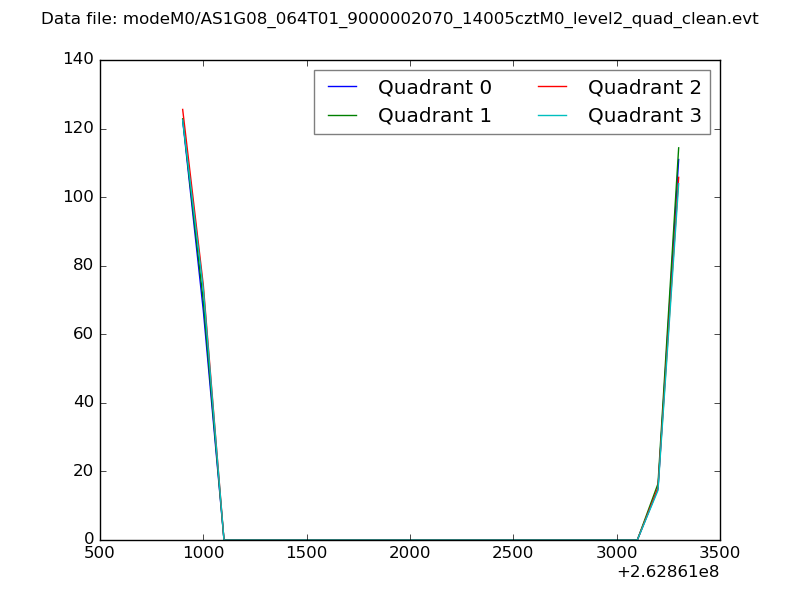 |
|
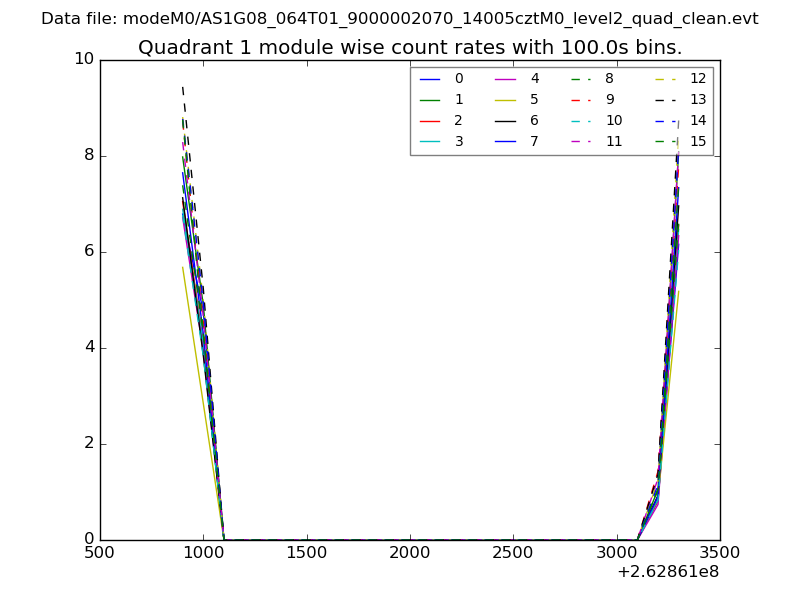
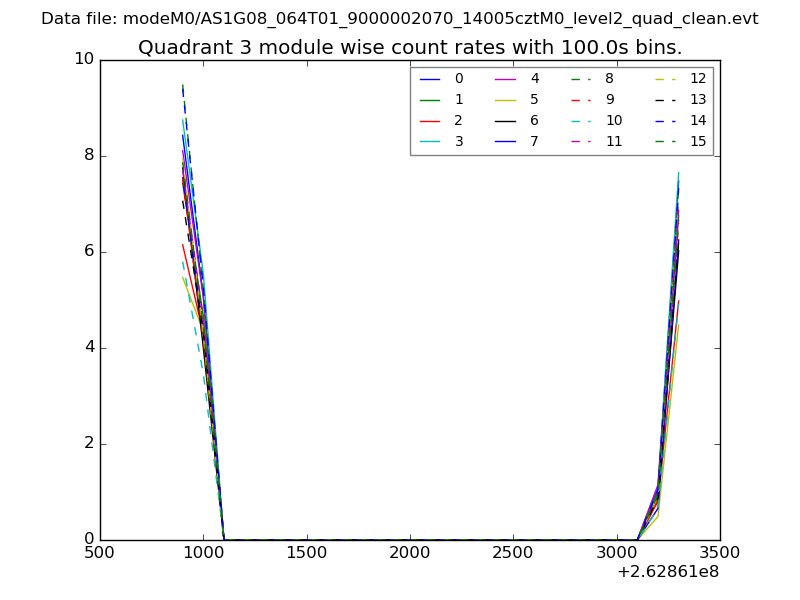
| Module-wise count rates for Quadrant A Data is divided into 100 sec bins |
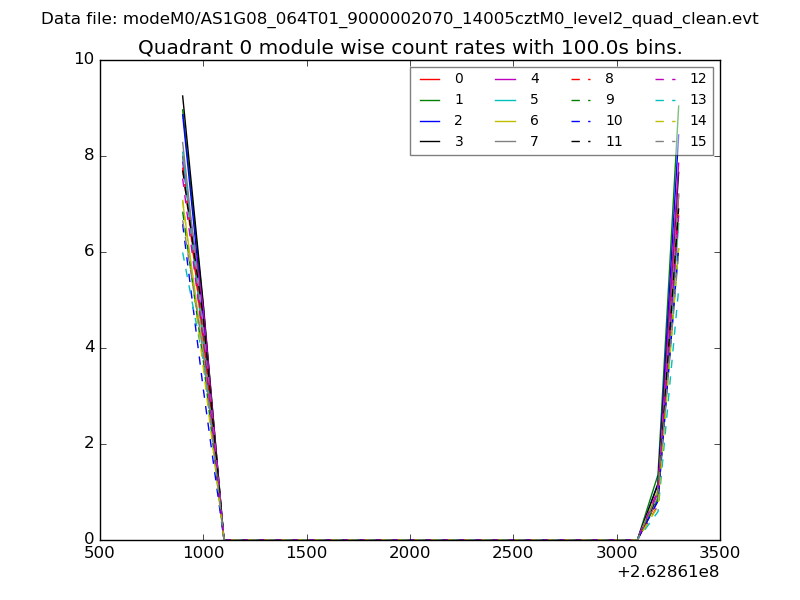 |
 |
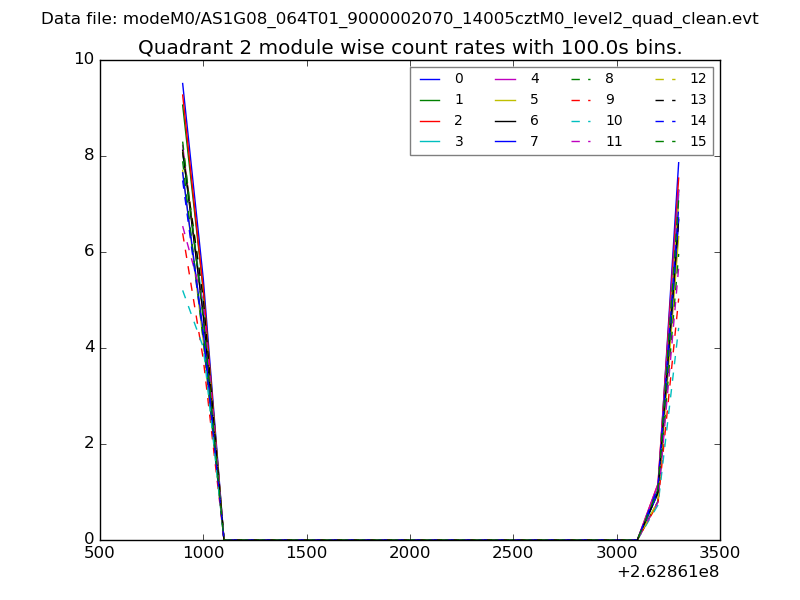
| Module-wise count rates for Quadrant B Data is divided into 100 sec bins |
 |
 |
| Module-wise count rates for Quadrant C Data is divided into 100 sec bins |
 |
 |
| Module-wise count rates for Quadrant D Data is divided into 100 sec bins |
 |
 |
| Parameter | Plot |
|---|---|
| CZT HV Monitor | 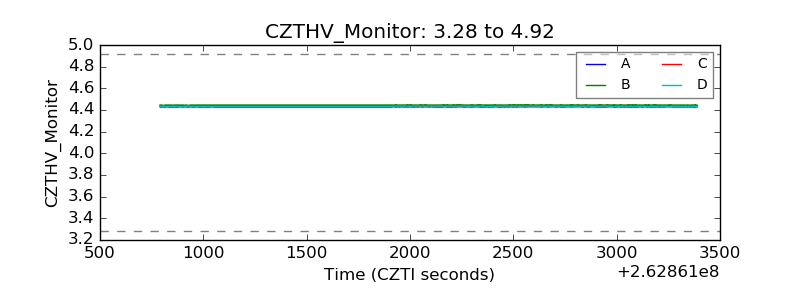 |
| D_VDD | 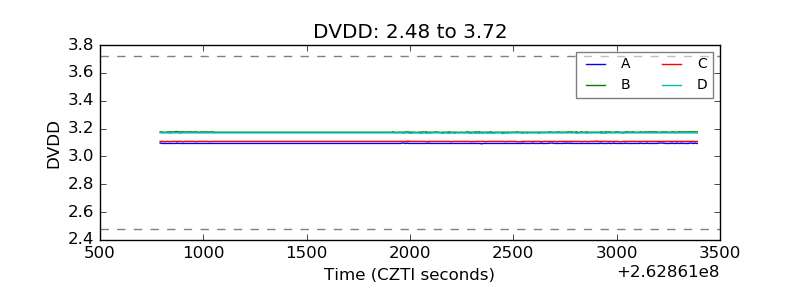 |
| Temperature 1 |  |
| Veto HV Monitor | 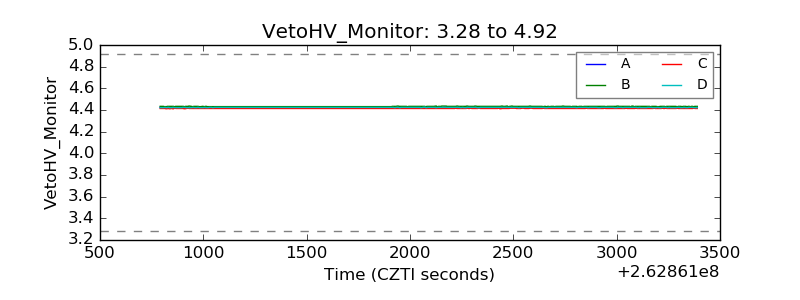 |
| Veto LLD | 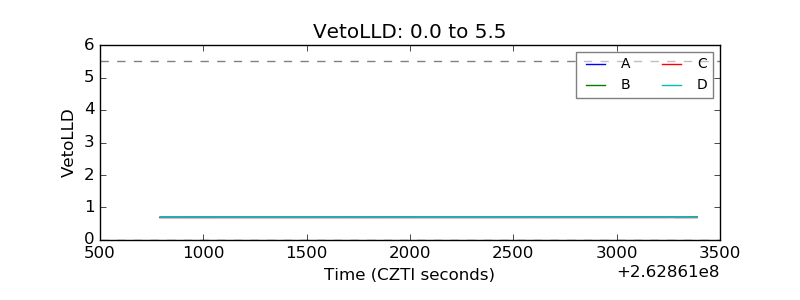 |
| Alpha Counter | 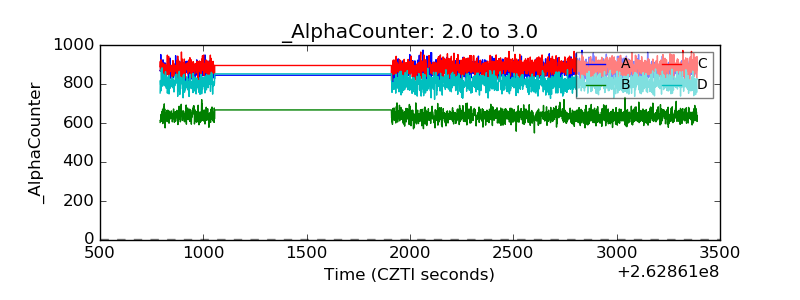 |
| _CPM_Rate | 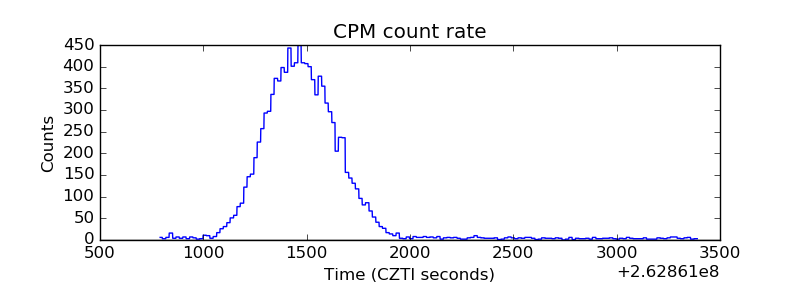 |
| CZT Counter | 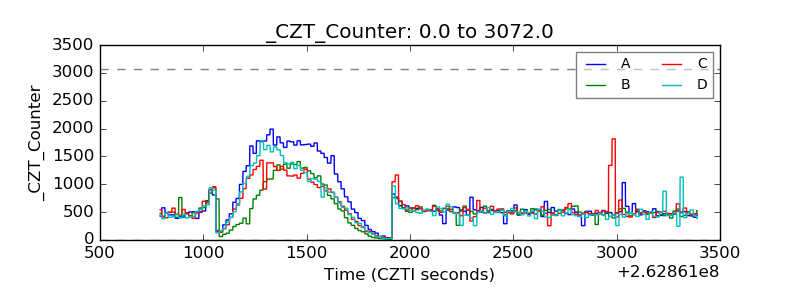 |
| +2.5 Volts monitor |  |
| +5 Volts monitor |  |
| _ROLL_ROT | 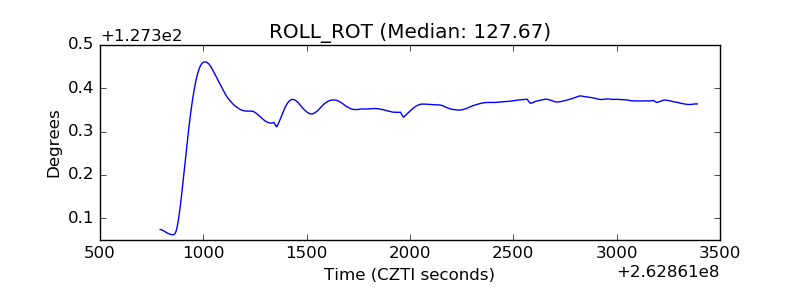 |
| _Roll_DEC |  |
| _Roll_RA | 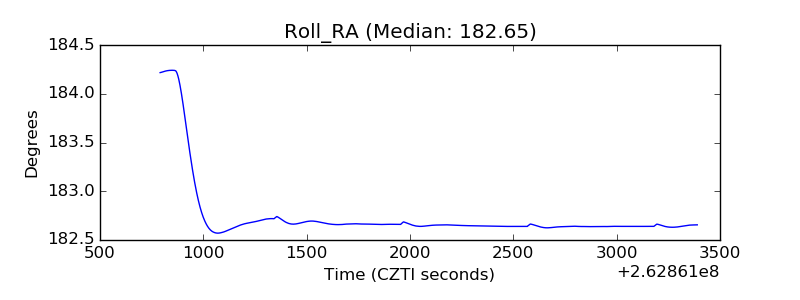 |
| Veto Counter | 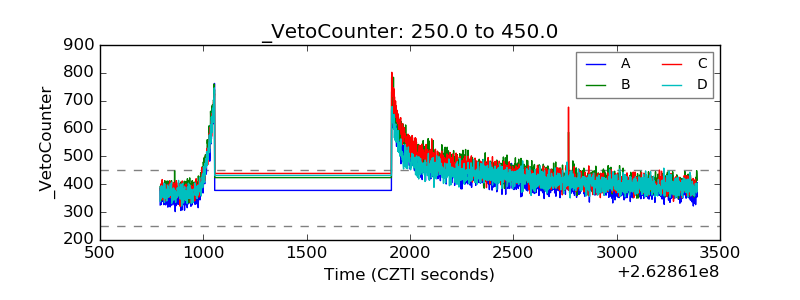 |