| Param | Original file | Final file |
|---|---|---|
| Filename | modeM0/AS1G08_064T01_9000002070_14006cztM0_level2.evt | modeM0/AS1G08_064T01_9000002070_14006cztM0_level2_quad_clean.evt |
| Size (bytes) | 494,703,360 | 86,166,720 |
| Size | 471.8 MB | 82.2 MB |
| Events in quadrant A | 3,379,501 | 539,945 |
| Events in quadrant B | 3,670,961 | 538,829 |
| Events in quadrant C | 3,495,147 | 530,993 |
| Events in quadrant D | 3,963,199 | 513,990 |
| Mode M0 | |||
|---|---|---|---|
| Quadrant | BADHDUFLAG | Total packets | Discarded packets |
| A | 0 | 14531 | 3 |
| B | 0 | 15280 | 2 |
| C | 0 | 14600 | 2 |
| D | 0 | 16336 | 2 |
| Mode SS | |||
|---|---|---|---|
| Quadrant | BADHDUFLAG | Total packets | Discarded packets |
| A | 0 | 144 | 0 |
| B | 0 | 144 | 0 |
| C | 0 | 144 | 0 |
| D | 0 | 144 | 0 |
| Mode M9 | |||
|---|---|---|---|
| Quadrant | BADHDUFLAG | Total packets | Discarded packets |
| A | 0 | 19 | 0 |
| B | 0 | 19 | 0 |
| C | 0 | 19 | 0 |
| D | 0 | 19 | 0 |
| Quadrant | Total seconds | Saturated seconds | Saturation percentage |
|---|---|---|---|
| A | 6968 | 109 | 1.564294% |
| B | 6968 | 156 | 2.238806% |
| C | 6968 | 83 | 1.191160% |
| D | 6968 | 152 | 2.181401% |
Noise dominated data is calculated using 1-second bins in cleaned event files. If a bin has >2000 counts, and if more than 50% of those come from <1% of pixels, then it is considered to be noise-dominated and hence unusable.
| Quadrant | # 1 sec bins | Bins with >0 counts | Bins with >2000 counts | High rate bins dominated by noise | Noise dominated (total time) | Noise dominated (detector-on time) | Marked lightcurve |
|---|---|---|---|---|---|---|---|
| A | 8839 | 6971 | 0 | 0 | 0.00% | 0.00% | 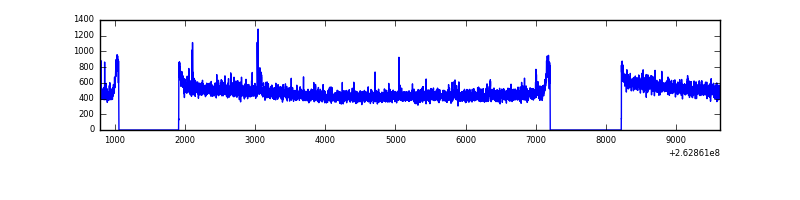 |
| B | 8839 | 6971 | 56 | 56 | 0.63% | 0.80% | 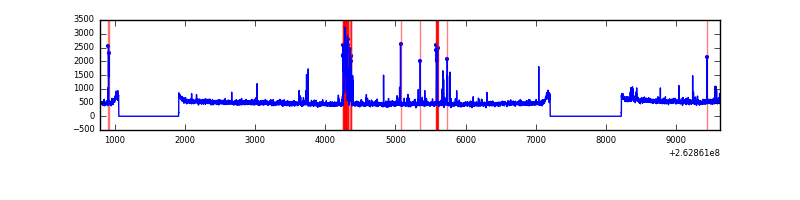 |
| C | 8839 | 6971 | 5 | 5 | 0.06% | 0.07% | 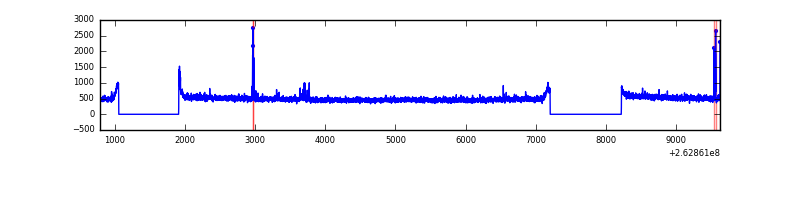 |
| D | 8839 | 6971 | 66 | 66 | 0.75% | 0.95% | 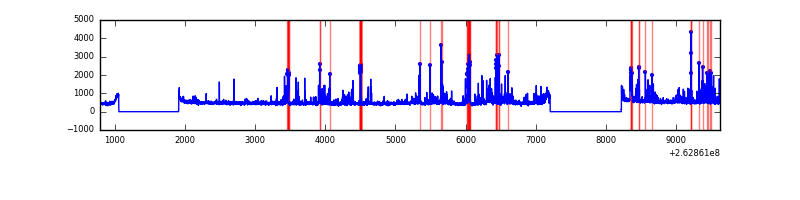 |
Top three noisy pixels from each quadrant. If the there are fewer than three noisy pixels in the level2.evt file, extra rows are filled as -1
| Pixel properties | Quadrant properties | ||||||
|---|---|---|---|---|---|---|---|
| Quadrant | DetID | PixID | Counts | Sigma | Mean | Median | Sigma |
| A | 12 | 189 | 23837 | 130.0 | 864 | 844 | 176.9 |
| A | 1 | 162 | 11476 | 60.11 | 864 | 844 | 176.9 |
| A | 2 | 79 | 9487 | 48.87 | 864 | 844 | 176.9 |
| B | 10 | 16 | 167000 | 1016.3 | 855 | 834 | 163.5 |
| B | 3 | 64 | 39022 | 233.57 | 855 | 834 | 163.5 |
| B | 0 | 189 | 34207 | 204.12 | 855 | 834 | 163.5 |
| C | 3 | 233 | 220948 | 1136.22 | 831 | 835 | 193.7 |
| C | 0 | 207 | 29771 | 149.37 | 831 | 835 | 193.7 |
| C | 13 | 61 | 5917 | 26.23 | 831 | 835 | 193.7 |
| D | 1 | 52 | 286278 | 1437.71 | 827 | 804 | 198.6 |
| D | 13 | 189 | 220705 | 1107.47 | 827 | 804 | 198.6 |
| D | 7 | 80 | 119909 | 599.84 | 827 | 804 | 198.6 |
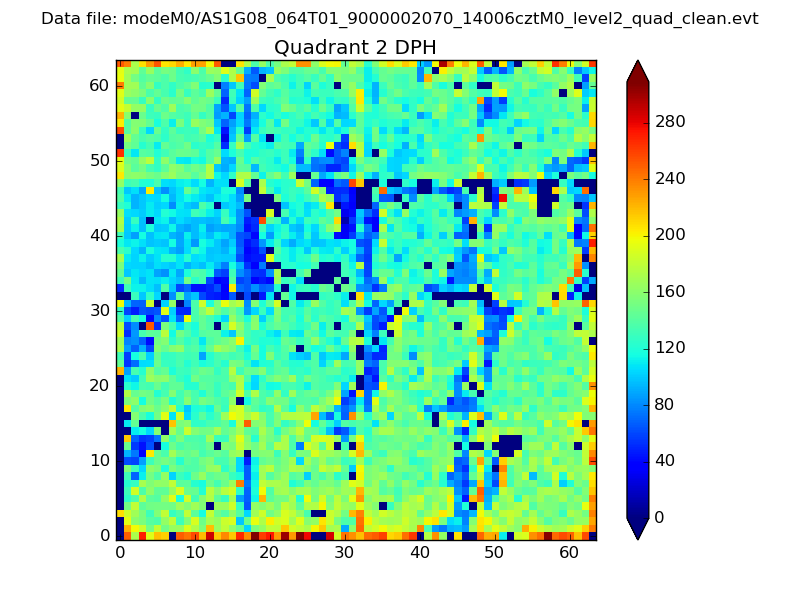
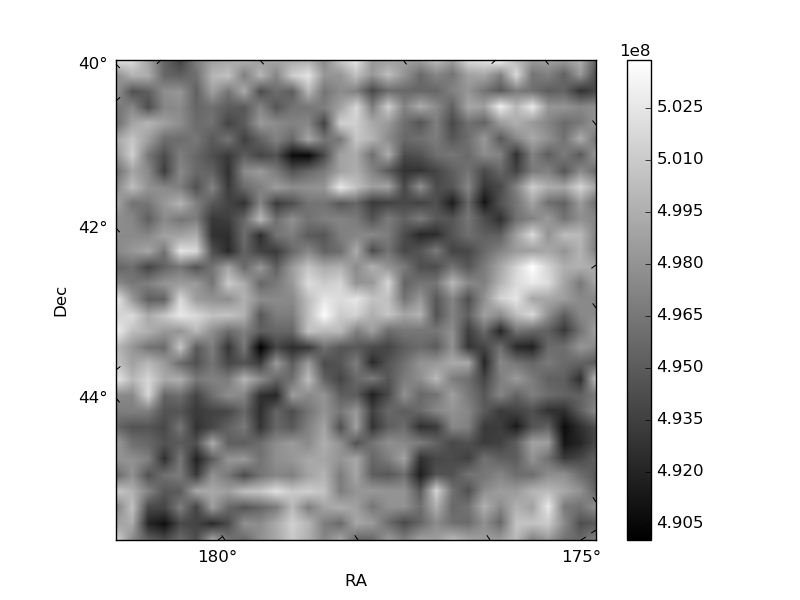
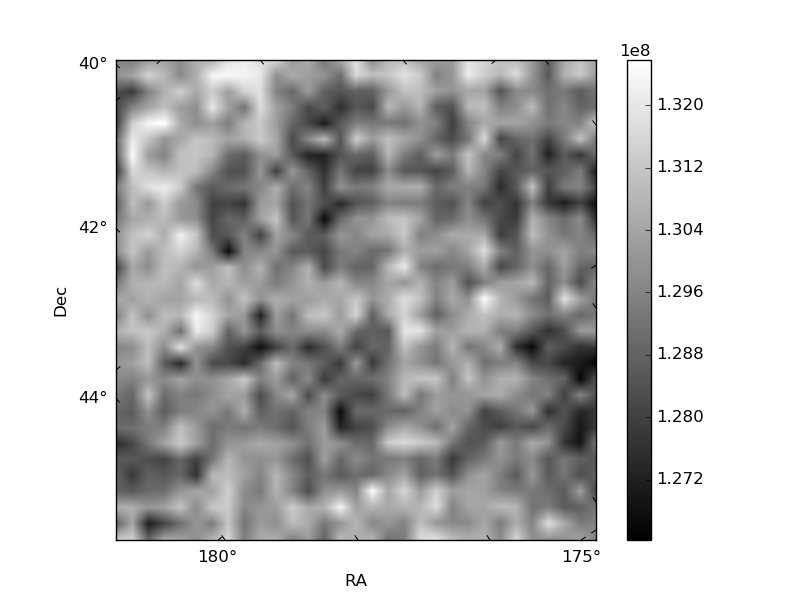
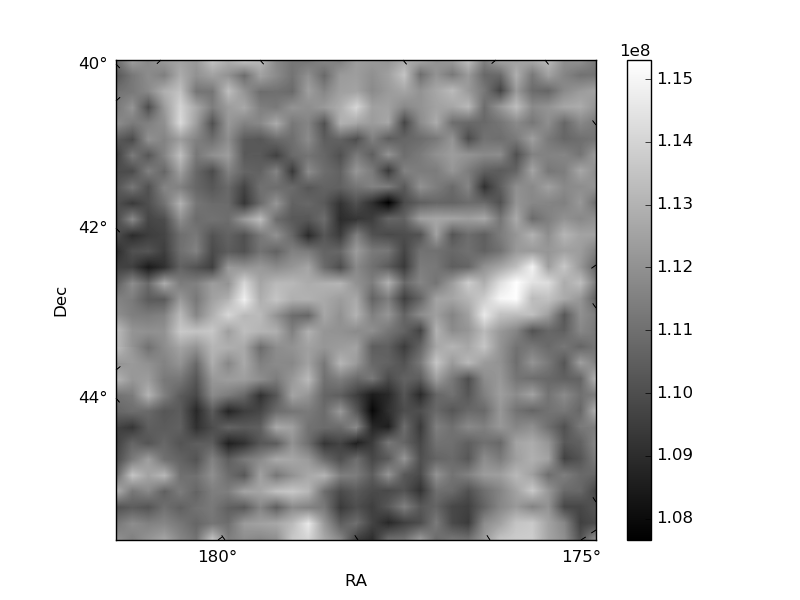
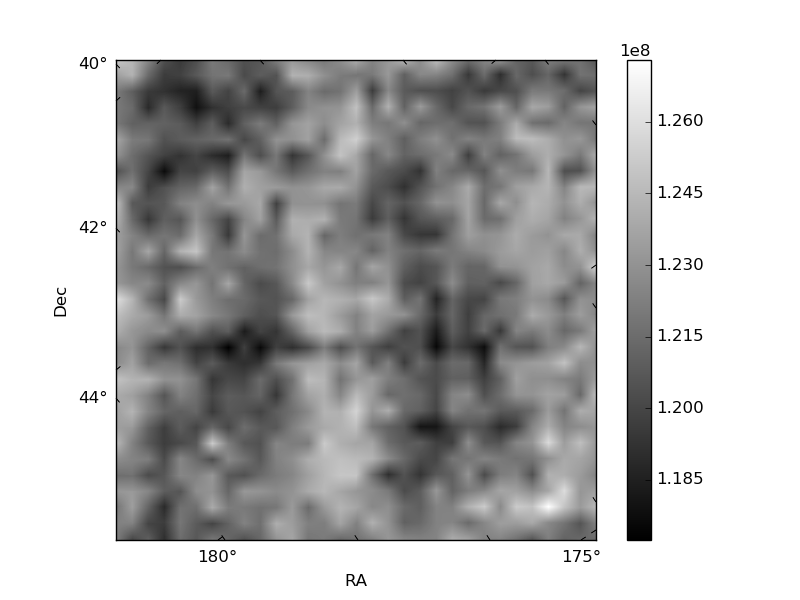
Histogram calculated using DETX and DETY for each event in the final _common_clean file
| Quadrant A | 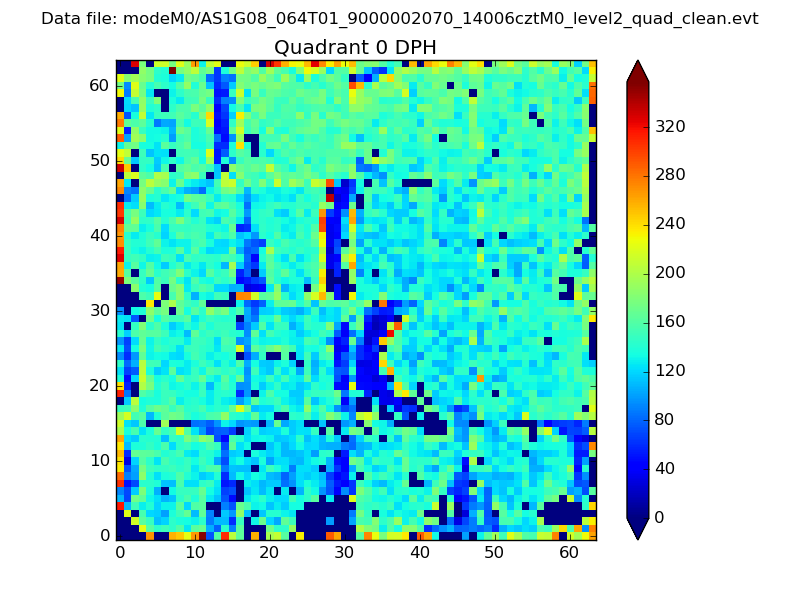 |
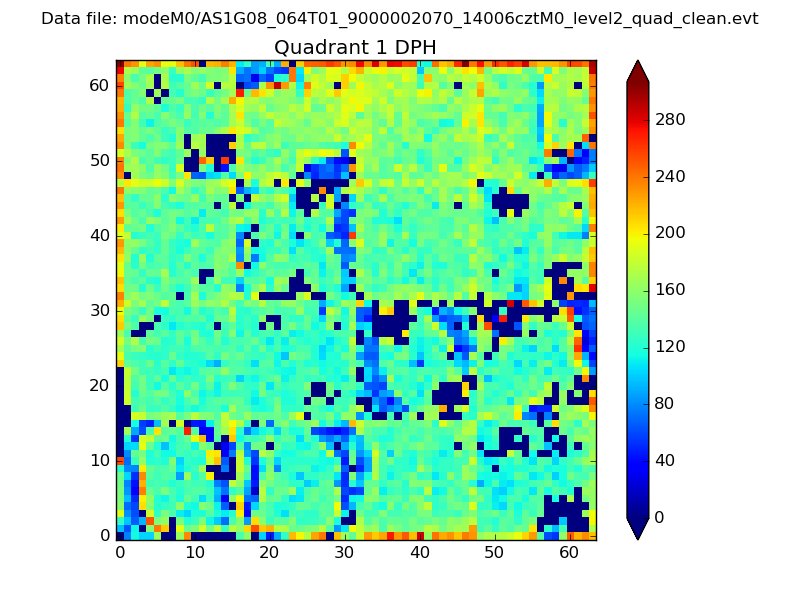 |
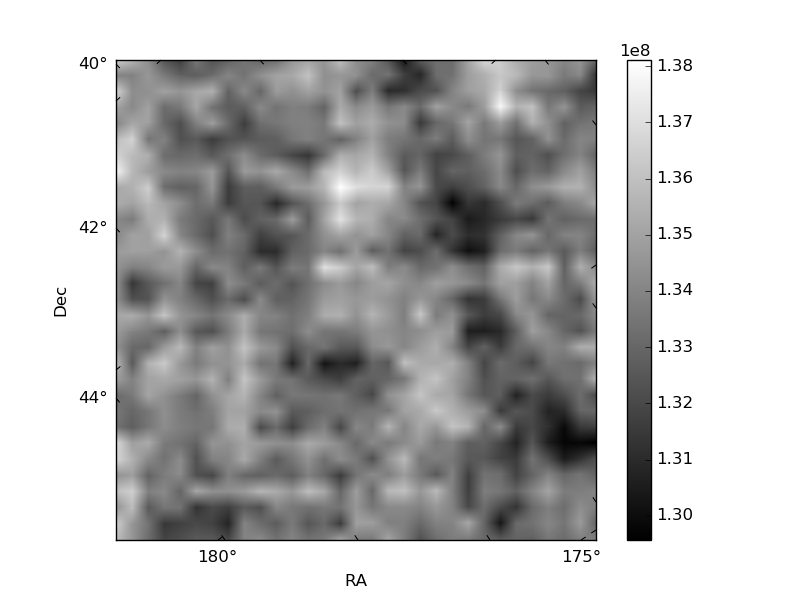
Quadrant B |
|---|---|---|---|
| Quadrant D | 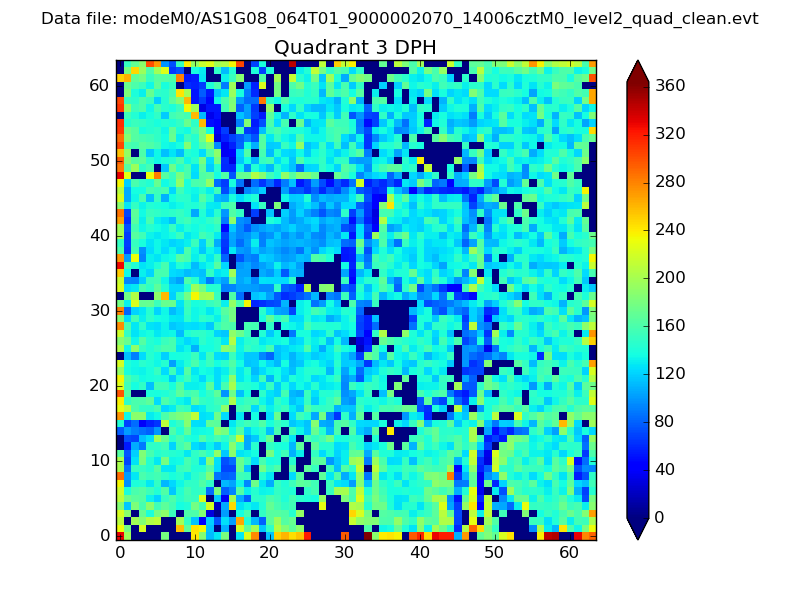 |
 |
Quadrant C |
| Plot type | Count rate plots | Images |
|---|---|---|
| Comparison with Poisson distribution Blue bars denote a histogram of data divided into 1 sec bins. Red curve is a Poisson curve with rate = median count rate of data. |
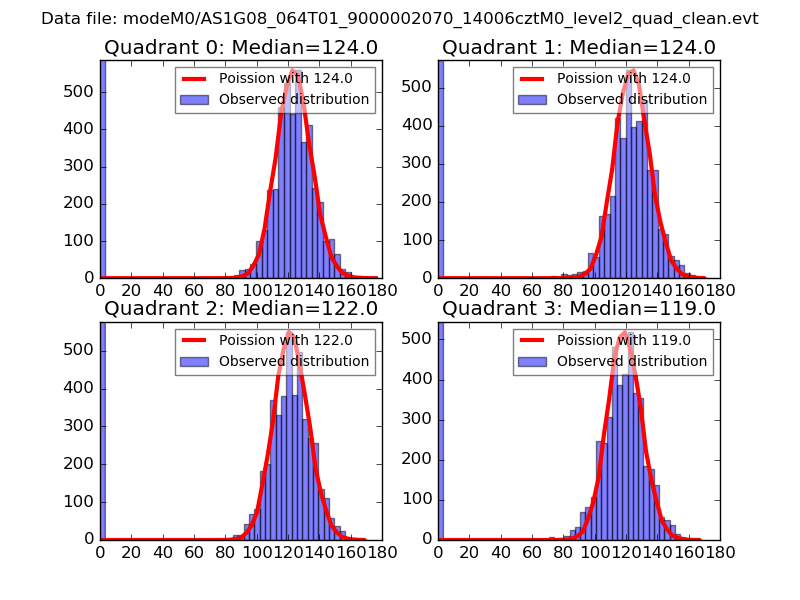 |
 |
| Quadrant-wise count rates Data is divided into 100 sec bins |
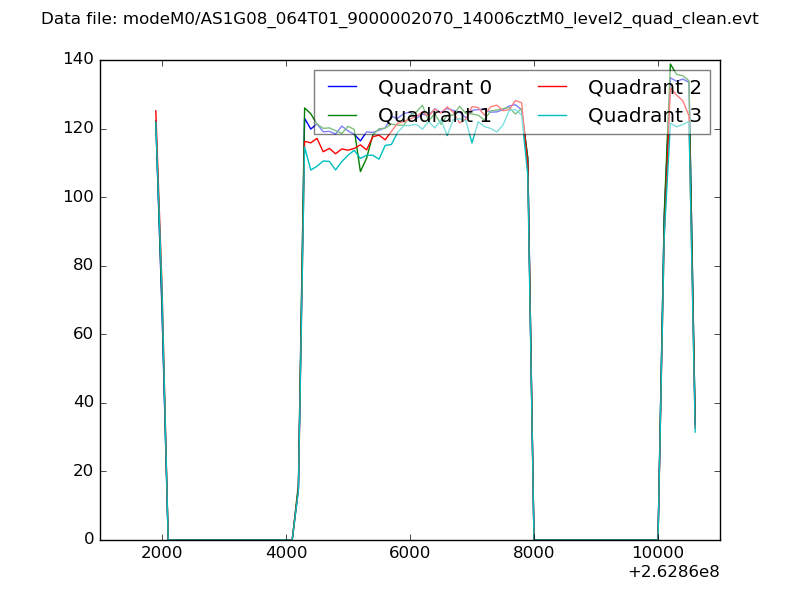 |
|
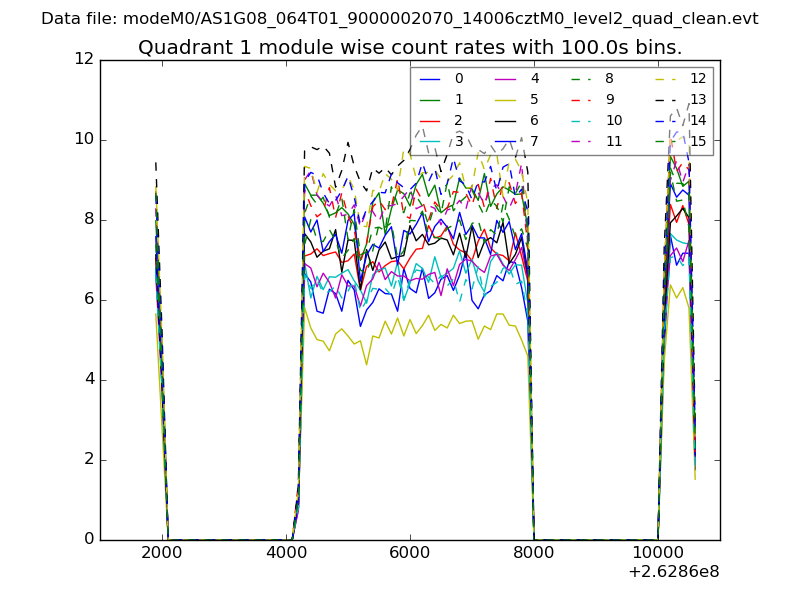
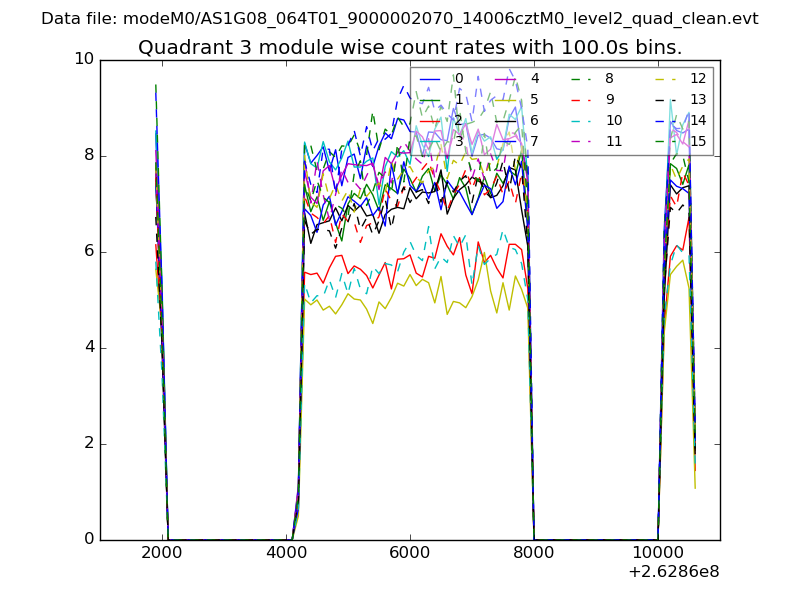
| Module-wise count rates for Quadrant A Data is divided into 100 sec bins |
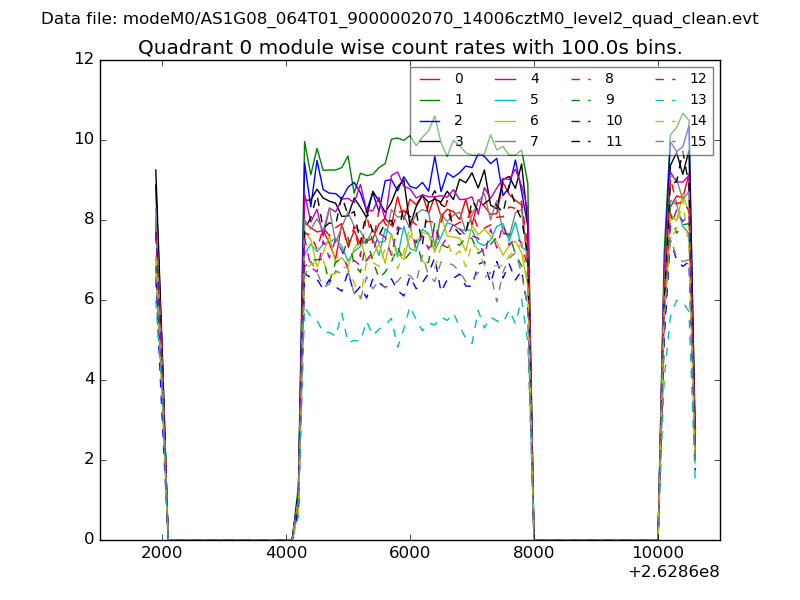 |
 |
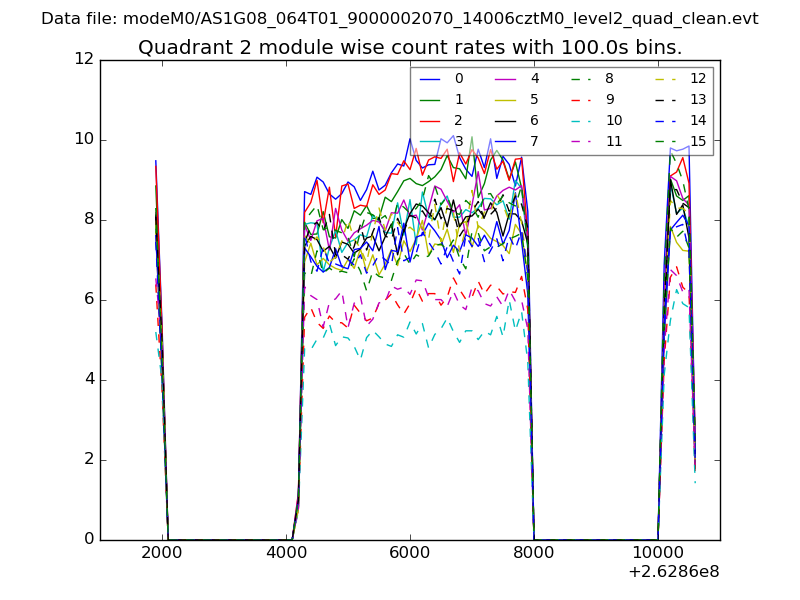
| Module-wise count rates for Quadrant B Data is divided into 100 sec bins |
 |
 |
| Module-wise count rates for Quadrant C Data is divided into 100 sec bins |
 |
 |
| Module-wise count rates for Quadrant D Data is divided into 100 sec bins |
 |
 |
| Parameter | Plot |
|---|---|
| CZT HV Monitor | 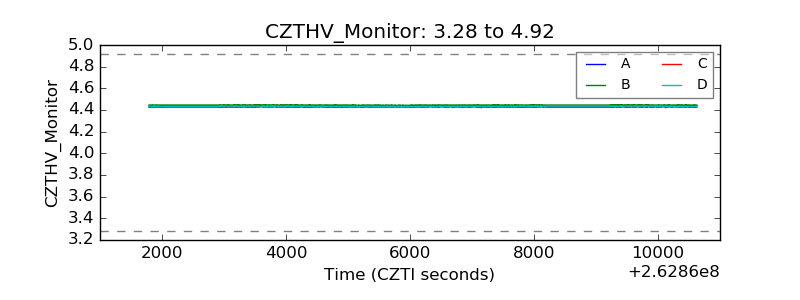 |
| D_VDD | 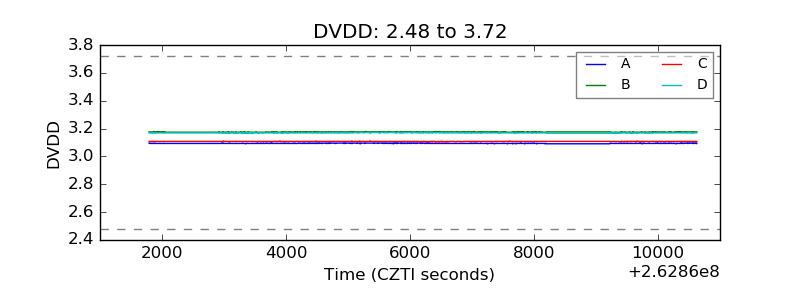 |
| Temperature 1 | 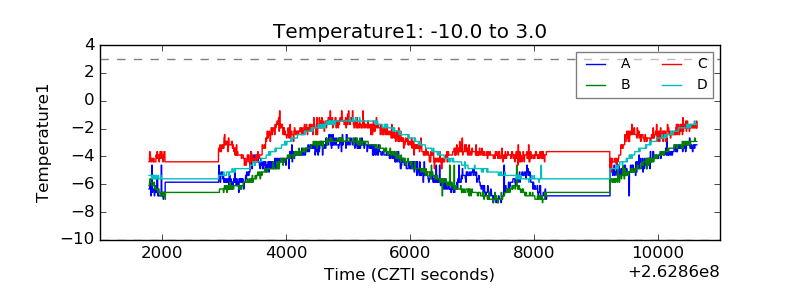 |
| Veto HV Monitor | 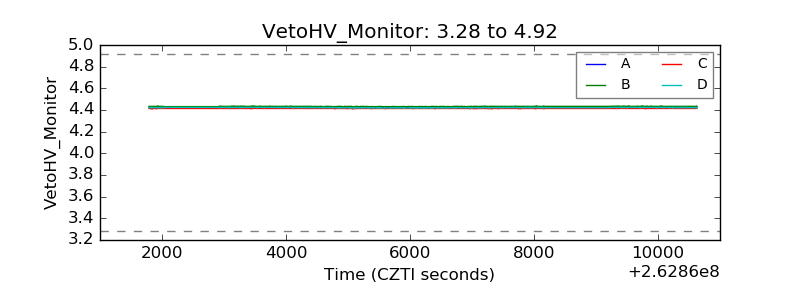 |
| Veto LLD | 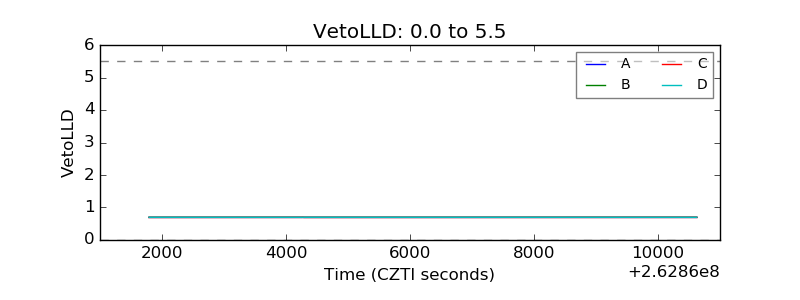 |
| Alpha Counter | 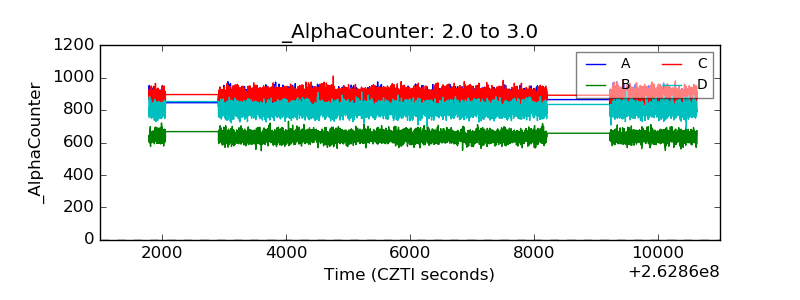 |
| _CPM_Rate | 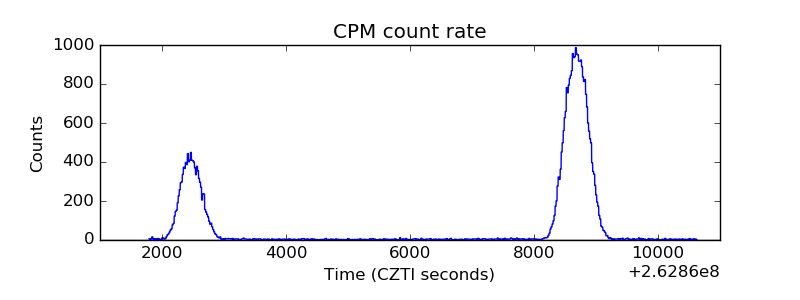 |
| CZT Counter |  |
| +2.5 Volts monitor |  |
| +5 Volts monitor |  |
| _ROLL_ROT | 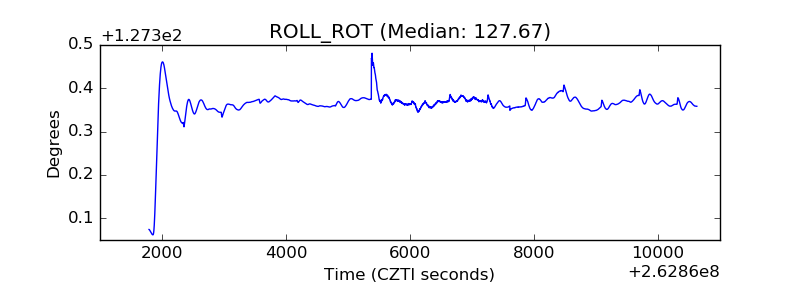 |
| _Roll_DEC | 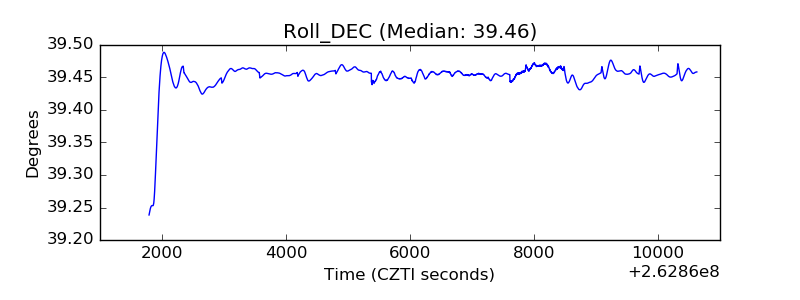 |
| _Roll_RA | 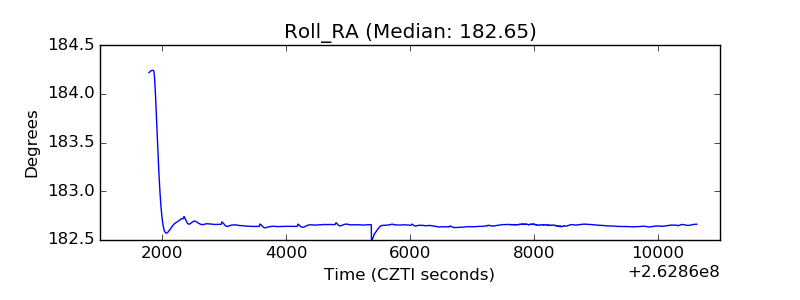 |
| Veto Counter | 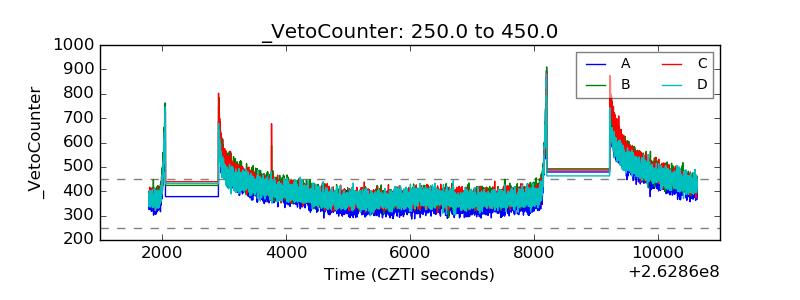 |