| Param | Original file | Final file |
|---|---|---|
| Filename | modeM0/AS1G08_064T01_9000002070_14010cztM0_level2.evt | modeM0/AS1G08_064T01_9000002070_14010cztM0_level2_quad_clean.evt |
| Size (bytes) | 487,949,760 | 105,667,200 |
| Size | 465.3 MB | 100.8 MB |
| Events in quadrant A | 3,061,419 | 718,524 |
| Events in quadrant B | 3,314,008 | 718,659 |
| Events in quadrant C | 3,065,850 | 717,069 |
| Events in quadrant D | 4,935,271 | 632,913 |
| Mode M0 | |||
|---|---|---|---|
| Quadrant | BADHDUFLAG | Total packets | Discarded packets |
| A | 0 | 12792 | 2 |
| B | 0 | 13713 | 1 |
| C | 0 | 12788 | 1 |
| D | 0 | 18590 | 1 |
| Mode SS | |||
|---|---|---|---|
| Quadrant | BADHDUFLAG | Total packets | Discarded packets |
| A | 0 | 120 | 0 |
| B | 0 | 120 | 0 |
| C | 0 | 120 | 0 |
| D | 0 | 120 | 0 |
| Mode M9 | |||
|---|---|---|---|
| Quadrant | BADHDUFLAG | Total packets | Discarded packets |
| A | 0 | 13 | 0 |
| B | 0 | 13 | 0 |
| C | 0 | 13 | 0 |
| D | 0 | 13 | 0 |
| Quadrant | Total seconds | Saturated seconds | Saturation percentage |
|---|---|---|---|
| A | 5909 | 88 | 1.489254% |
| B | 5909 | 127 | 2.149264% |
| C | 5909 | 67 | 1.133864% |
| D | 5909 | 664 | 11.237096% |
Noise dominated data is calculated using 1-second bins in cleaned event files. If a bin has >2000 counts, and if more than 50% of those come from <1% of pixels, then it is considered to be noise-dominated and hence unusable.
| Quadrant | # 1 sec bins | Bins with >0 counts | Bins with >2000 counts | High rate bins dominated by noise | Noise dominated (total time) | Noise dominated (detector-on time) | Marked lightcurve |
|---|---|---|---|---|---|---|---|
| A | 7205 | 5911 | 5 | 5 | 0.07% | 0.08% | 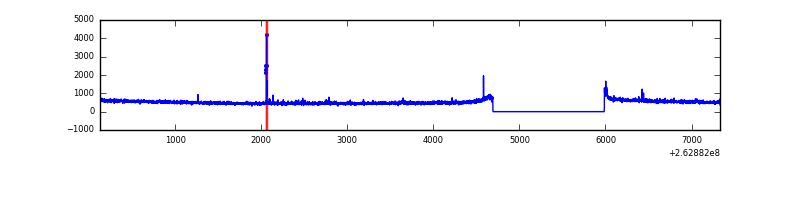 |
| B | 7205 | 5911 | 38 | 38 | 0.53% | 0.64% | 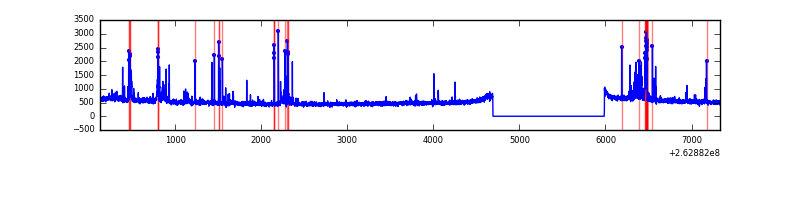 |
| C | 7205 | 5911 | 1 | 1 | 0.01% | 0.02% | 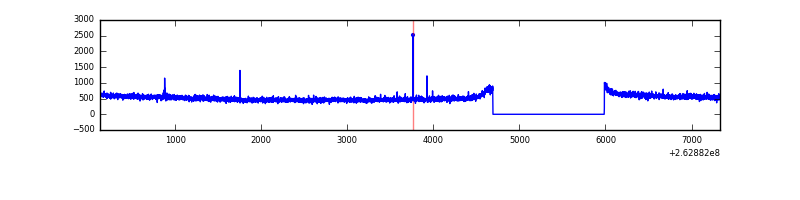 |
| D | 7205 | 5911 | 537 | 537 | 7.45% | 9.08% | 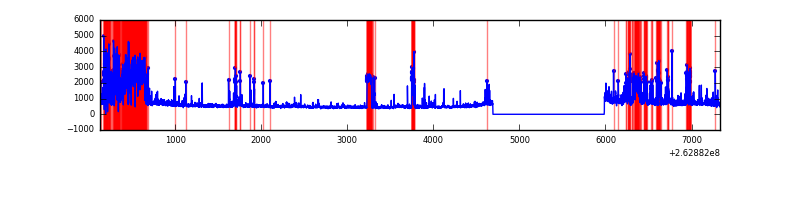 |
Top three noisy pixels from each quadrant. If the there are fewer than three noisy pixels in the level2.evt file, extra rows are filled as -1
| Pixel properties | Quadrant properties | ||||||
|---|---|---|---|---|---|---|---|
| Quadrant | DetID | PixID | Counts | Sigma | Mean | Median | Sigma |
| A | 12 | 189 | 45213 | 287.81 | 775 | 759 | 154.5 |
| A | 15 | 69 | 16738 | 103.45 | 775 | 759 | 154.5 |
| A | 8 | 15 | 15655 | 96.44 | 775 | 759 | 154.5 |
| B | 10 | 16 | 156588 | 1097.5 | 763 | 745 | 142.0 |
| B | 3 | 64 | 64189 | 446.8 | 763 | 745 | 142.0 |
| B | 0 | 189 | 34692 | 239.07 | 763 | 745 | 142.0 |
| C | 3 | 233 | 91803 | 524.36 | 761 | 768 | 173.6 |
| C | 14 | 234 | 5651 | 28.13 | 761 | 768 | 173.6 |
| C | 13 | 61 | 5333 | 26.29 | 761 | 768 | 173.6 |
| D | 10 | 157 | 1133691 | 6826.45 | 707 | 693 | 166.0 |
| D | 1 | 52 | 763085 | 4593.5 | 707 | 693 | 166.0 |
| D | 13 | 189 | 131357 | 787.27 | 707 | 693 | 166.0 |
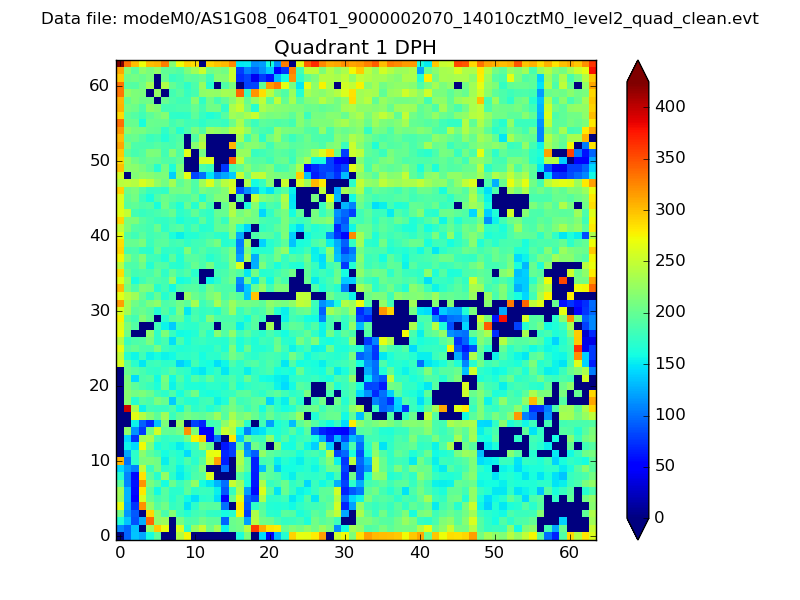
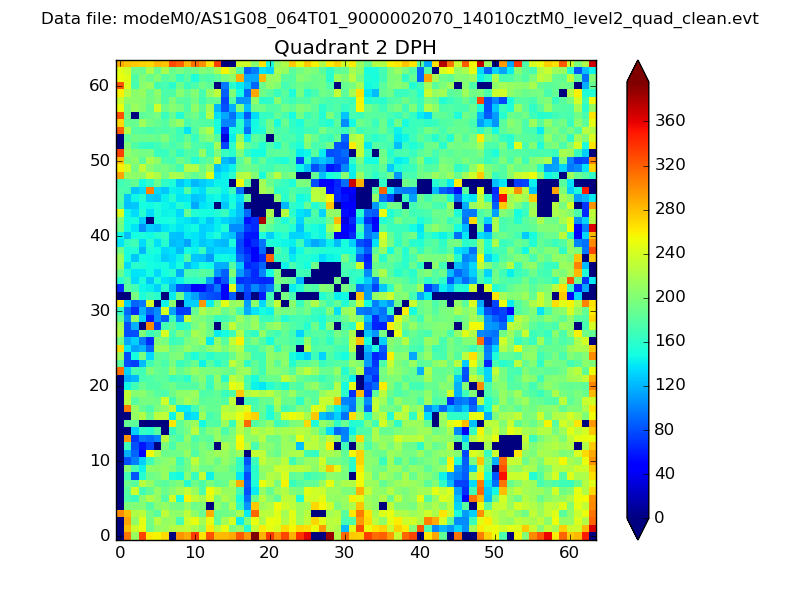
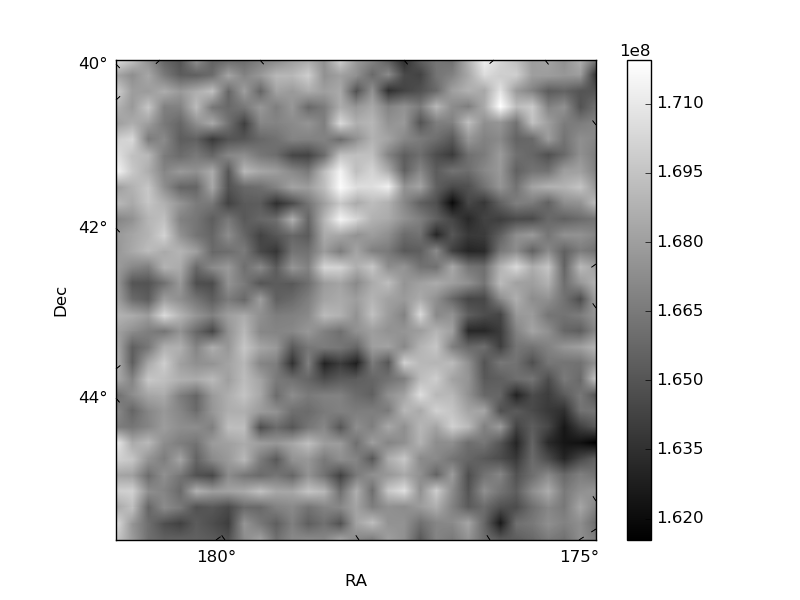
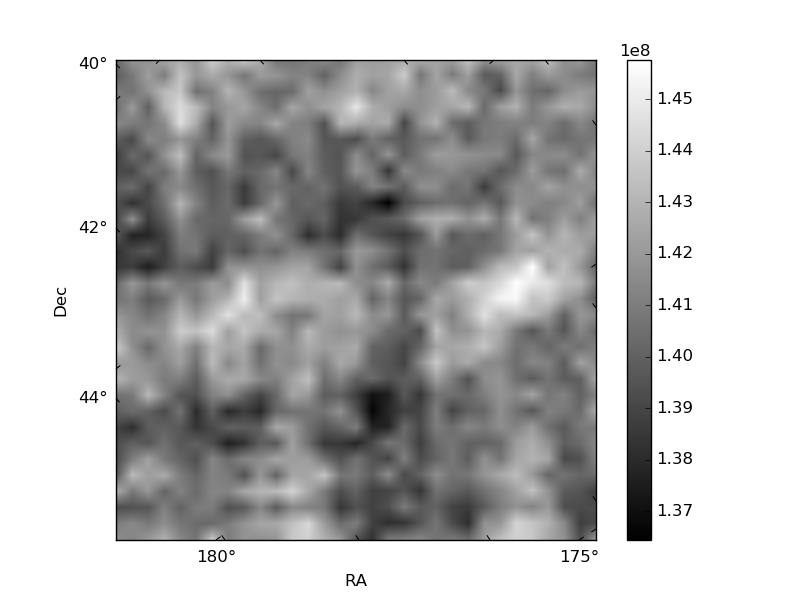
Histogram calculated using DETX and DETY for each event in the final _common_clean file
| Quadrant A |  |
 |
Quadrant B |
|---|---|---|---|
| Quadrant D |  |
 |
Quadrant C |
| Plot type | Count rate plots | Images |
|---|---|---|
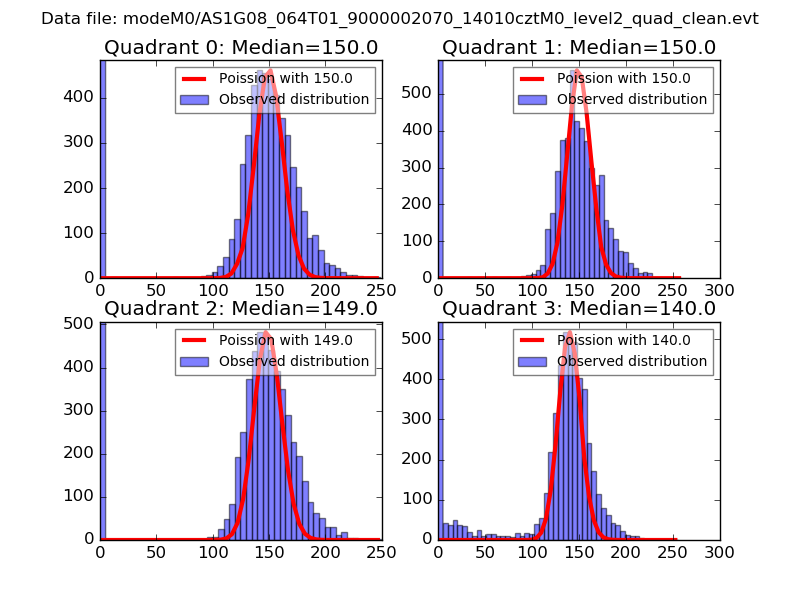
| Comparison with Poisson distribution Blue bars denote a histogram of data divided into 1 sec bins. Red curve is a Poisson curve with rate = median count rate of data. |
 |
 |
| Quadrant-wise count rates Data is divided into 100 sec bins |
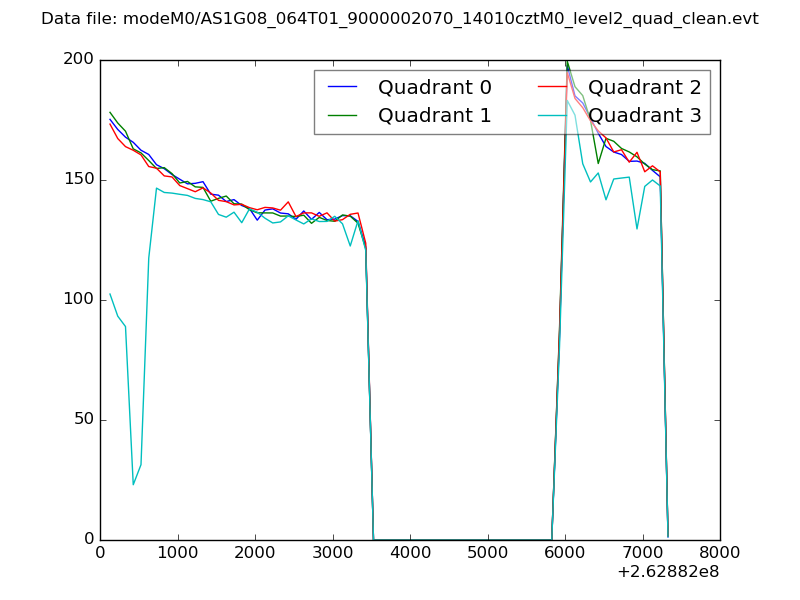 |
|
| Module-wise count rates for Quadrant A Data is divided into 100 sec bins |
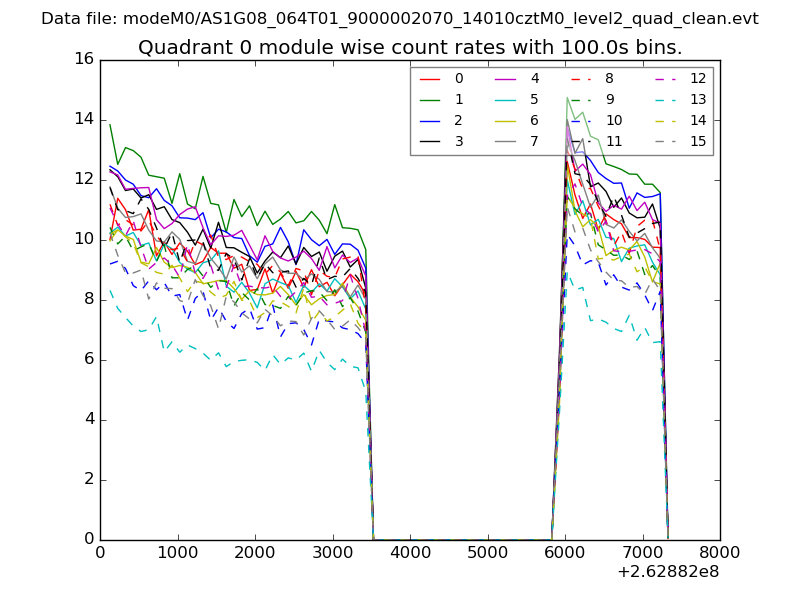 |
 |
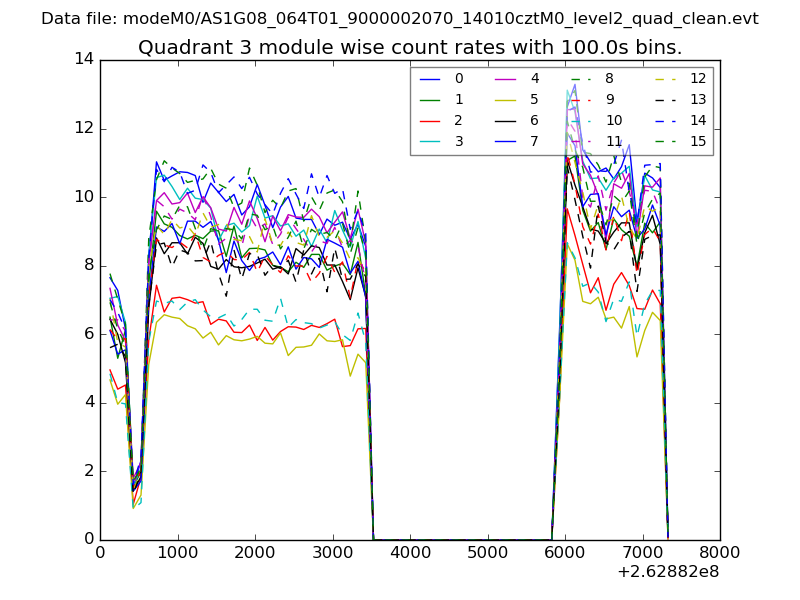
| Module-wise count rates for Quadrant B Data is divided into 100 sec bins |
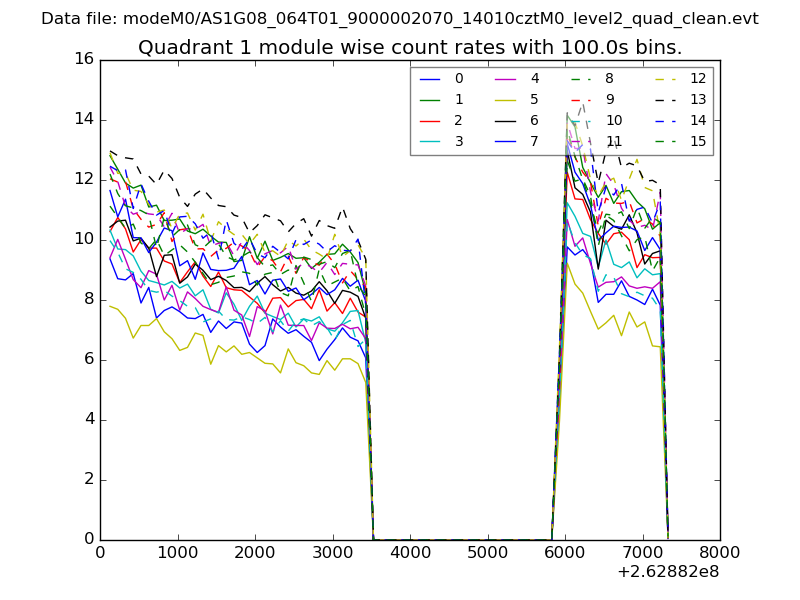 |
 |
| Module-wise count rates for Quadrant C Data is divided into 100 sec bins |
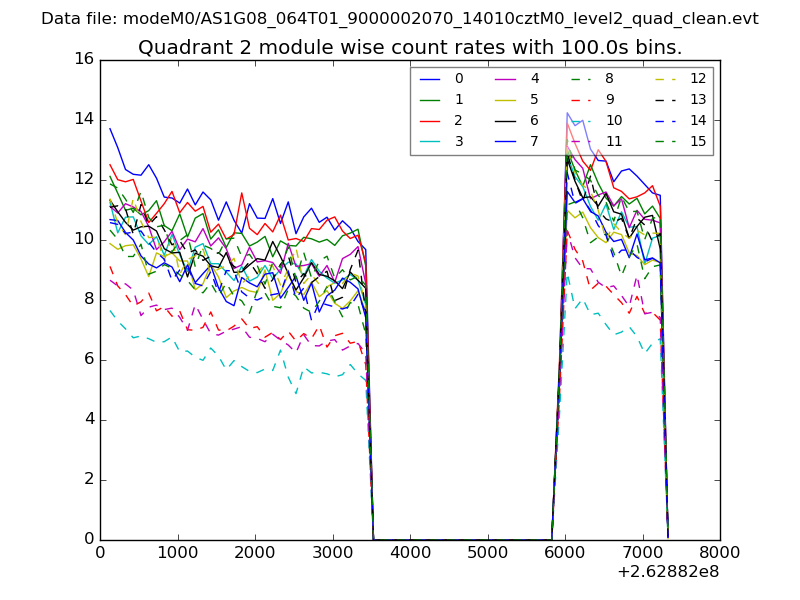 |
 |
| Module-wise count rates for Quadrant D Data is divided into 100 sec bins |
 |
 |
| Parameter | Plot |
|---|---|
| CZT HV Monitor | 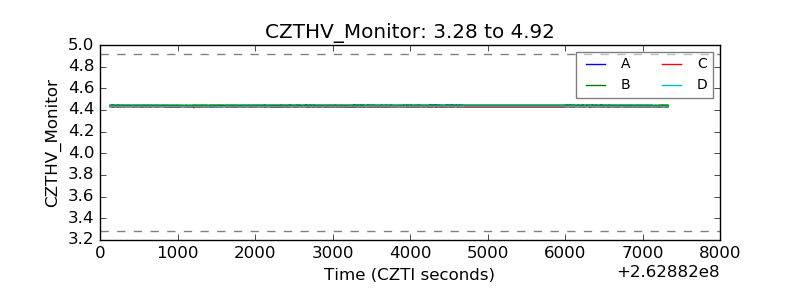 |
| D_VDD | 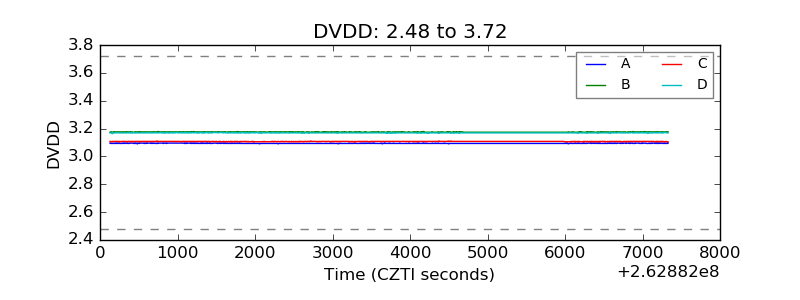 |
| Temperature 1 | 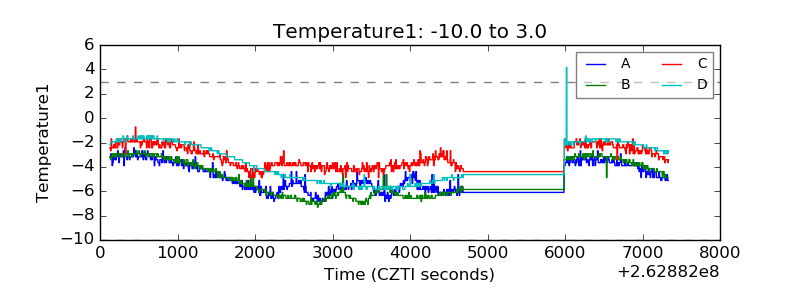 |
| Veto HV Monitor | 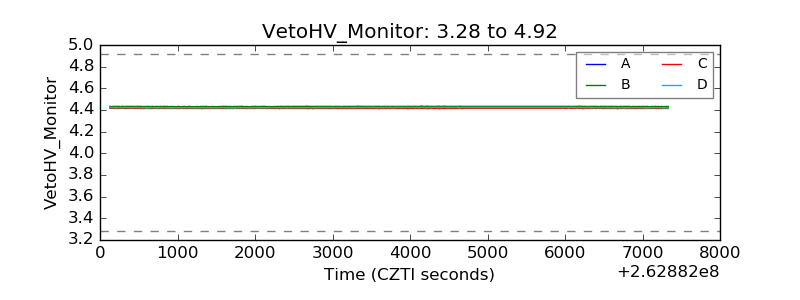 |
| Veto LLD | 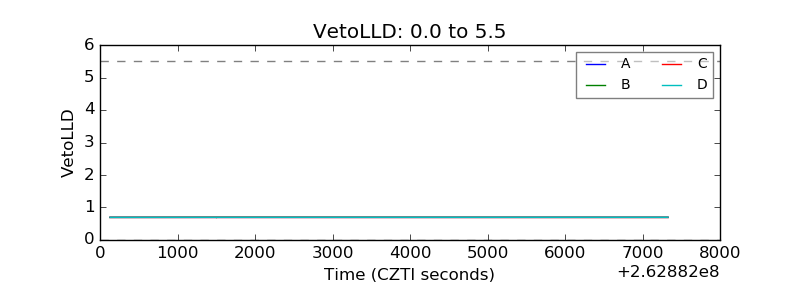 |
| Alpha Counter | 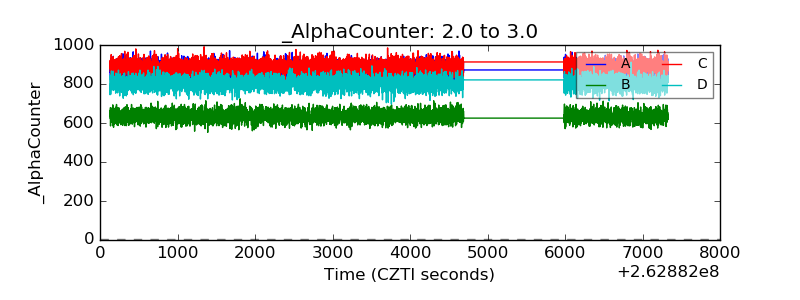 |
| _CPM_Rate |  |
| CZT Counter | 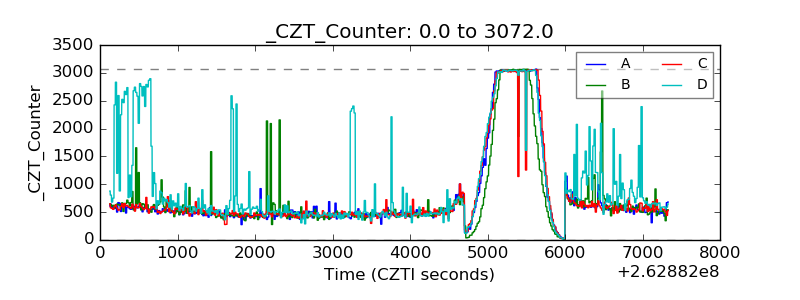 |
| +2.5 Volts monitor | 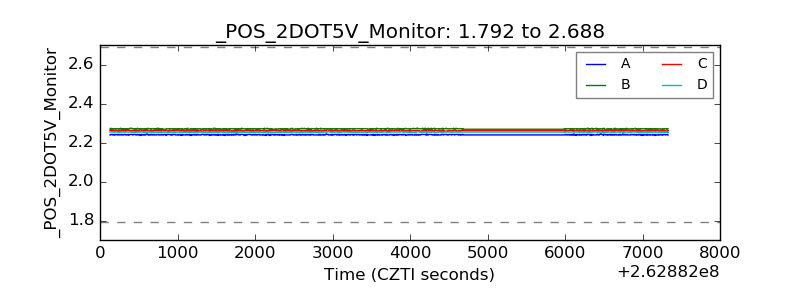 |
| +5 Volts monitor | 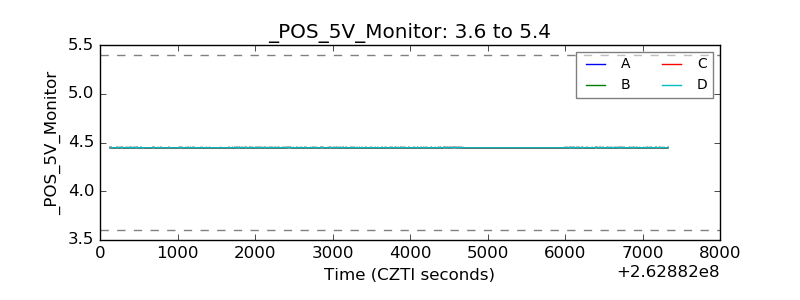 |
| _ROLL_ROT | 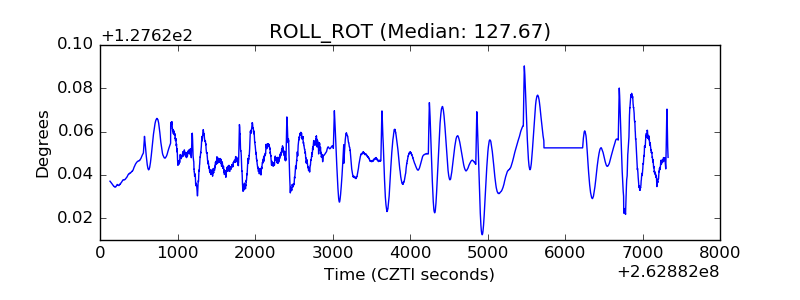 |
| _Roll_DEC | 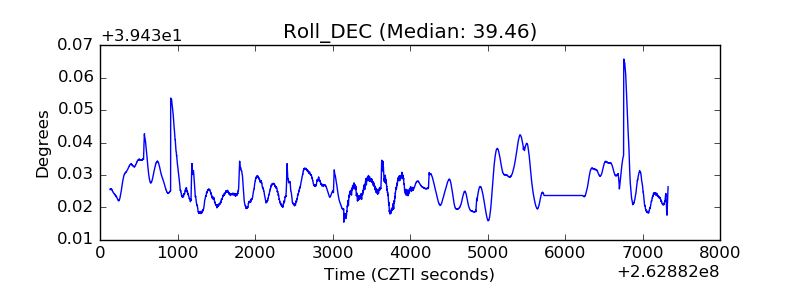 |
| _Roll_RA | 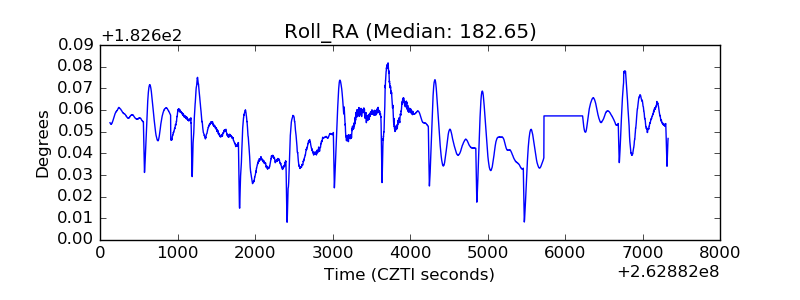 |
| Veto Counter | 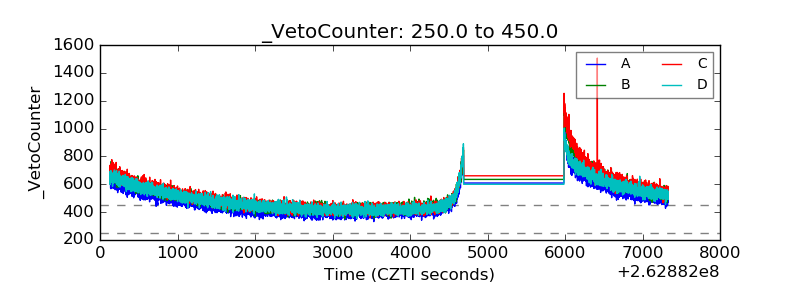 |