| Param | Original file | Final file |
|---|---|---|
| Filename | modeM0/AS1G08_064T01_9000002070_14012cztM0_level2.evt | modeM0/AS1G08_064T01_9000002070_14012cztM0_level2_quad_clean.evt |
| Size (bytes) | 482,362,560 | 94,458,240 |
| Size | 460.0 MB | 90.1 MB |
| Events in quadrant A | 3,142,840 | 609,686 |
| Events in quadrant B | 3,519,380 | 615,105 |
| Events in quadrant C | 3,139,412 | 615,123 |
| Events in quadrant D | 4,379,579 | 581,506 |
| Mode M0 | |||
|---|---|---|---|
| Quadrant | BADHDUFLAG | Total packets | Discarded packets |
| A | 0 | 13402 | 3 |
| B | 0 | 14488 | 2 |
| C | 0 | 13309 | 2 |
| D | 0 | 17292 | 2 |
| Mode SS | |||
|---|---|---|---|
| Quadrant | BADHDUFLAG | Total packets | Discarded packets |
| A | 0 | 130 | 0 |
| B | 0 | 130 | 0 |
| C | 0 | 130 | 0 |
| D | 0 | 130 | 0 |
| Mode M9 | |||
|---|---|---|---|
| Quadrant | BADHDUFLAG | Total packets | Discarded packets |
| A | 0 | 26 | 0 |
| B | 0 | 26 | 0 |
| C | 0 | 26 | 0 |
| D | 0 | 26 | 0 |
| Quadrant | Total seconds | Saturated seconds | Saturation percentage |
|---|---|---|---|
| A | 6291 | 88 | 1.398824% |
| B | 6291 | 176 | 2.797647% |
| C | 6291 | 86 | 1.367032% |
| D | 6291 | 209 | 3.322206% |
Noise dominated data is calculated using 1-second bins in cleaned event files. If a bin has >2000 counts, and if more than 50% of those come from <1% of pixels, then it is considered to be noise-dominated and hence unusable.
| Quadrant | # 1 sec bins | Bins with >0 counts | Bins with >2000 counts | High rate bins dominated by noise | Noise dominated (total time) | Noise dominated (detector-on time) | Marked lightcurve |
|---|---|---|---|---|---|---|---|
| A | 8902 | 6294 | 0 | 0 | 0.00% | 0.00% | 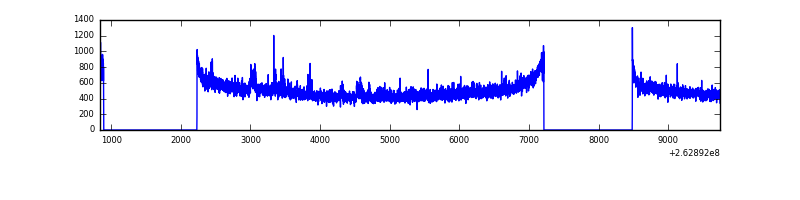 |
| B | 8902 | 6294 | 32 | 32 | 0.36% | 0.51% | 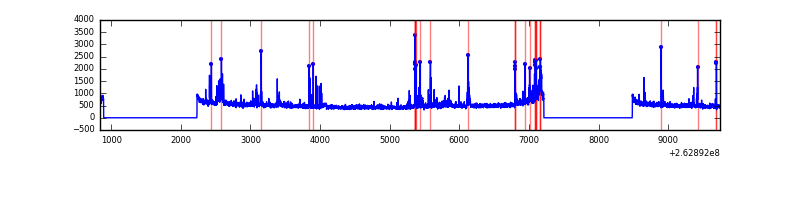 |
| C | 8902 | 6294 | 0 | 0 | 0.00% | 0.00% | 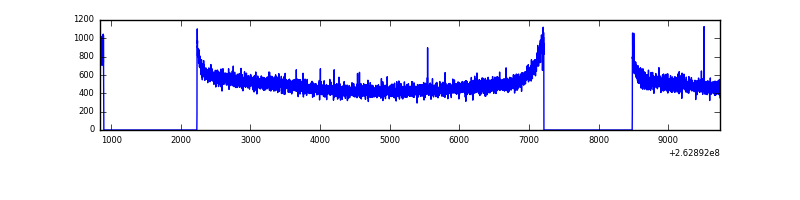 |
| D | 8902 | 6294 | 97 | 97 | 1.09% | 1.54% | 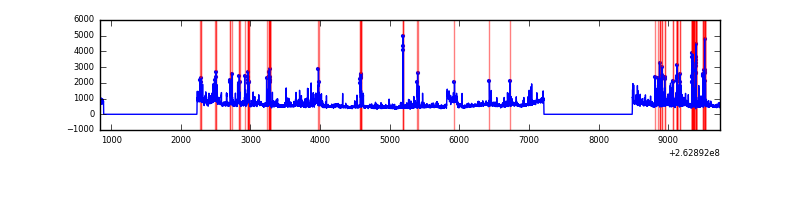 |
Top three noisy pixels from each quadrant. If the there are fewer than three noisy pixels in the level2.evt file, extra rows are filled as -1
| Pixel properties | Quadrant properties | ||||||
|---|---|---|---|---|---|---|---|
| Quadrant | DetID | PixID | Counts | Sigma | Mean | Median | Sigma |
| A | 12 | 189 | 45716 | 277.59 | 799 | 783 | 161.9 |
| A | 8 | 15 | 8975 | 50.61 | 799 | 783 | 161.9 |
| A | 1 | 162 | 8601 | 48.3 | 799 | 783 | 161.9 |
| B | 10 | 245 | 252890 | 1695.72 | 792 | 773 | 148.7 |
| B | 0 | 189 | 61187 | 406.34 | 792 | 773 | 148.7 |
| B | 10 | 16 | 34058 | 223.87 | 792 | 773 | 148.7 |
| C | 3 | 233 | 58015 | 313.64 | 790 | 796 | 182.4 |
| C | 13 | 61 | 5705 | 26.91 | 790 | 796 | 182.4 |
| C | 0 | 207 | 2121 | 7.26 | 790 | 796 | 182.4 |
| D | 1 | 52 | 561555 | 3069.56 | 775 | 759 | 182.7 |
| D | 10 | 157 | 328150 | 1792.0 | 775 | 759 | 182.7 |
| D | 8 | 195 | 236579 | 1290.78 | 775 | 759 | 182.7 |
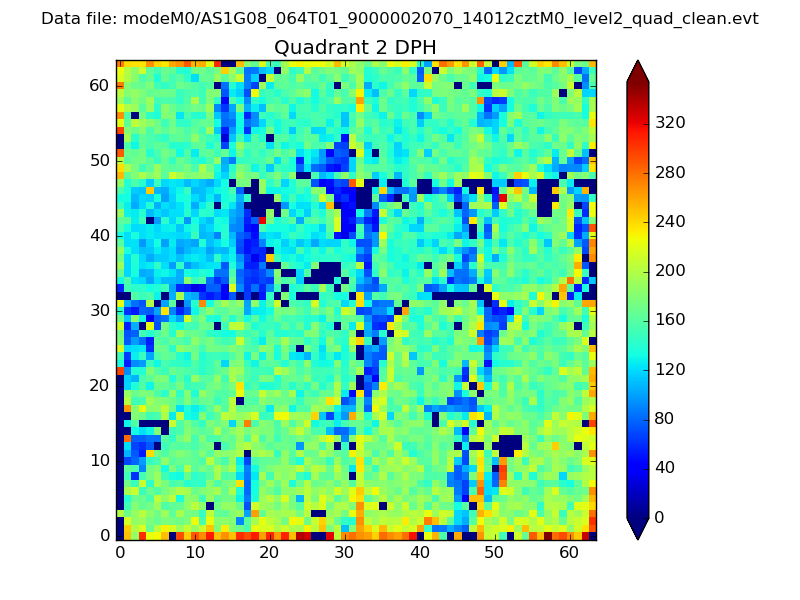
Histogram calculated using DETX and DETY for each event in the final _common_clean file
| Quadrant A | 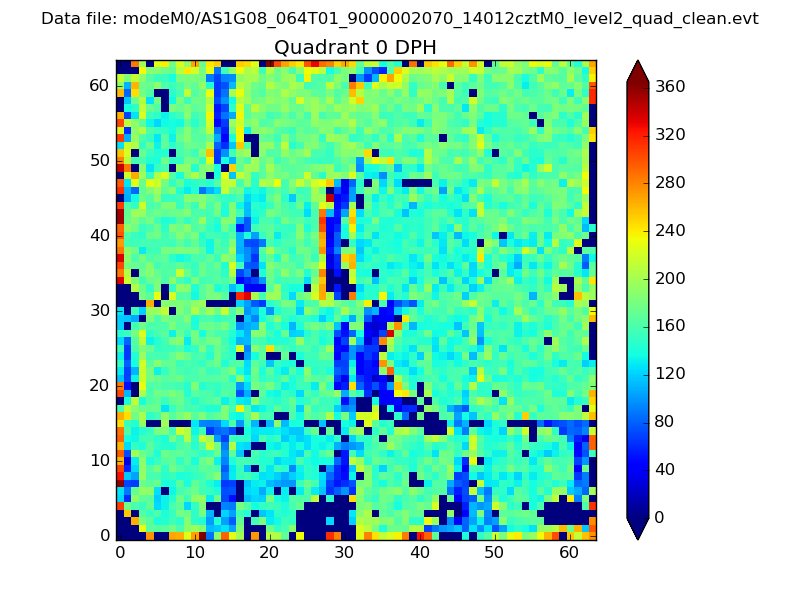 |
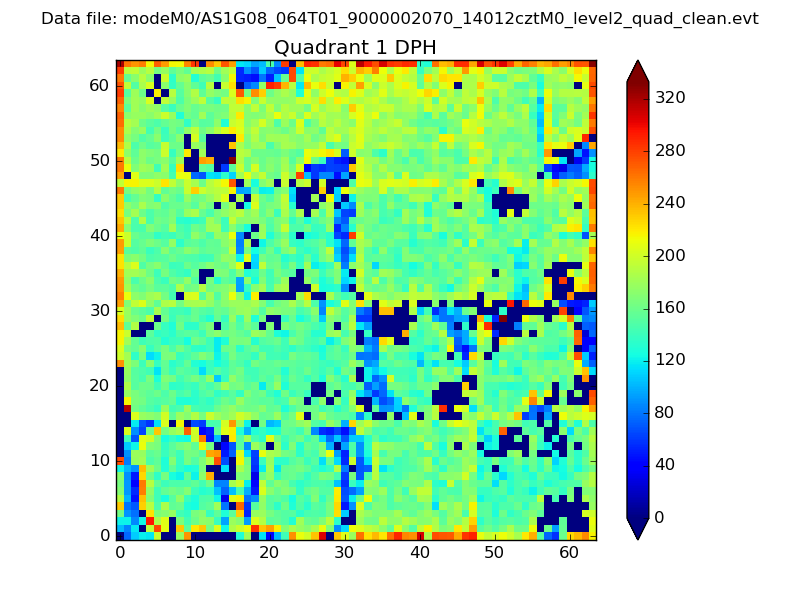 |
Quadrant B |
|---|---|---|---|
| Quadrant D | 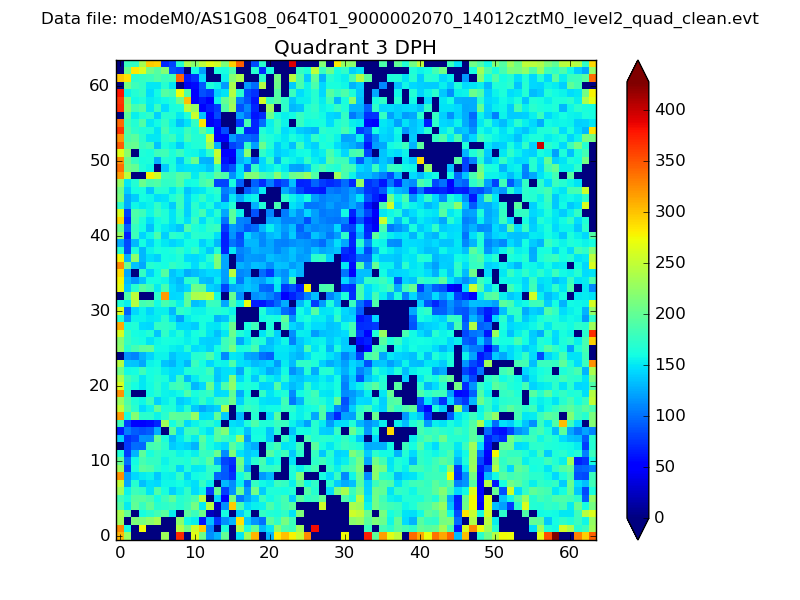 |
 |
Quadrant C |
| Plot type | Count rate plots | Images |
|---|---|---|
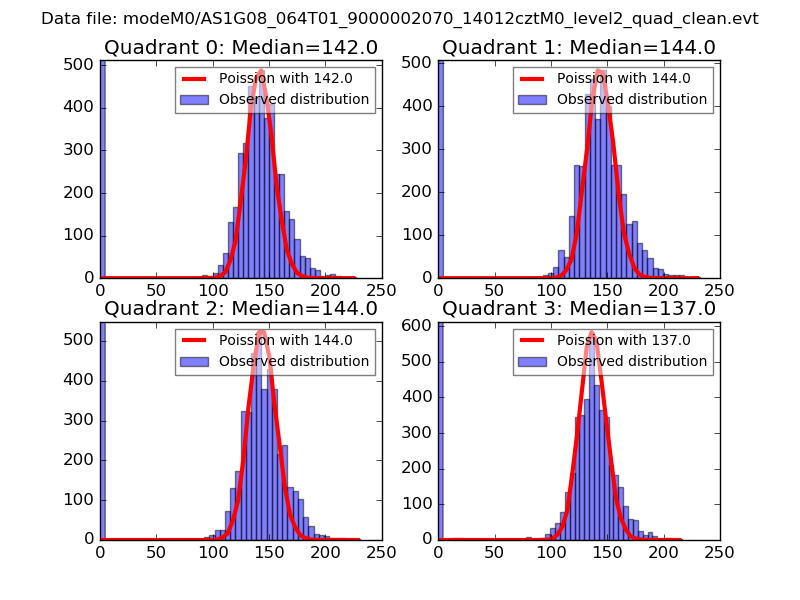
| Comparison with Poisson distribution Blue bars denote a histogram of data divided into 1 sec bins. Red curve is a Poisson curve with rate = median count rate of data. |
 |
 |
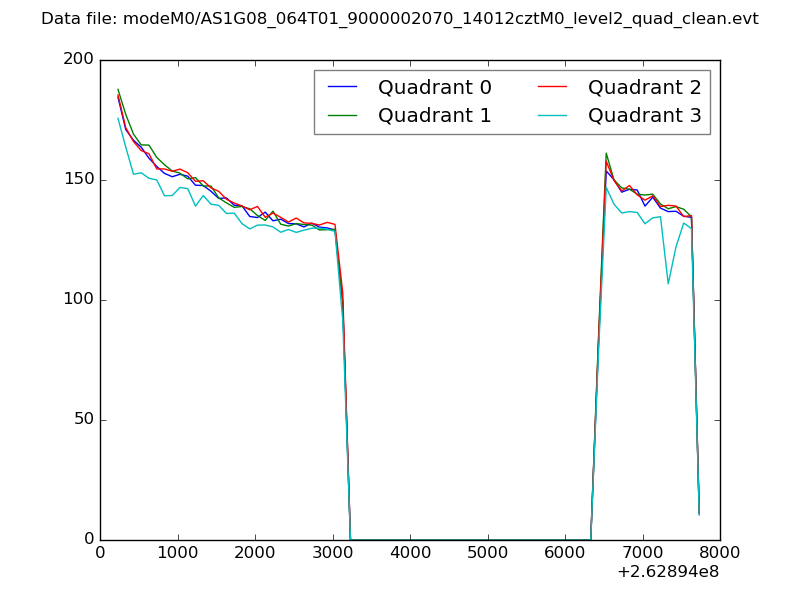
| Quadrant-wise count rates Data is divided into 100 sec bins |
 |
|
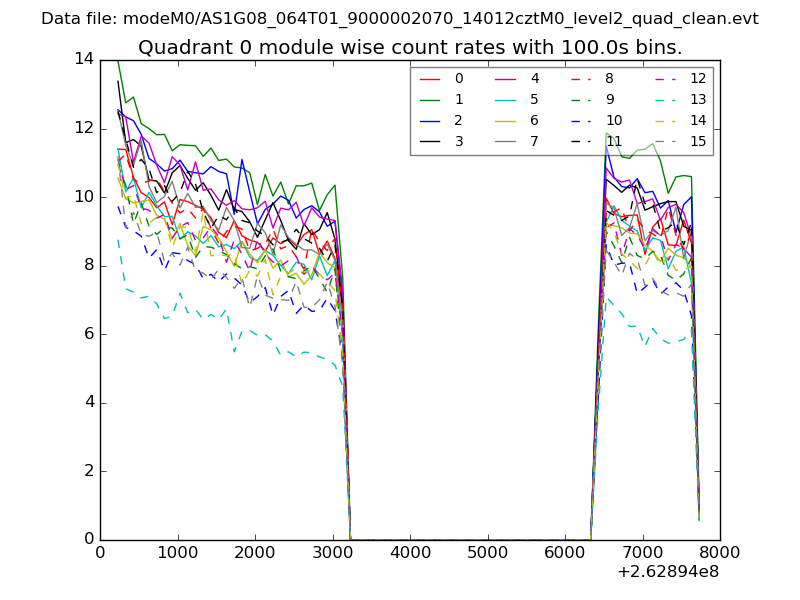
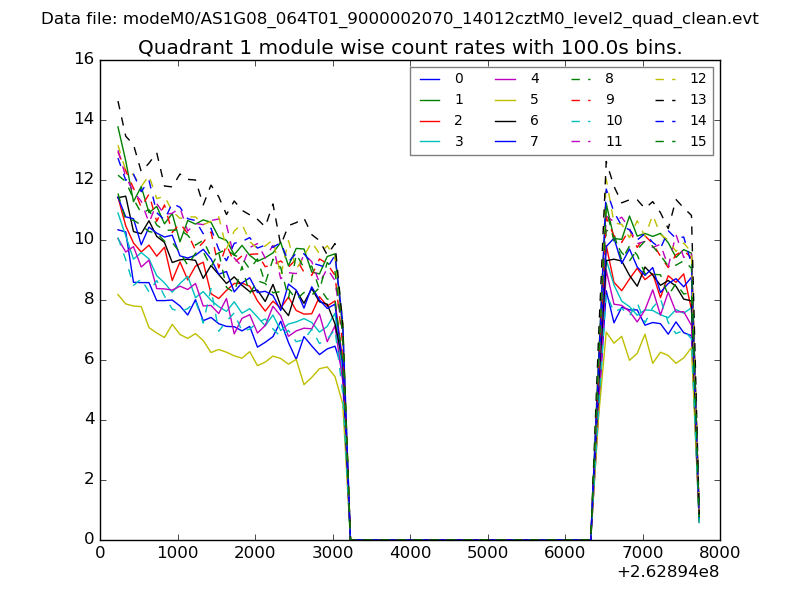
| Module-wise count rates for Quadrant A Data is divided into 100 sec bins |
 |
 |
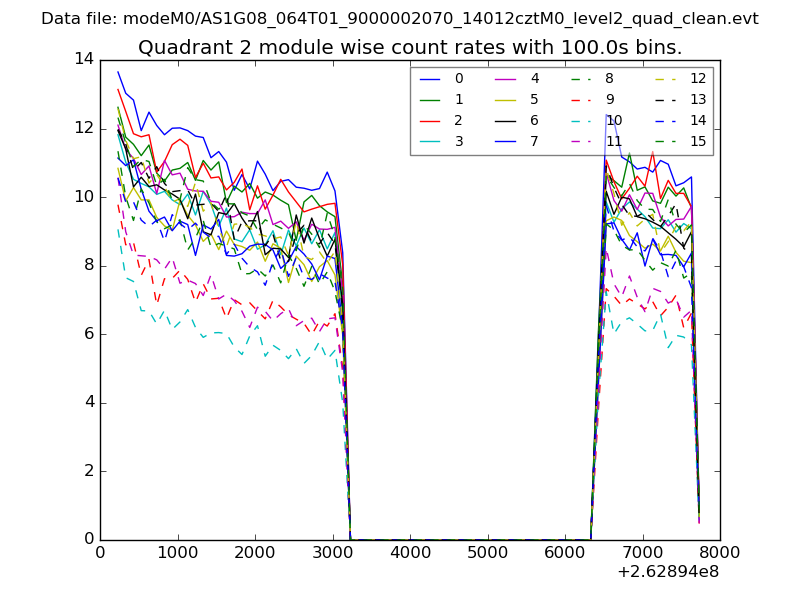
| Module-wise count rates for Quadrant B Data is divided into 100 sec bins |
 |
 |
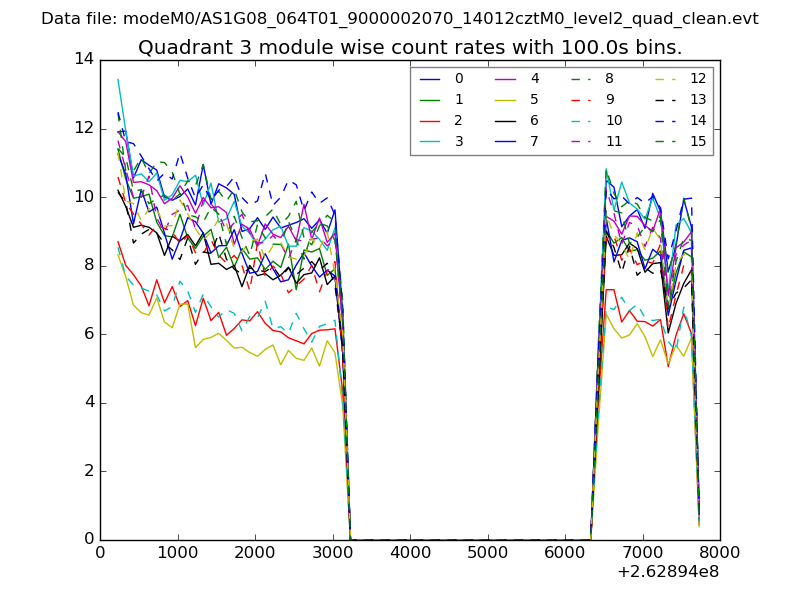
| Module-wise count rates for Quadrant C Data is divided into 100 sec bins |
 |
 |
| Module-wise count rates for Quadrant D Data is divided into 100 sec bins |
 |
 |
| Parameter | Plot |
|---|---|
| CZT HV Monitor | 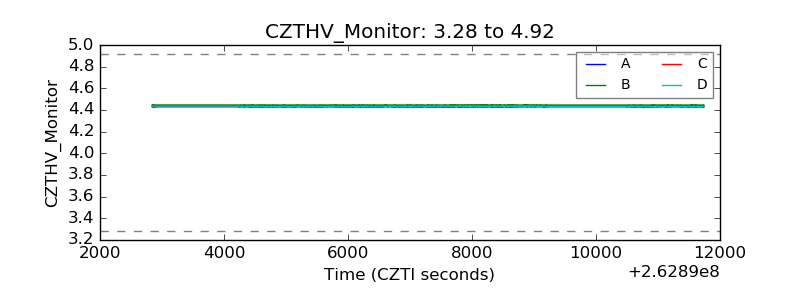 |
| D_VDD | 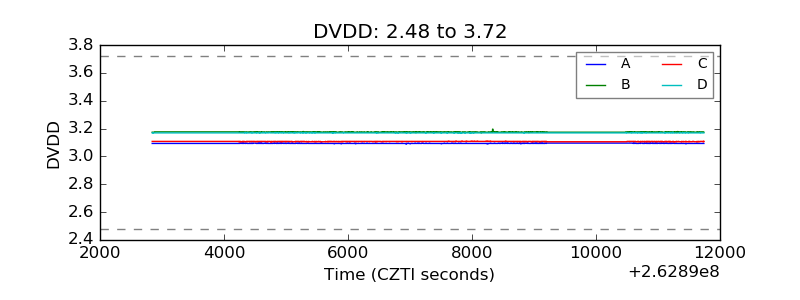 |
| Temperature 1 | 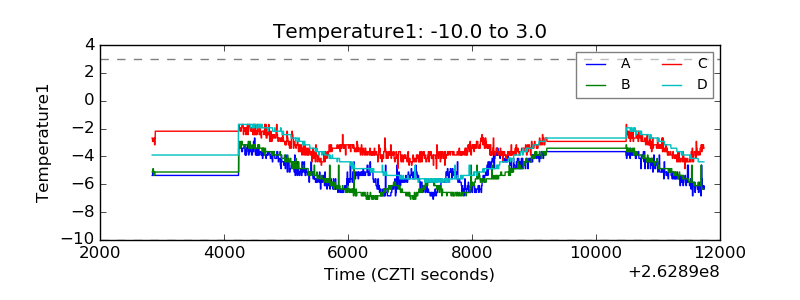 |
| Veto HV Monitor | 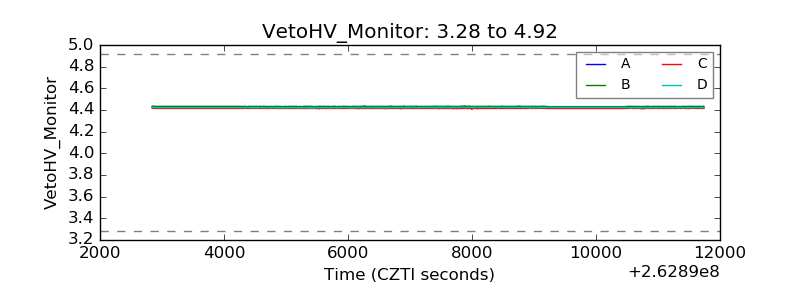 |
| Veto LLD | 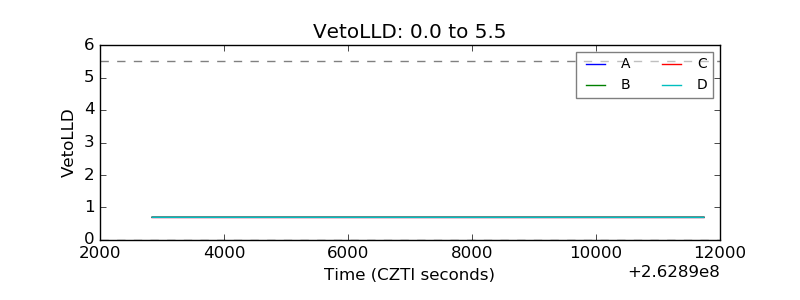 |
| Alpha Counter | 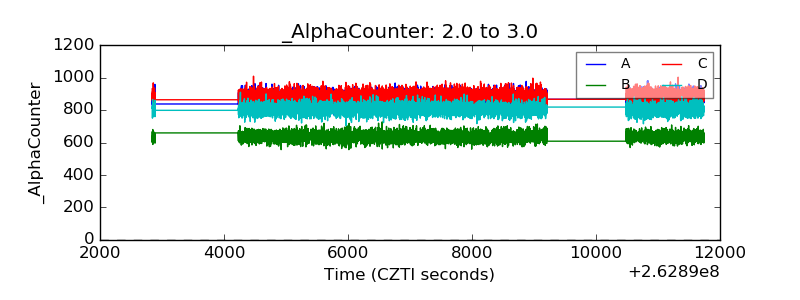 |
| _CPM_Rate | 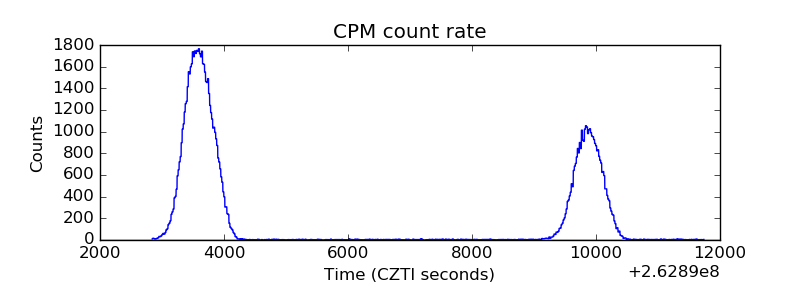 |
| CZT Counter | 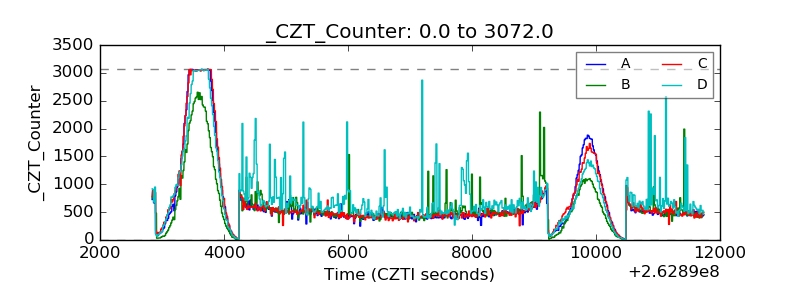 |
| +2.5 Volts monitor |  |
| +5 Volts monitor | 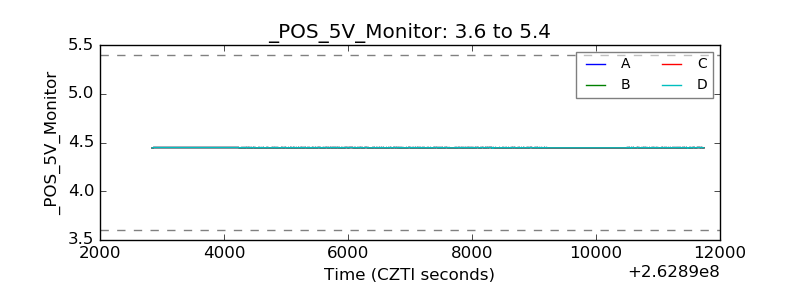 |
| _ROLL_ROT | 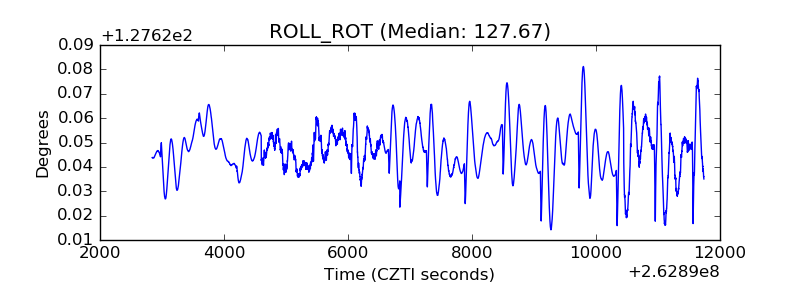 |
| _Roll_DEC | 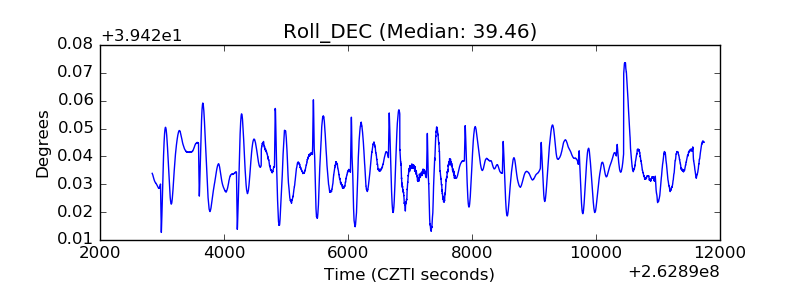 |
| _Roll_RA | 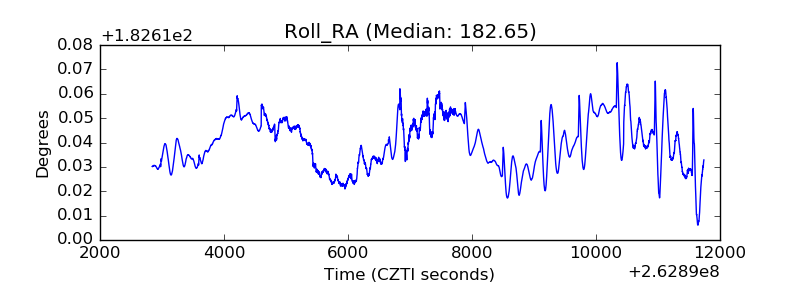 |
| Veto Counter | 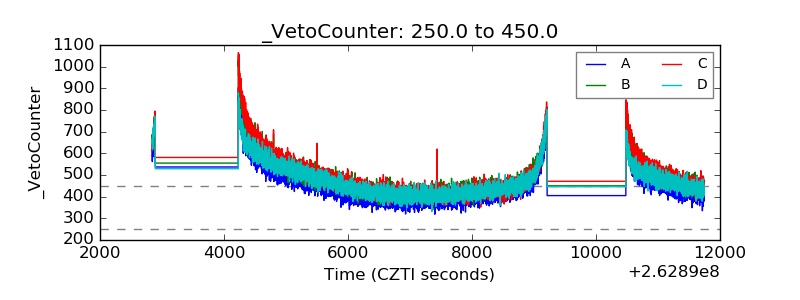 |