| Param | Original file | Final file |
|---|---|---|
| Filename | modeM0/AS1G08_064T01_9000002070_14015cztM0_level2.evt | modeM0/AS1G08_064T01_9000002070_14015cztM0_level2_quad_clean.evt |
| Size (bytes) | 574,427,520 | 120,841,920 |
| Size | 547.8 MB | 115.2 MB |
| Events in quadrant A | 3,988,438 | 772,634 |
| Events in quadrant B | 4,113,731 | 782,064 |
| Events in quadrant C | 3,945,708 | 779,738 |
| Events in quadrant D | 4,784,652 | 747,838 |
| Mode M0 | |||
|---|---|---|---|
| Quadrant | BADHDUFLAG | Total packets | Discarded packets |
| A | 0 | 17461 | 3 |
| B | 0 | 17887 | 2 |
| C | 0 | 17326 | 2 |
| D | 0 | 19792 | 2 |
| Mode SS | |||
|---|---|---|---|
| Quadrant | BADHDUFLAG | Total packets | Discarded packets |
| A | 0 | 170 | 0 |
| B | 0 | 170 | 0 |
| C | 0 | 170 | 0 |
| D | 0 | 170 | 0 |
| Mode M9 | |||
|---|---|---|---|
| Quadrant | BADHDUFLAG | Total packets | Discarded packets |
| A | 0 | 8 | 0 |
| B | 0 | 8 | 0 |
| C | 0 | 8 | 0 |
| D | 0 | 8 | 0 |
| Quadrant | Total seconds | Saturated seconds | Saturation percentage |
|---|---|---|---|
| A | 8315 | 72 | 0.865905% |
| B | 8315 | 91 | 1.094408% |
| C | 8315 | 42 | 0.505111% |
| D | 8315 | 110 | 1.322910% |
Noise dominated data is calculated using 1-second bins in cleaned event files. If a bin has >2000 counts, and if more than 50% of those come from <1% of pixels, then it is considered to be noise-dominated and hence unusable.
| Quadrant | # 1 sec bins | Bins with >0 counts | Bins with >2000 counts | High rate bins dominated by noise | Noise dominated (total time) | Noise dominated (detector-on time) | Marked lightcurve |
|---|---|---|---|---|---|---|---|
| A | 9116 | 8319 | 8 | 8 | 0.09% | 0.10% | 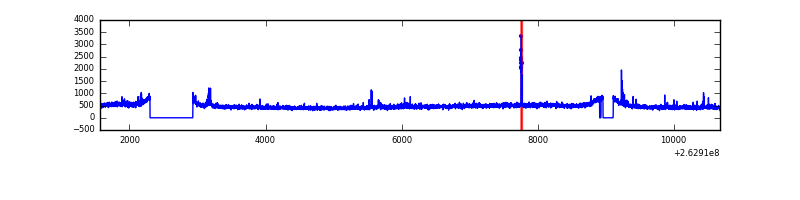 |
| B | 9116 | 8319 | 2 | 2 | 0.02% | 0.02% | 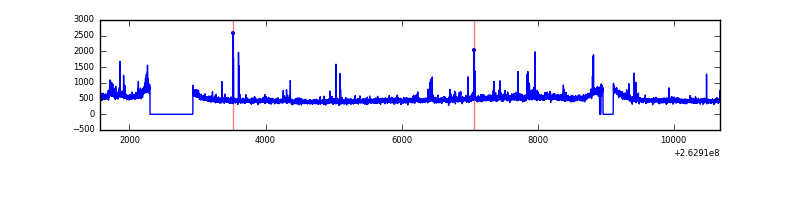 |
| C | 9116 | 8319 | 0 | 0 | 0.00% | 0.00% | 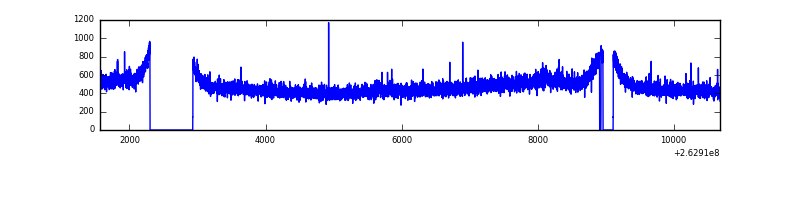 |
| D | 9116 | 8319 | 45 | 45 | 0.49% | 0.54% | 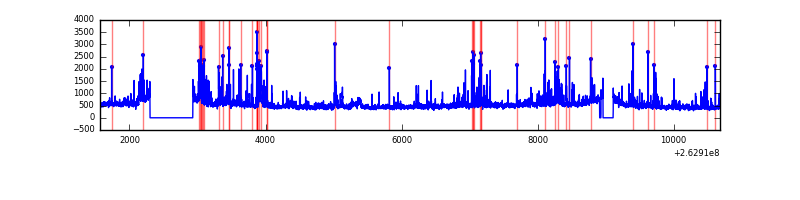 |
Top three noisy pixels from each quadrant. If the there are fewer than three noisy pixels in the level2.evt file, extra rows are filled as -1
| Pixel properties | Quadrant properties | ||||||
|---|---|---|---|---|---|---|---|
| Quadrant | DetID | PixID | Counts | Sigma | Mean | Median | Sigma |
| A | 14 | 111 | 32292 | 153.87 | 997 | 976 | 203.5 |
| A | 4 | 2 | 29679 | 141.03 | 997 | 976 | 203.5 |
| A | 12 | 189 | 29379 | 139.56 | 997 | 976 | 203.5 |
| B | 0 | 189 | 60511 | 313.89 | 994 | 967 | 189.7 |
| B | 3 | 209 | 28527 | 145.28 | 994 | 967 | 189.7 |
| B | 0 | 214 | 24606 | 124.61 | 994 | 967 | 189.7 |
| C | 3 | 233 | 108216 | 468.04 | 981 | 983 | 229.1 |
| C | 13 | 61 | 7073 | 26.58 | 981 | 983 | 229.1 |
| C | 8 | 128 | 4808 | 16.7 | 981 | 983 | 229.1 |
| D | 1 | 52 | 368021 | 1569.15 | 966 | 942 | 233.9 |
| D | 13 | 189 | 249946 | 1064.42 | 966 | 942 | 233.9 |
| D | 8 | 195 | 220407 | 938.15 | 966 | 942 | 233.9 |
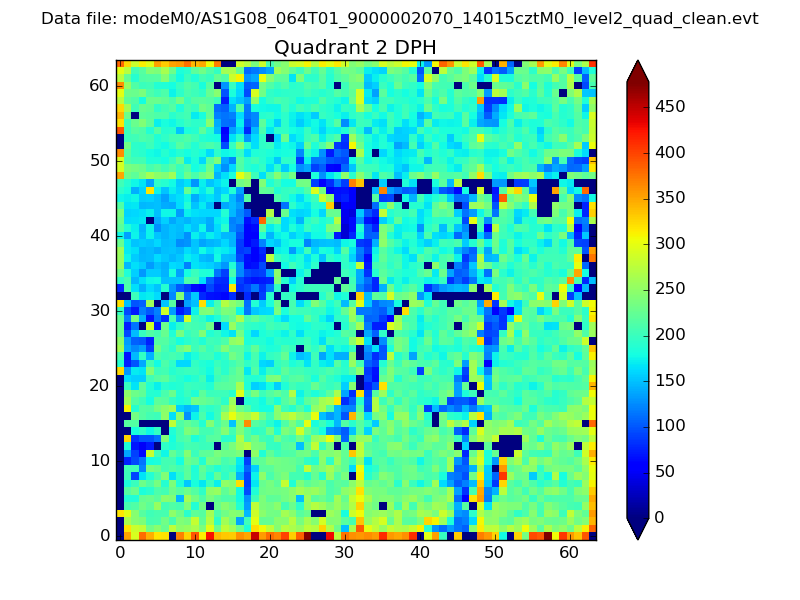
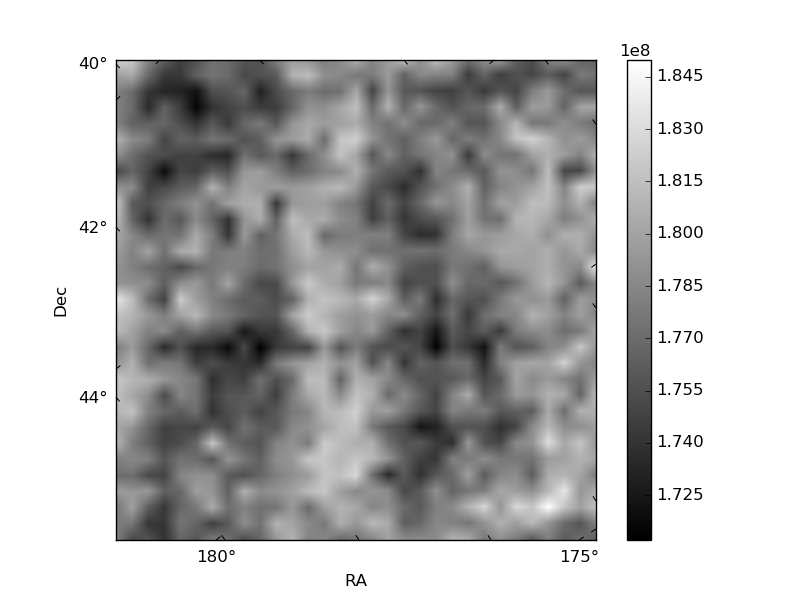
Histogram calculated using DETX and DETY for each event in the final _common_clean file
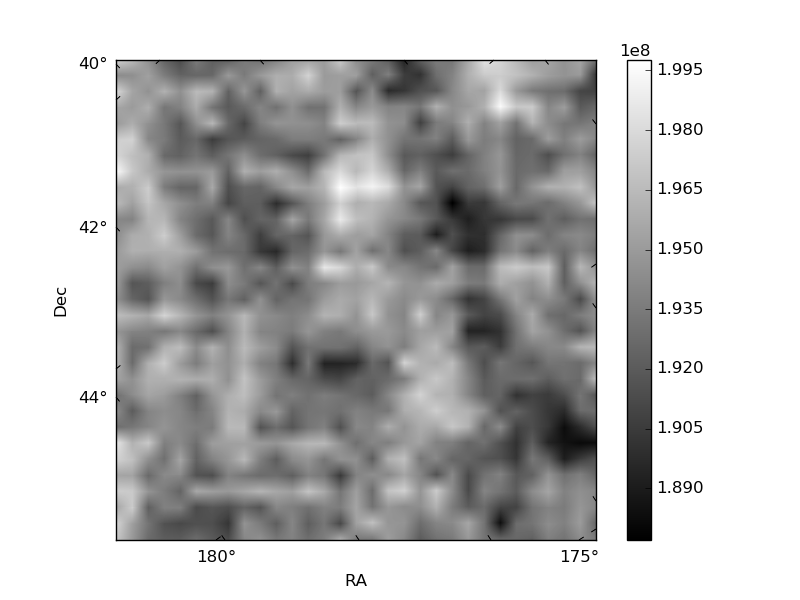
| Quadrant A | 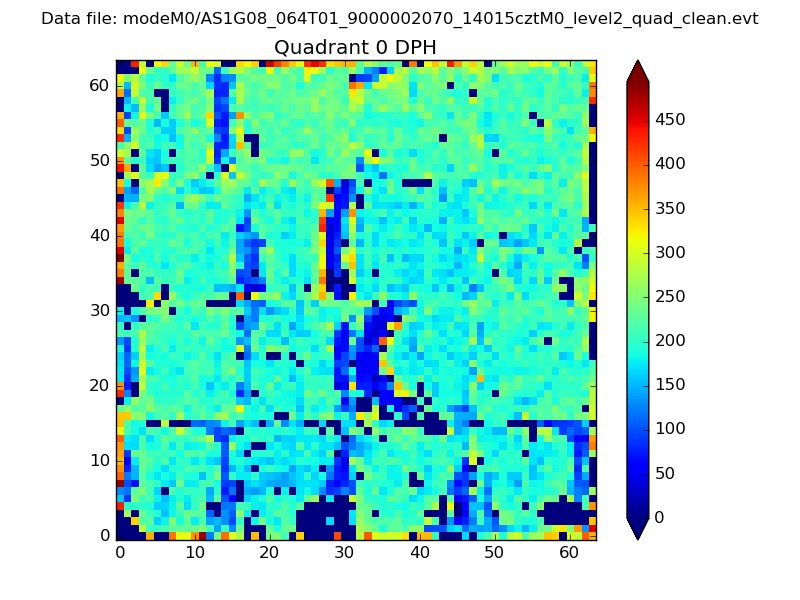 |
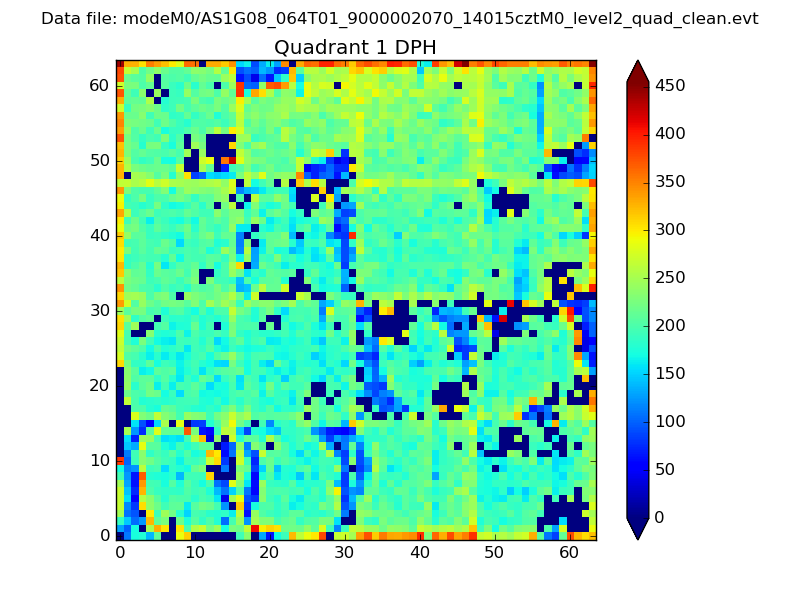 |
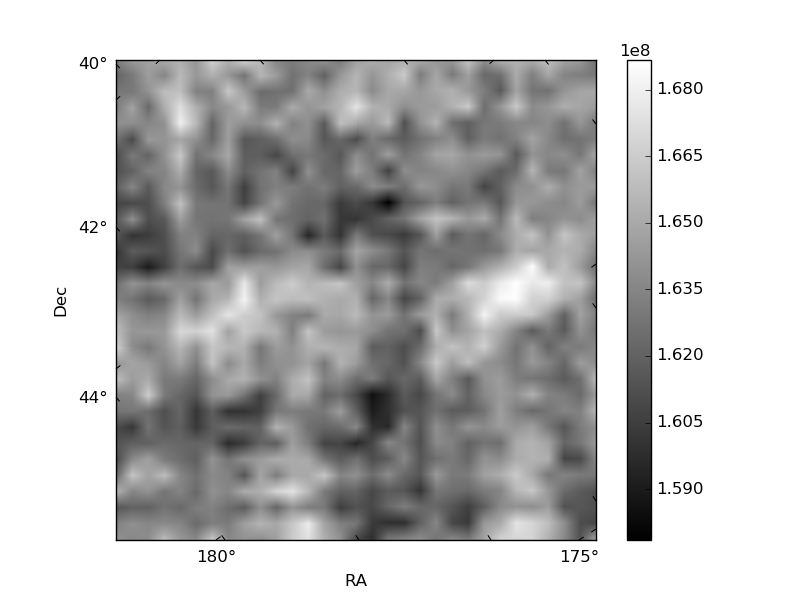
Quadrant B |
|---|---|---|---|
| Quadrant D | 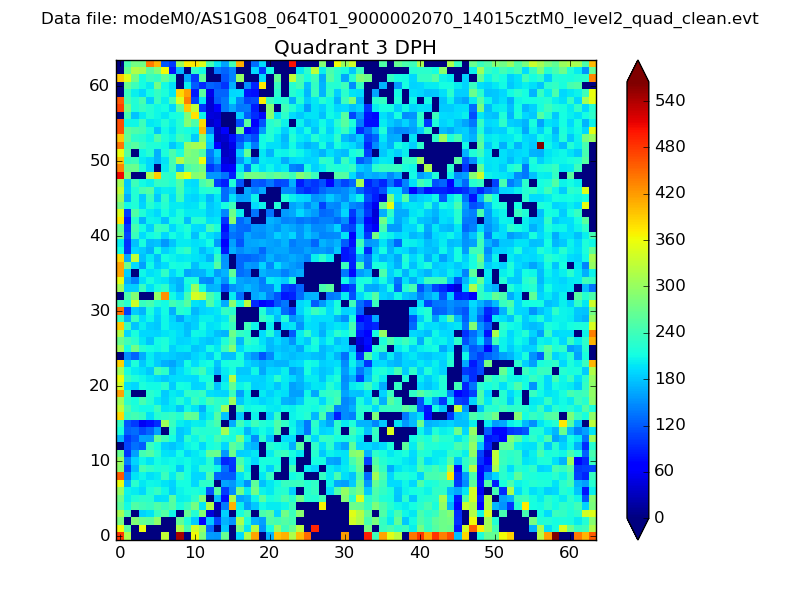 |
 |
Quadrant C |
| Plot type | Count rate plots | Images |
|---|---|---|
| Comparison with Poisson distribution Blue bars denote a histogram of data divided into 1 sec bins. Red curve is a Poisson curve with rate = median count rate of data. |
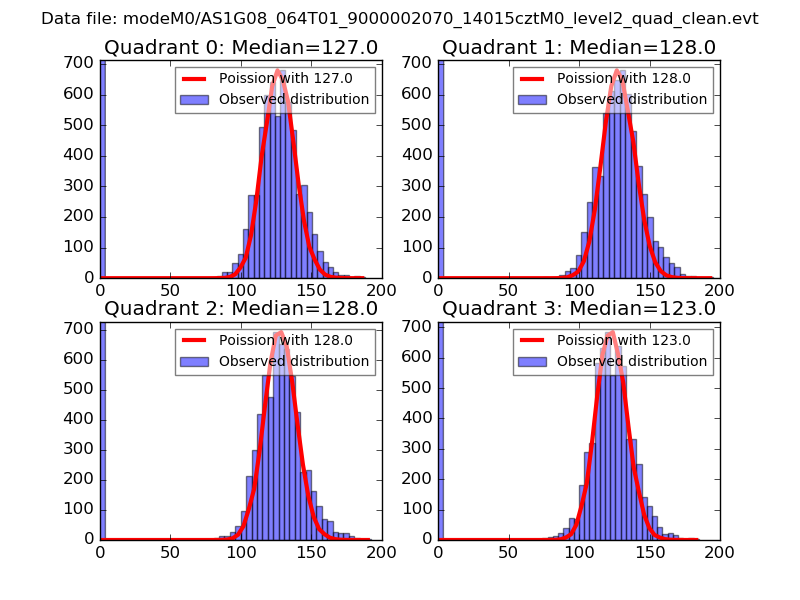 |
 |
| Quadrant-wise count rates Data is divided into 100 sec bins |
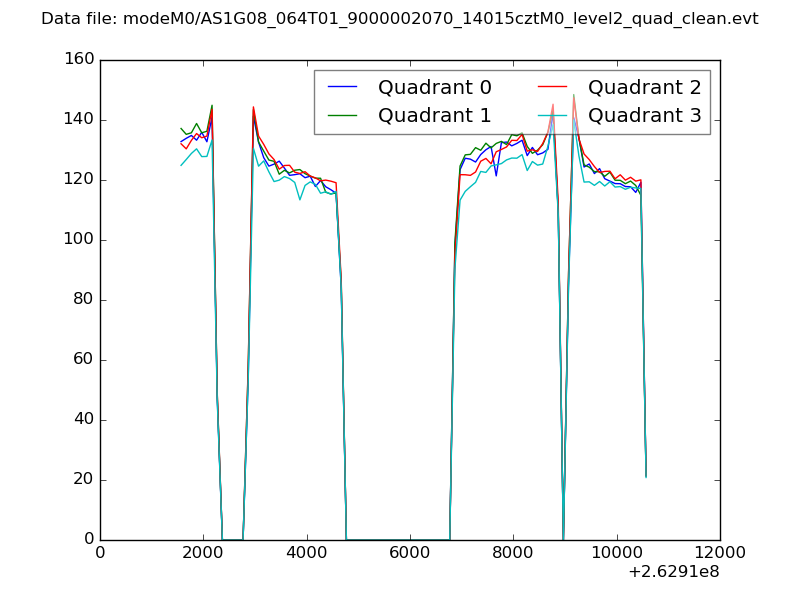 |
|
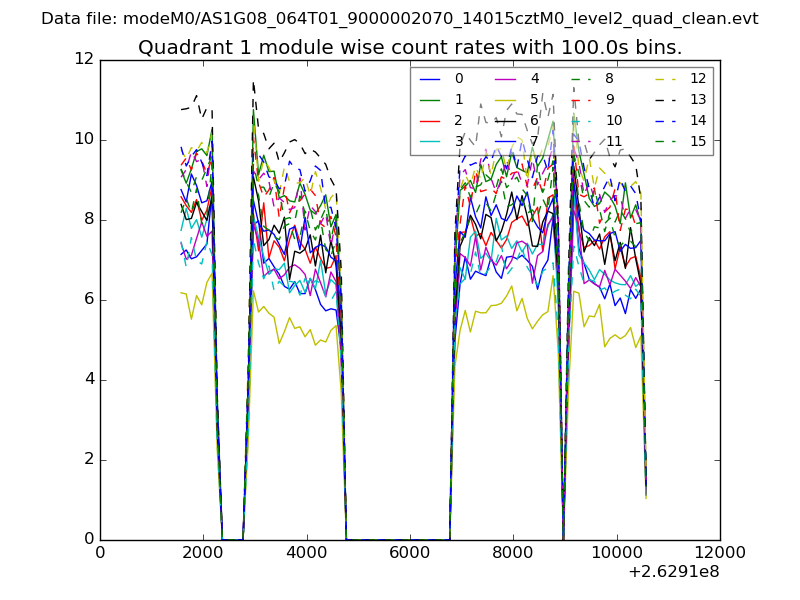
| Module-wise count rates for Quadrant A Data is divided into 100 sec bins |
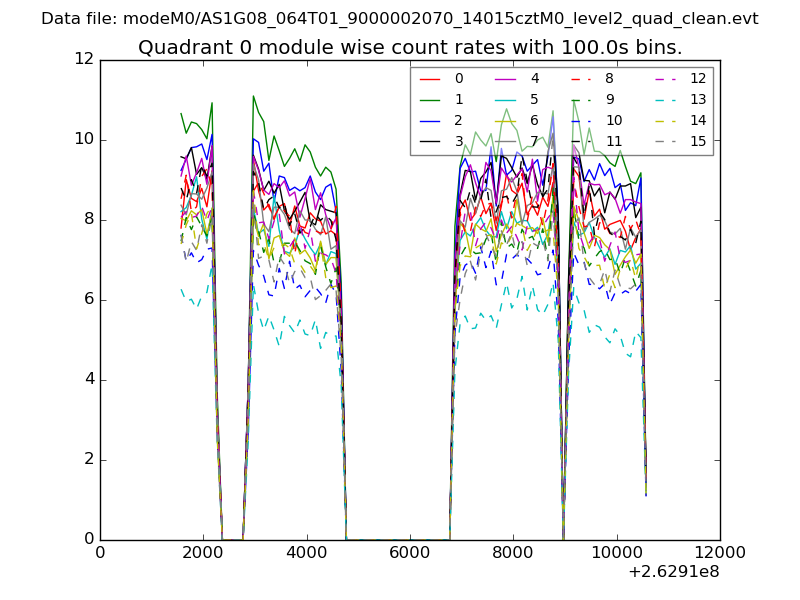 |
 |
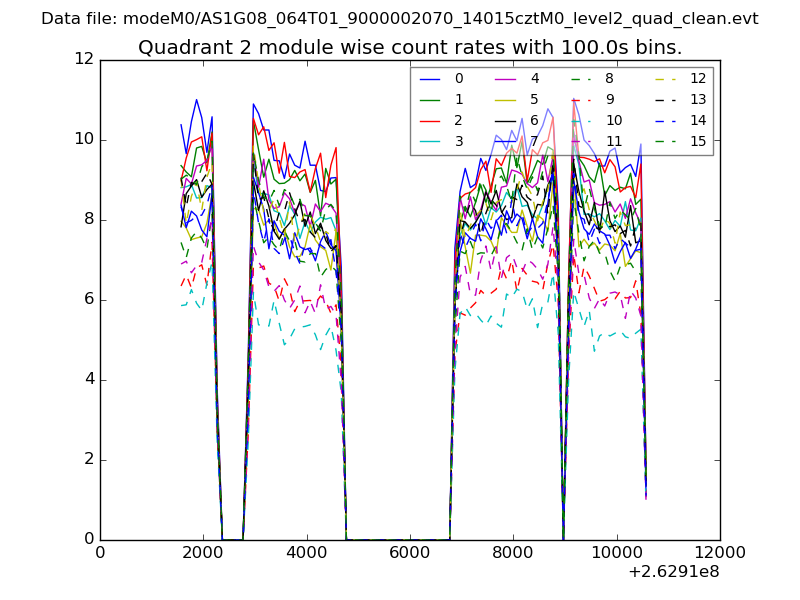
| Module-wise count rates for Quadrant B Data is divided into 100 sec bins |
 |
 |
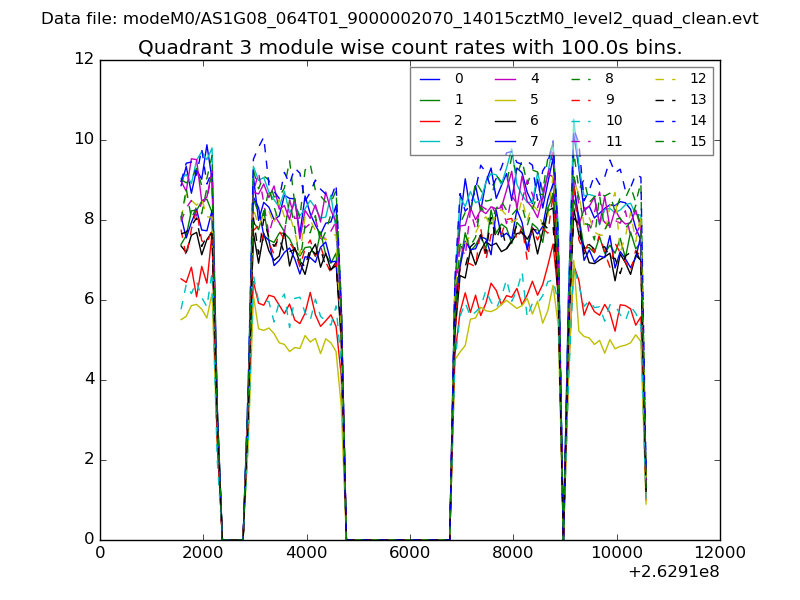
| Module-wise count rates for Quadrant C Data is divided into 100 sec bins |
 |
 |
| Module-wise count rates for Quadrant D Data is divided into 100 sec bins |
 |
 |
| Parameter | Plot |
|---|---|
| CZT HV Monitor | 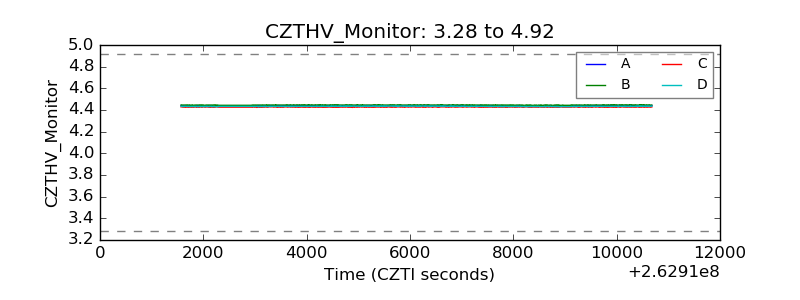 |
| D_VDD | 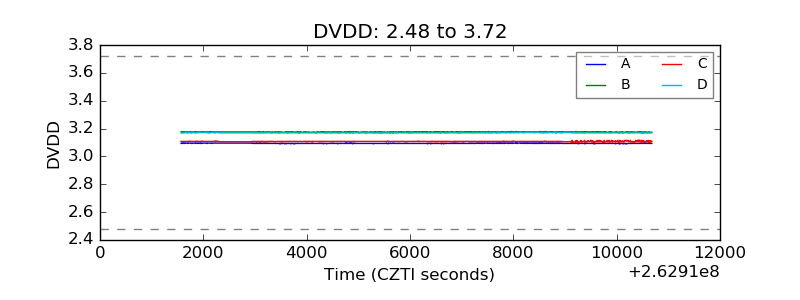 |
| Temperature 1 | 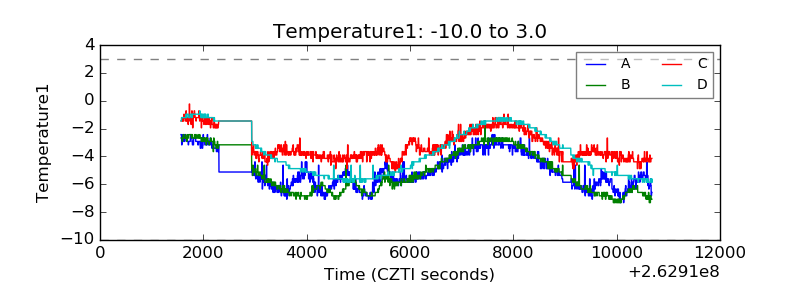 |
| Veto HV Monitor | 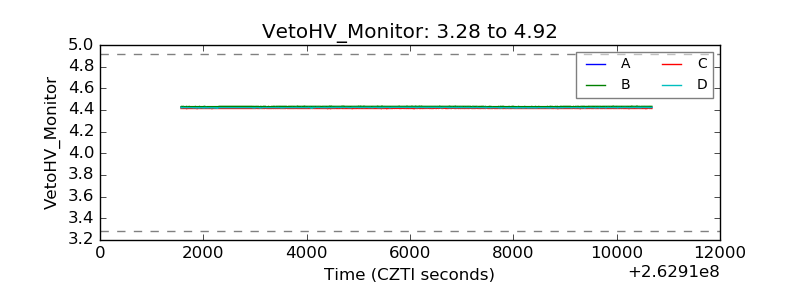 |
| Veto LLD | 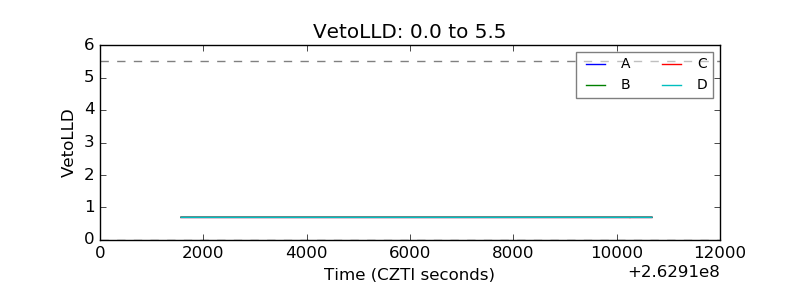 |
| Alpha Counter | 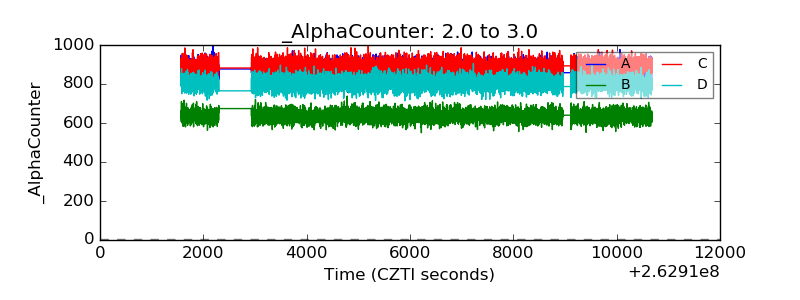 |
| _CPM_Rate | 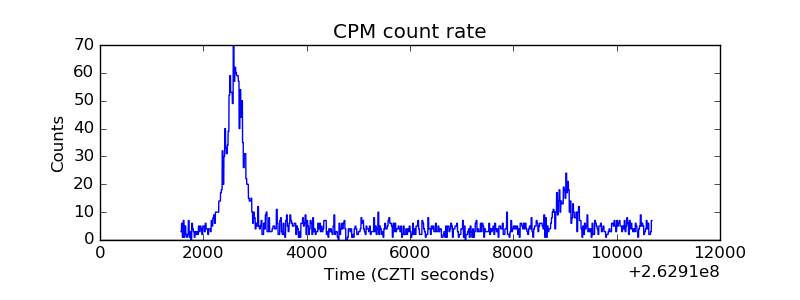 |
| CZT Counter | 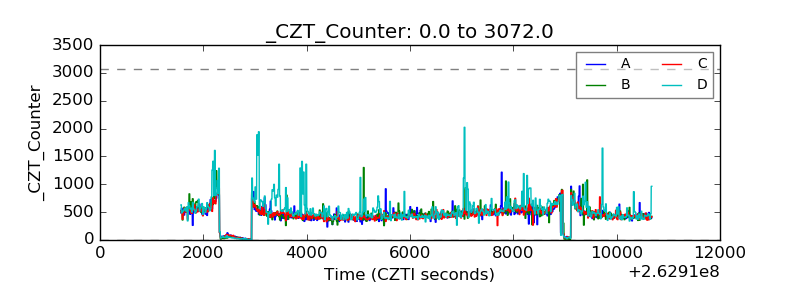 |
| +2.5 Volts monitor | 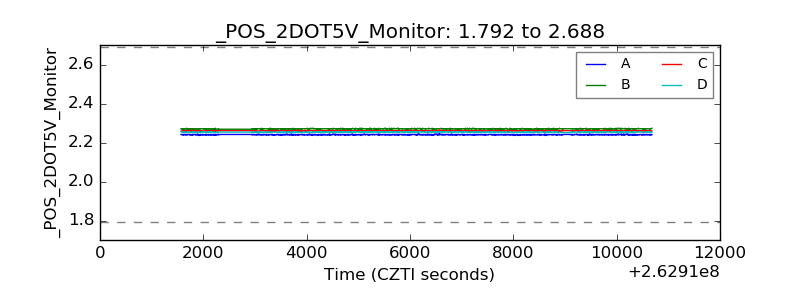 |
| +5 Volts monitor |  |
| _ROLL_ROT | 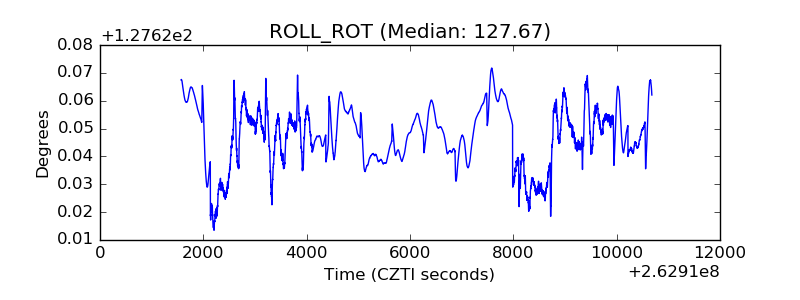 |
| _Roll_DEC | 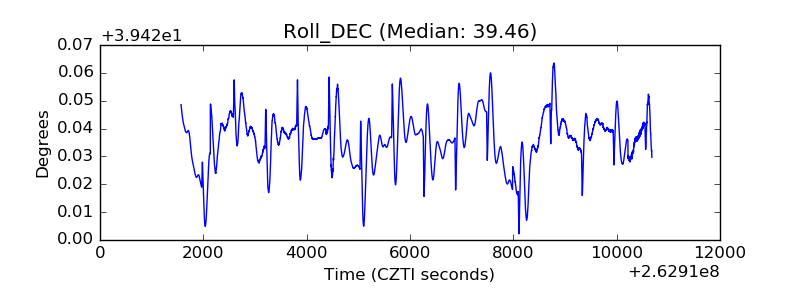 |
| _Roll_RA | 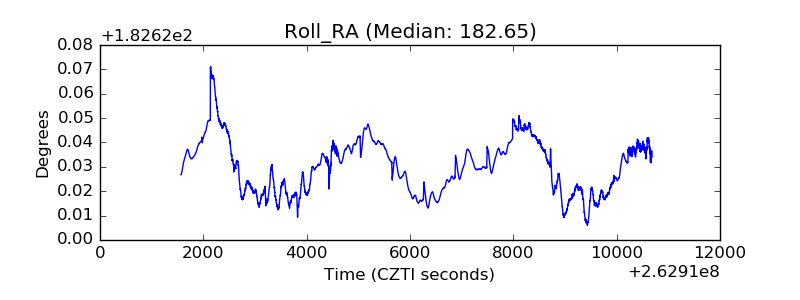 |
| Veto Counter | 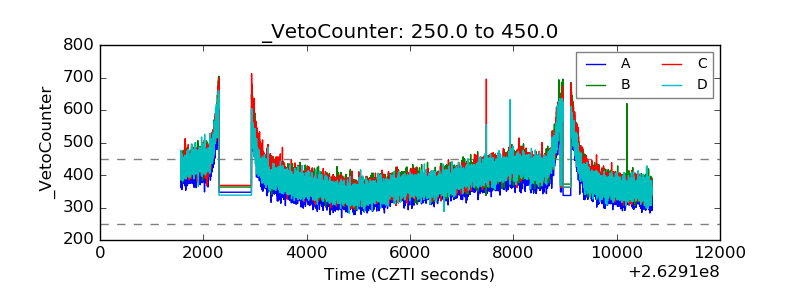 |