| Param | Original file | Final file |
|---|---|---|
| Filename | modeM0/AS1G08_064T01_9000002070_14016cztM0_level2.evt | modeM0/AS1G08_064T01_9000002070_14016cztM0_level2_quad_clean.evt |
| Size (bytes) | 617,313,600 | 127,296,000 |
| Size | 588.7 MB | 121.4 MB |
| Events in quadrant A | 4,364,198 | 806,976 |
| Events in quadrant B | 4,489,443 | 816,369 |
| Events in quadrant C | 4,417,318 | 813,670 |
| Events in quadrant D | 4,806,122 | 786,037 |
| Mode M0 | |||
|---|---|---|---|
| Quadrant | BADHDUFLAG | Total packets | Discarded packets |
| A | 0 | 19029 | 3 |
| B | 0 | 19365 | 2 |
| C | 0 | 19052 | 2 |
| D | 0 | 20579 | 2 |
| Mode SS | |||
|---|---|---|---|
| Quadrant | BADHDUFLAG | Total packets | Discarded packets |
| A | 0 | 186 | 0 |
| B | 0 | 186 | 0 |
| C | 0 | 186 | 0 |
| D | 0 | 186 | 0 |
| Mode M9 | |||
|---|---|---|---|
| Quadrant | BADHDUFLAG | Total packets | Discarded packets |
| A | 0 | 3 | 0 |
| B | 0 | 3 | 0 |
| C | 0 | 3 | 0 |
| D | 0 | 3 | 0 |
| Quadrant | Total seconds | Saturated seconds | Saturation percentage |
|---|---|---|---|
| A | 9111 | 148 | 1.624410% |
| B | 9111 | 194 | 2.129294% |
| C | 9111 | 91 | 0.998793% |
| D | 9111 | 106 | 1.163429% |
Noise dominated data is calculated using 1-second bins in cleaned event files. If a bin has >2000 counts, and if more than 50% of those come from <1% of pixels, then it is considered to be noise-dominated and hence unusable.
| Quadrant | # 1 sec bins | Bins with >0 counts | Bins with >2000 counts | High rate bins dominated by noise | Noise dominated (total time) | Noise dominated (detector-on time) | Marked lightcurve |
|---|---|---|---|---|---|---|---|
| A | 9437 | 9116 | 8 | 8 | 0.08% | 0.09% | 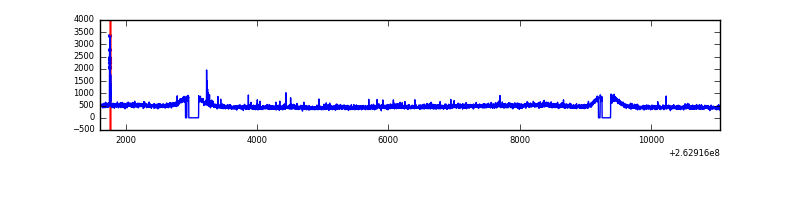 |
| B | 9437 | 9116 | 0 | 0 | 0.00% | 0.00% | 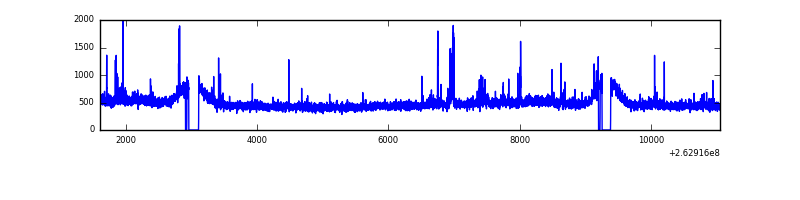 |
| C | 9437 | 9116 | 2 | 2 | 0.02% | 0.02% | 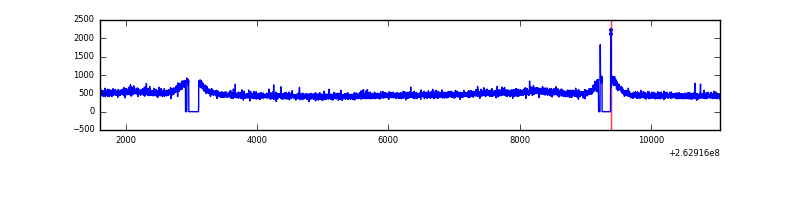 |
| D | 9437 | 9116 | 25 | 25 | 0.26% | 0.27% | 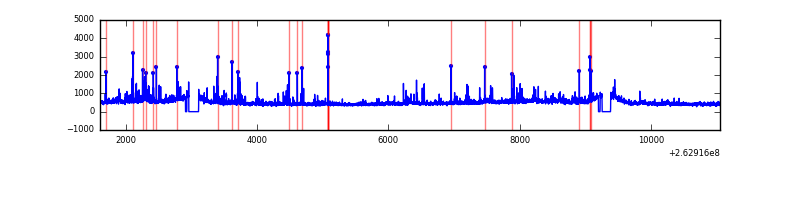 |
Top three noisy pixels from each quadrant. If the there are fewer than three noisy pixels in the level2.evt file, extra rows are filled as -1
| Pixel properties | Quadrant properties | ||||||
|---|---|---|---|---|---|---|---|
| Quadrant | DetID | PixID | Counts | Sigma | Mean | Median | Sigma |
| A | 14 | 111 | 37776 | 163.44 | 1098 | 1071 | 224.6 |
| A | 4 | 2 | 30245 | 129.91 | 1098 | 1071 | 224.6 |
| A | 8 | 15 | 29065 | 124.65 | 1098 | 1071 | 224.6 |
| B | 4 | 173 | 44172 | 204.64 | 1096 | 1068 | 210.6 |
| B | 0 | 214 | 42846 | 198.34 | 1096 | 1068 | 210.6 |
| B | 0 | 189 | 37456 | 172.75 | 1096 | 1068 | 210.6 |
| C | 3 | 233 | 155986 | 615.22 | 1083 | 1086 | 251.8 |
| C | 6 | 253 | 15351 | 56.66 | 1083 | 1086 | 251.8 |
| C | 8 | 128 | 13745 | 50.28 | 1083 | 1086 | 251.8 |
| D | 1 | 52 | 208570 | 791.55 | 1073 | 1043 | 262.2 |
| D | 8 | 195 | 205200 | 778.7 | 1073 | 1043 | 262.2 |
| D | 13 | 189 | 162365 | 615.32 | 1073 | 1043 | 262.2 |
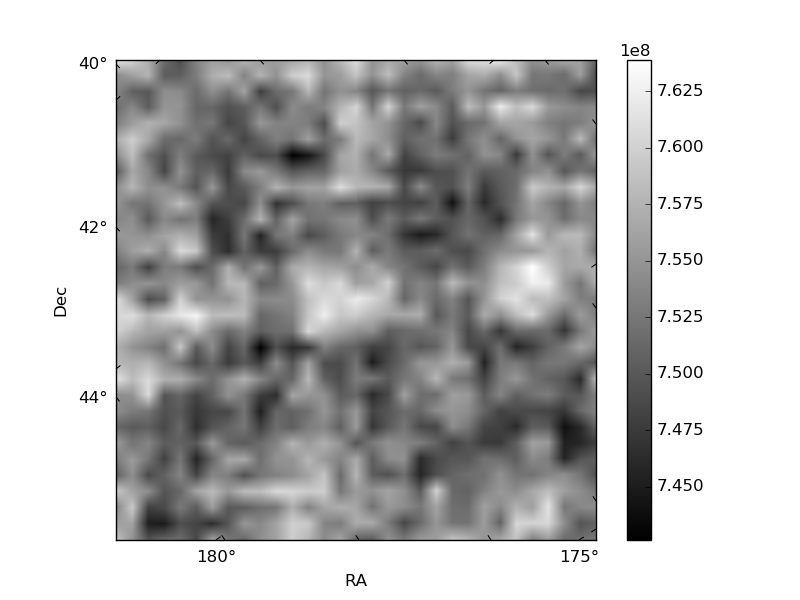
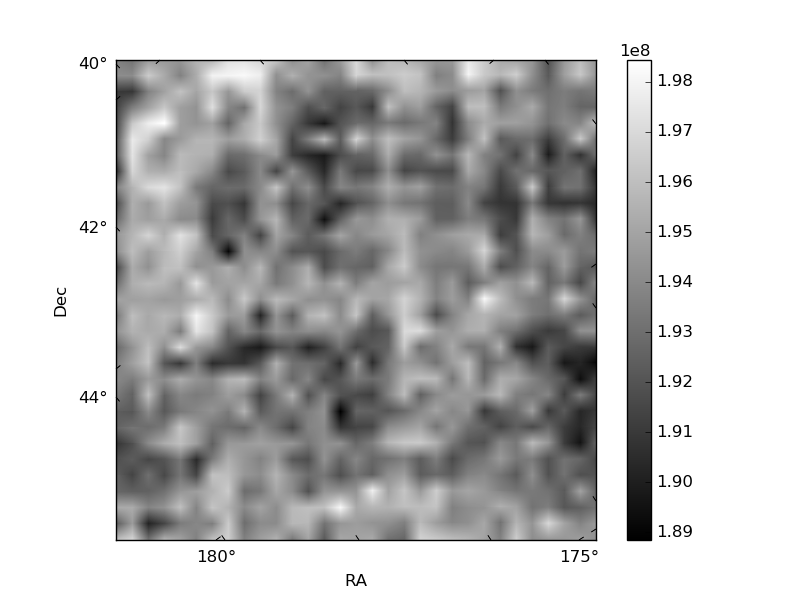
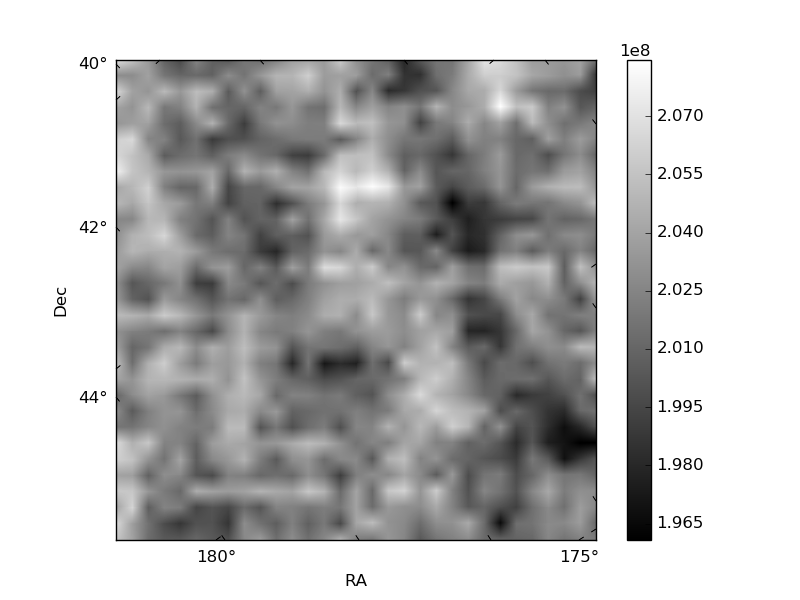
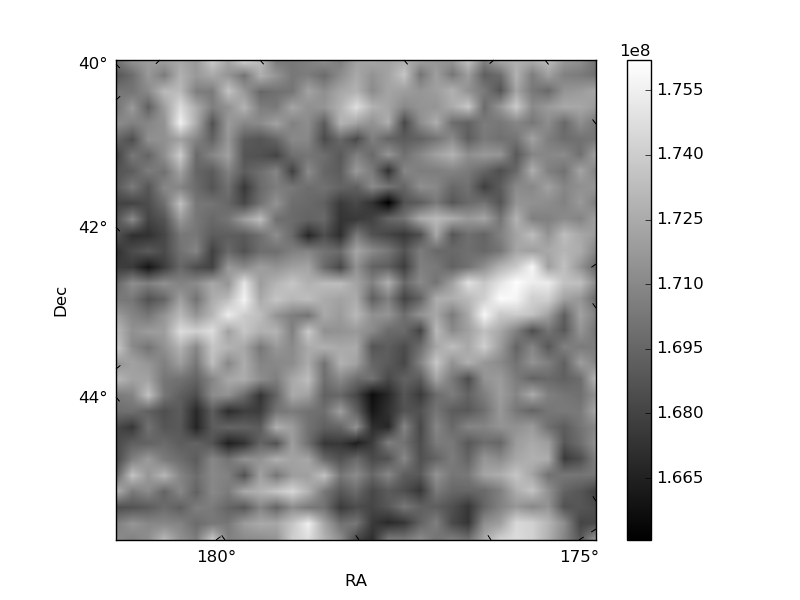
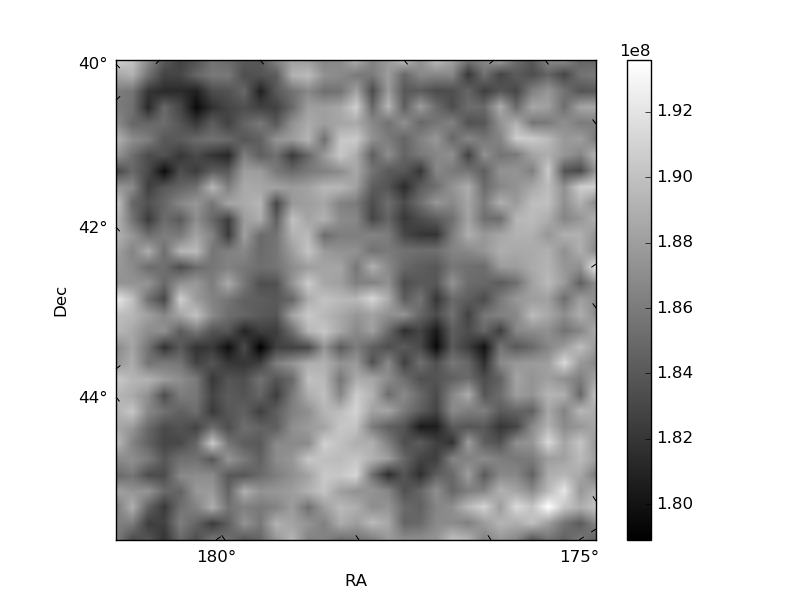
Histogram calculated using DETX and DETY for each event in the final _common_clean file
| Quadrant A | 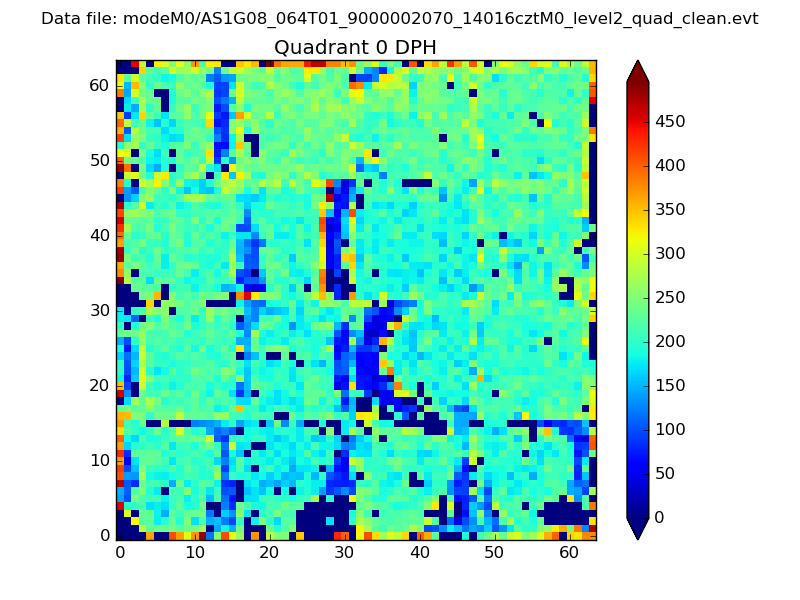 |
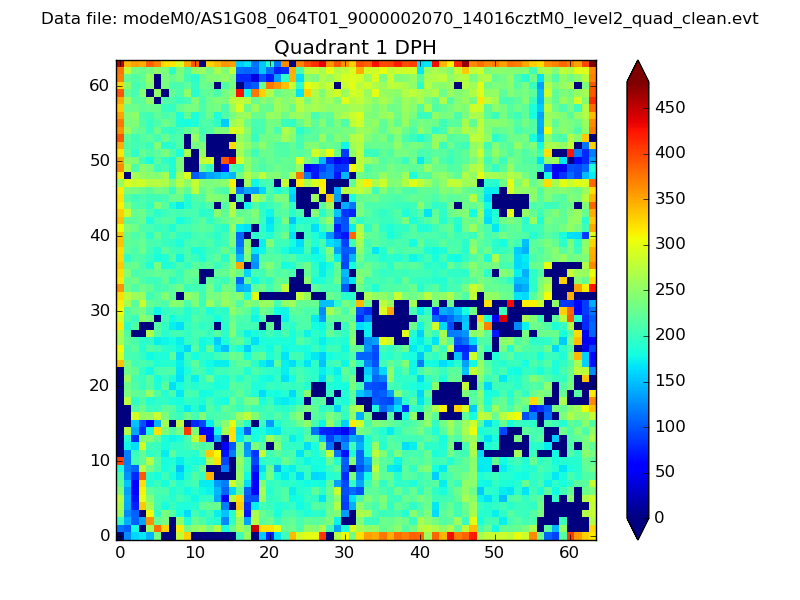 |
Quadrant B |
|---|---|---|---|
| Quadrant D | 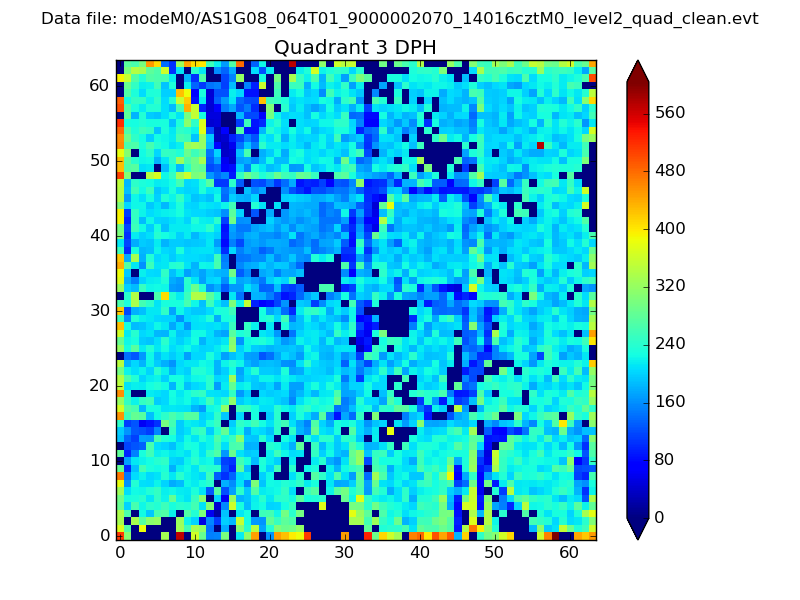 |
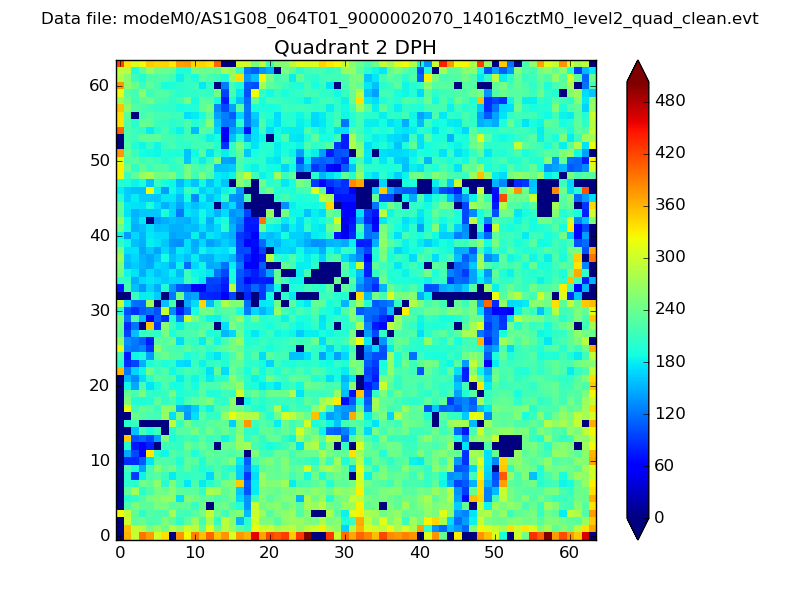 |
Quadrant C |
| Plot type | Count rate plots | Images |
|---|---|---|
| Comparison with Poisson distribution Blue bars denote a histogram of data divided into 1 sec bins. Red curve is a Poisson curve with rate = median count rate of data. |
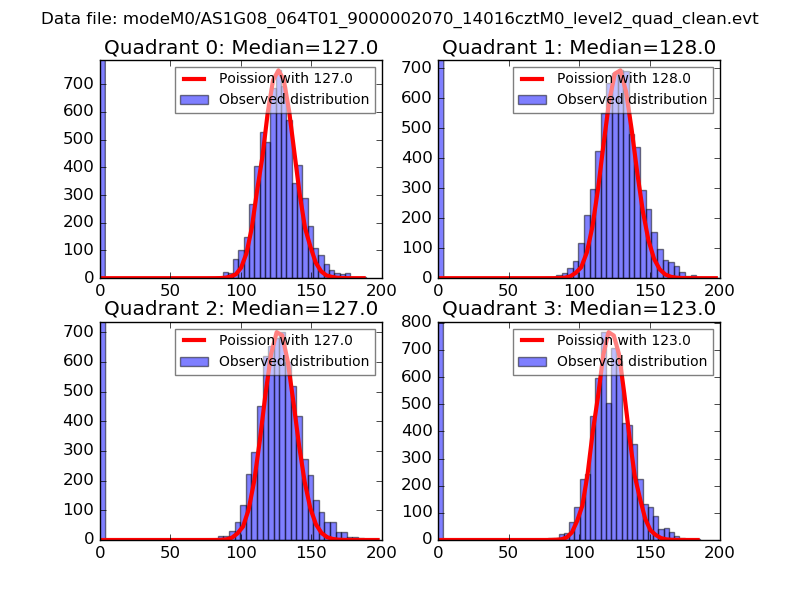 |
 |
| Quadrant-wise count rates Data is divided into 100 sec bins |
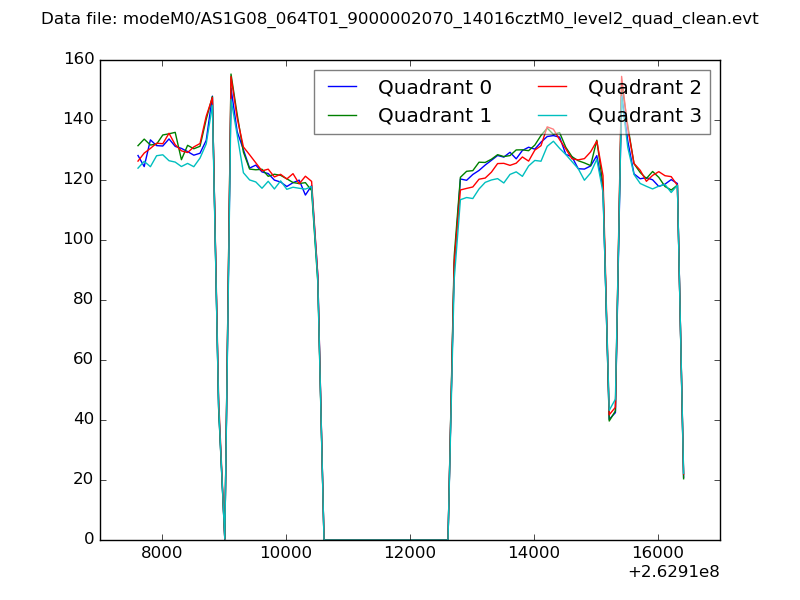 |
|
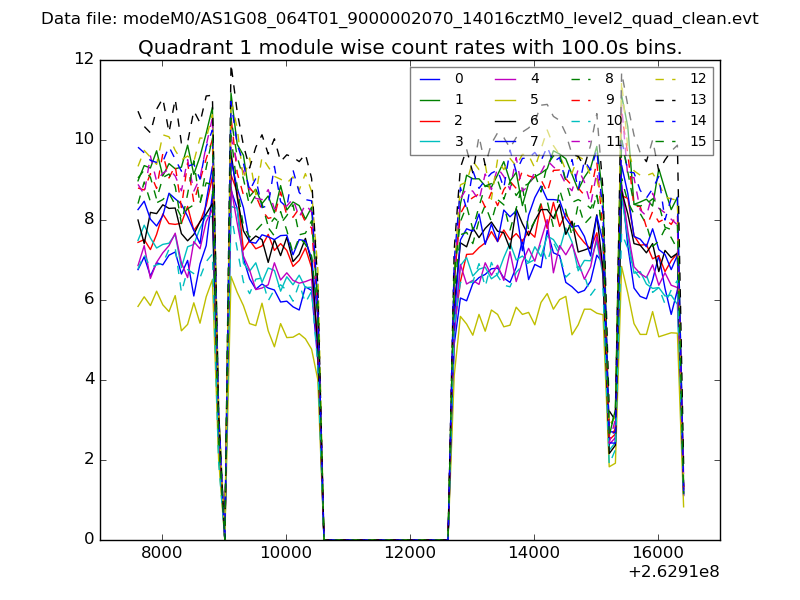
| Module-wise count rates for Quadrant A Data is divided into 100 sec bins |
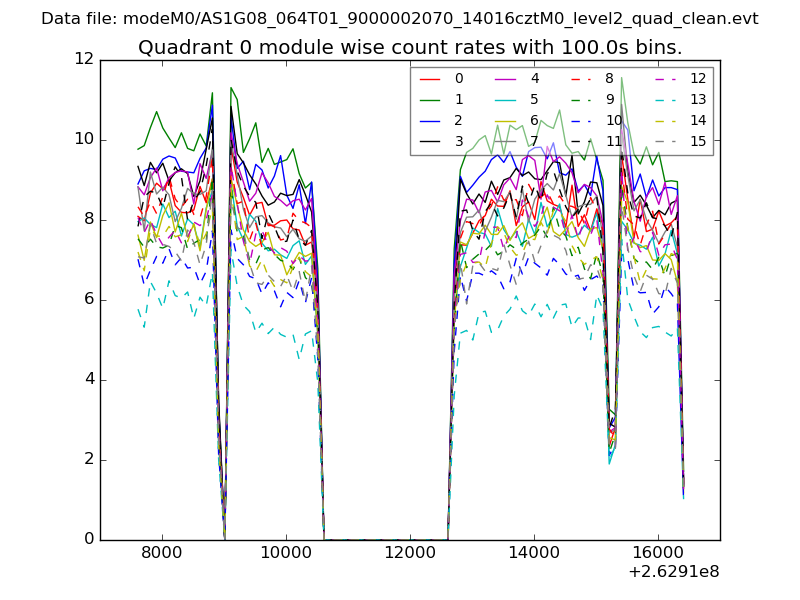 |
 |
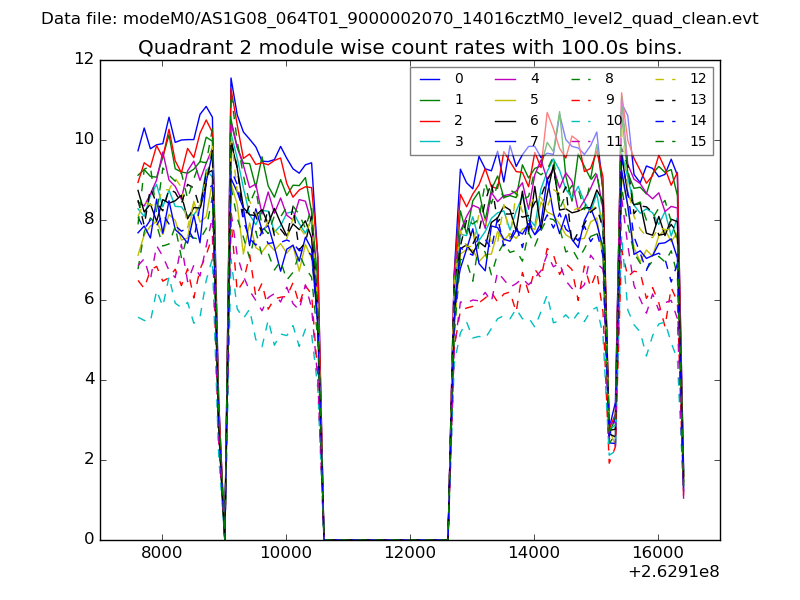
| Module-wise count rates for Quadrant B Data is divided into 100 sec bins |
 |
 |
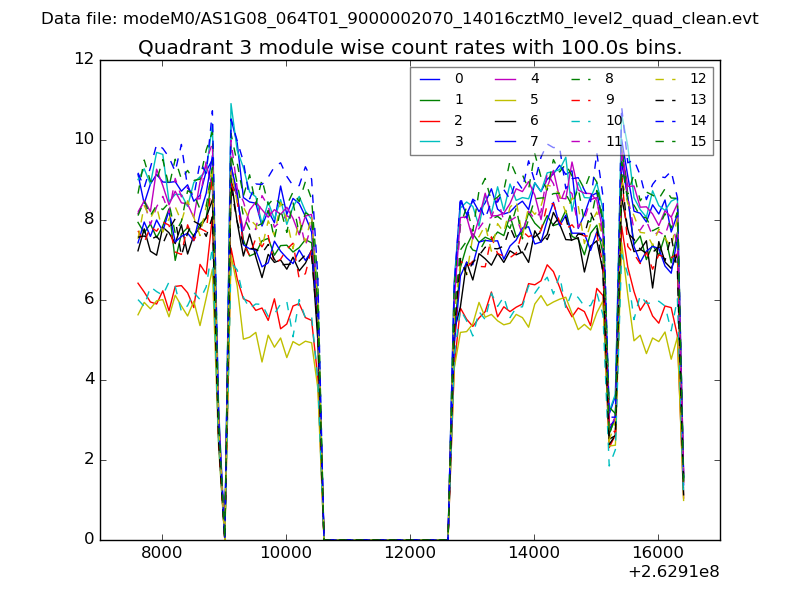
| Module-wise count rates for Quadrant C Data is divided into 100 sec bins |
 |
 |
| Module-wise count rates for Quadrant D Data is divided into 100 sec bins |
 |
 |
| Parameter | Plot |
|---|---|
| CZT HV Monitor | 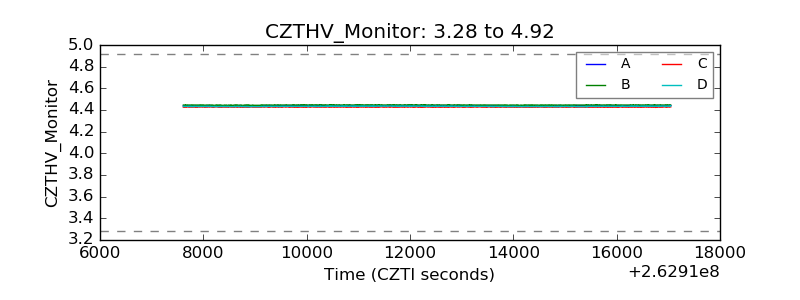 |
| D_VDD | 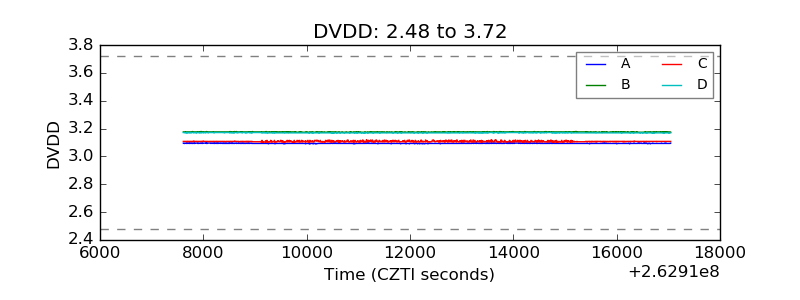 |
| Temperature 1 | 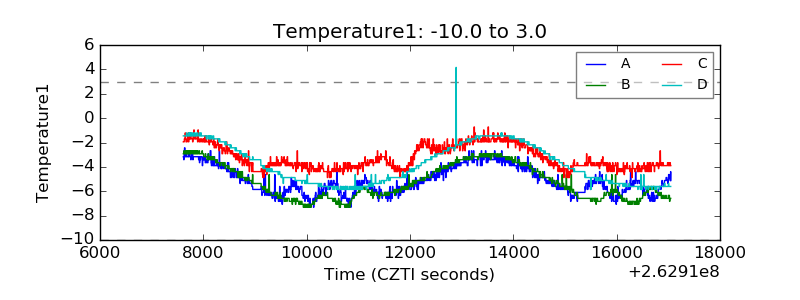 |
| Veto HV Monitor | 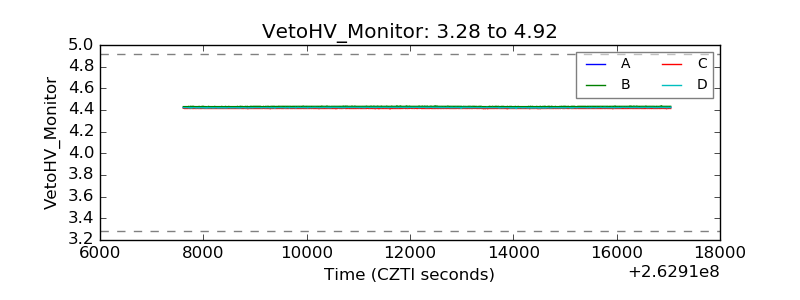 |
| Veto LLD | 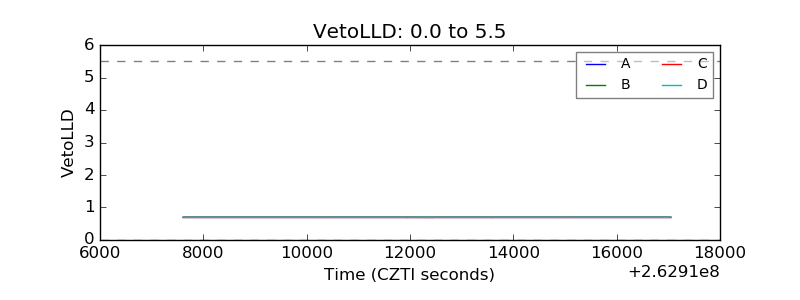 |
| Alpha Counter | 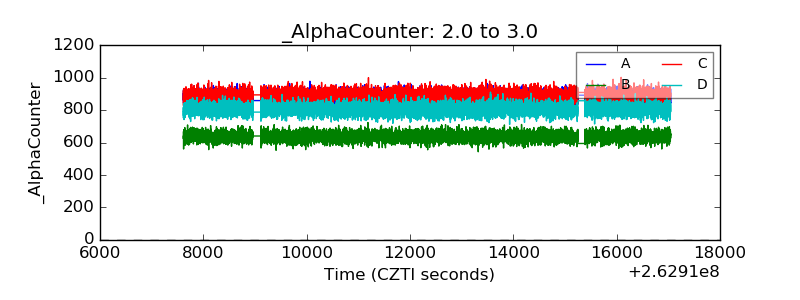 |
| _CPM_Rate | 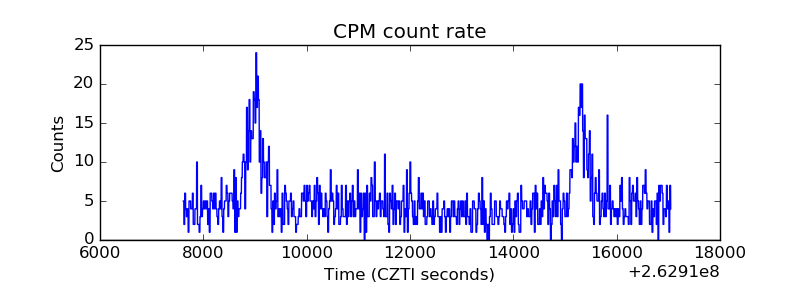 |
| CZT Counter | 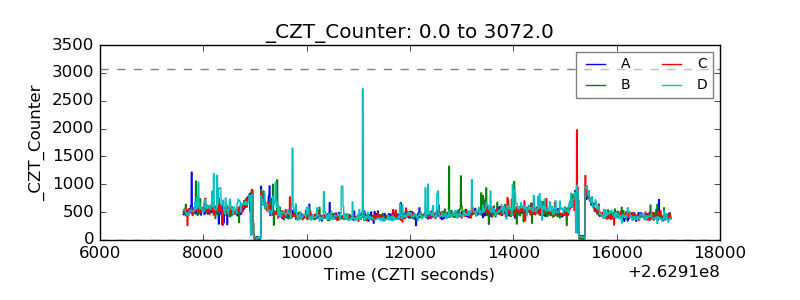 |
| +2.5 Volts monitor | 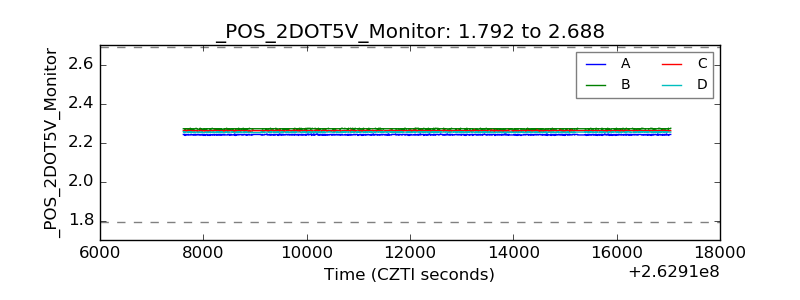 |
| +5 Volts monitor |  |
| _ROLL_ROT | 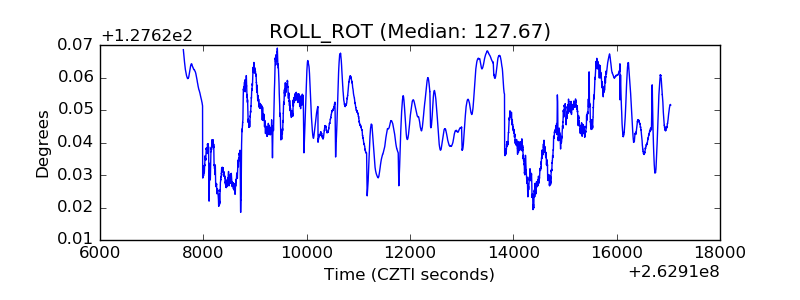 |
| _Roll_DEC | 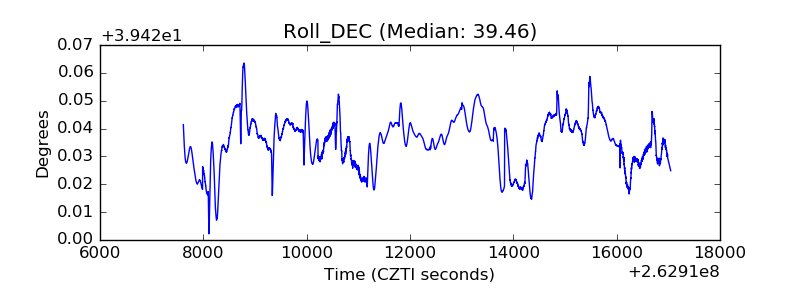 |
| _Roll_RA | 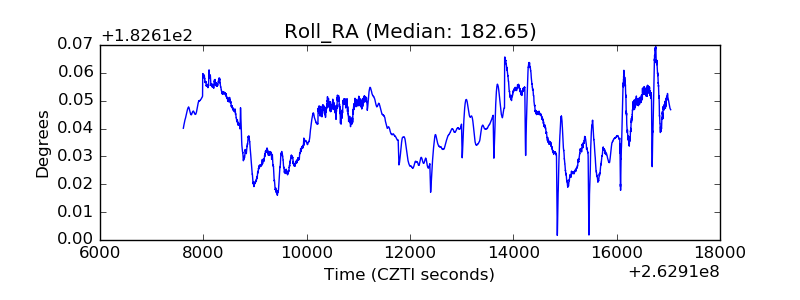 |
| Veto Counter | 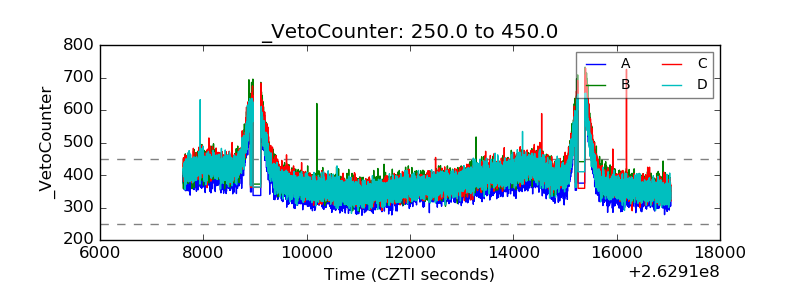 |