| Param | Original file | Final file |
|---|---|---|
| Filename | modeM0/AS1G08_064T01_9000002070_14017cztM0_level2.evt | modeM0/AS1G08_064T01_9000002070_14017cztM0_level2_quad_clean.evt |
| Size (bytes) | 511,920,000 | 90,259,200 |
| Size | 488.2 MB | 86.1 MB |
| Events in quadrant A | 3,725,746 | 552,994 |
| Events in quadrant B | 3,661,418 | 558,714 |
| Events in quadrant C | 3,542,260 | 559,305 |
| Events in quadrant D | 4,062,151 | 537,823 |
| Mode M0 | |||
|---|---|---|---|
| Quadrant | BADHDUFLAG | Total packets | Discarded packets |
| A | 0 | 16128 | 3 |
| B | 0 | 15862 | 2 |
| C | 0 | 15564 | 2 |
| D | 0 | 17266 | 2 |
| Mode SS | |||
|---|---|---|---|
| Quadrant | BADHDUFLAG | Total packets | Discarded packets |
| A | 0 | 156 | 0 |
| B | 0 | 156 | 0 |
| C | 0 | 156 | 0 |
| D | 0 | 156 | 0 |
| Mode M9 | |||
|---|---|---|---|
| Quadrant | BADHDUFLAG | Total packets | Discarded packets |
| A | 0 | 5 | 0 |
| B | 0 | 5 | 0 |
| C | 0 | 5 | 0 |
| D | 0 | 5 | 0 |
| Quadrant | Total seconds | Saturated seconds | Saturation percentage |
|---|---|---|---|
| A | 7530 | 179 | 2.377158% |
| B | 7530 | 220 | 2.921647% |
| C | 7530 | 118 | 1.567065% |
| D | 7530 | 164 | 2.177955% |
Noise dominated data is calculated using 1-second bins in cleaned event files. If a bin has >2000 counts, and if more than 50% of those come from <1% of pixels, then it is considered to be noise-dominated and hence unusable.
| Quadrant | # 1 sec bins | Bins with >0 counts | Bins with >2000 counts | High rate bins dominated by noise | Noise dominated (total time) | Noise dominated (detector-on time) | Marked lightcurve |
|---|---|---|---|---|---|---|---|
| A | 8071 | 7534 | 0 | 0 | 0.00% | 0.00% | 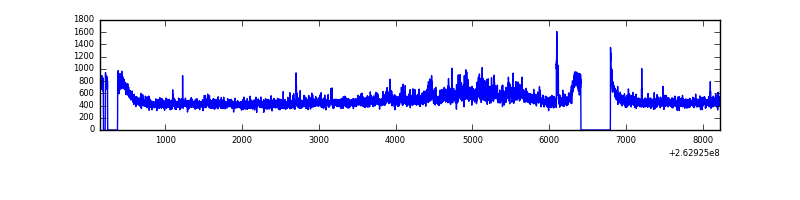 |
| B | 8071 | 7534 | 3 | 3 | 0.04% | 0.04% | 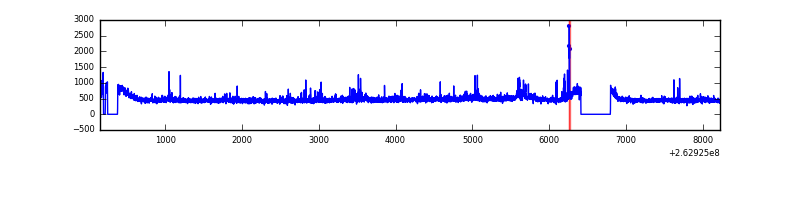 |
| C | 8071 | 7534 | 2 | 2 | 0.02% | 0.03% | 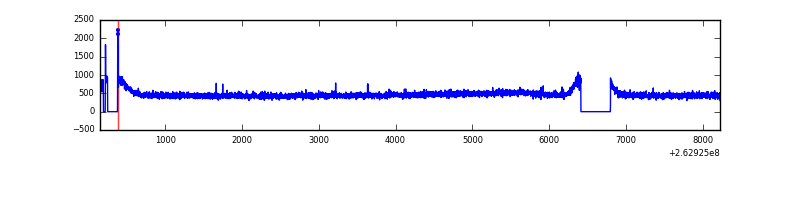 |
| D | 8071 | 7534 | 29 | 29 | 0.36% | 0.38% | 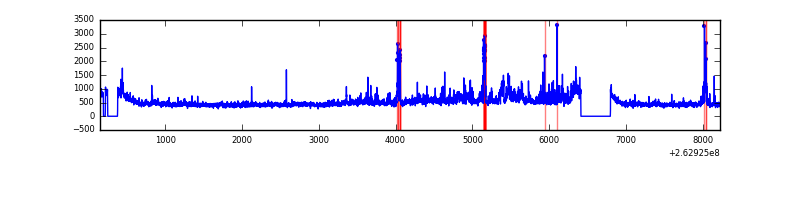 |
Top three noisy pixels from each quadrant. If the there are fewer than three noisy pixels in the level2.evt file, extra rows are filled as -1
| Pixel properties | Quadrant properties | ||||||
|---|---|---|---|---|---|---|---|
| Quadrant | DetID | PixID | Counts | Sigma | Mean | Median | Sigma |
| A | 8 | 15 | 210581 | 1136.82 | 895 | 873 | 184.5 |
| A | 1 | 162 | 30385 | 159.98 | 895 | 873 | 184.5 |
| A | 4 | 2 | 15311 | 78.27 | 895 | 873 | 184.5 |
| B | 10 | 16 | 85752 | 487.71 | 894 | 868 | 174.0 |
| B | 0 | 214 | 32669 | 182.72 | 894 | 868 | 174.0 |
| B | 0 | 189 | 22233 | 122.76 | 894 | 868 | 174.0 |
| C | 3 | 233 | 109605 | 533.53 | 876 | 879 | 203.8 |
| C | 6 | 253 | 15146 | 70.01 | 876 | 879 | 203.8 |
| C | 13 | 61 | 6309 | 26.65 | 876 | 879 | 203.8 |
| D | 8 | 195 | 220031 | 964.64 | 864 | 844 | 227.2 |
| D | 1 | 52 | 150434 | 658.34 | 864 | 844 | 227.2 |
| D | 13 | 189 | 146153 | 639.5 | 864 | 844 | 227.2 |
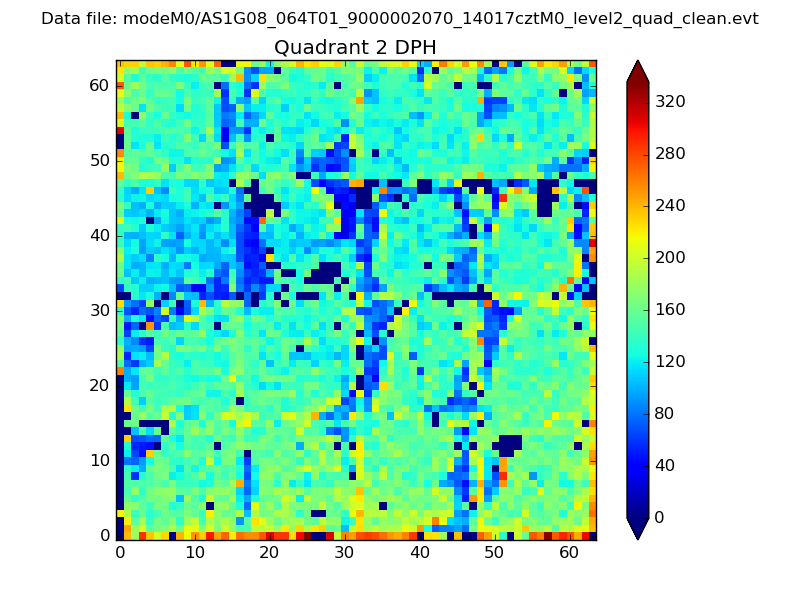
Histogram calculated using DETX and DETY for each event in the final _common_clean file
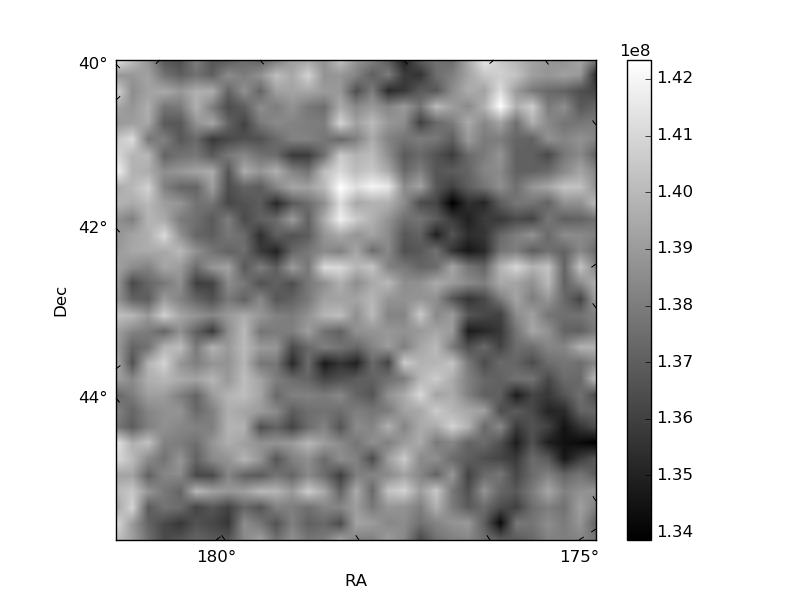
| Quadrant A | 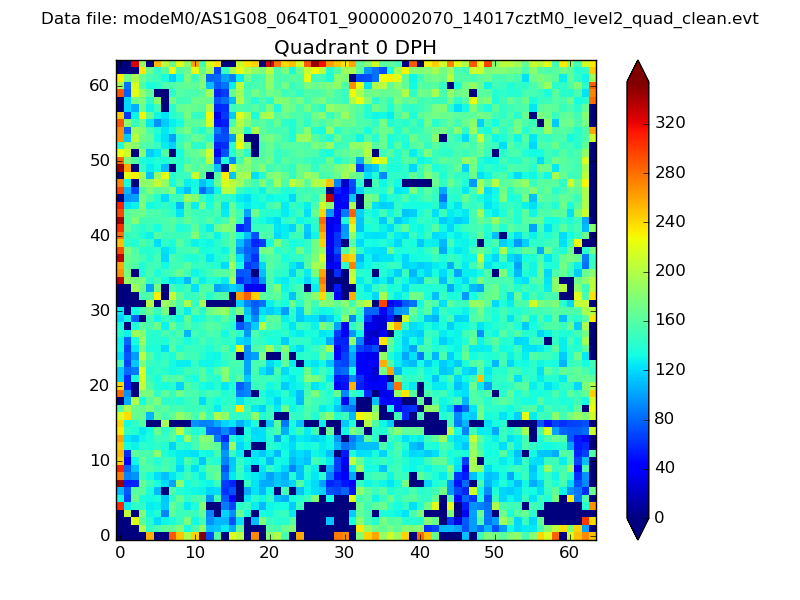 |
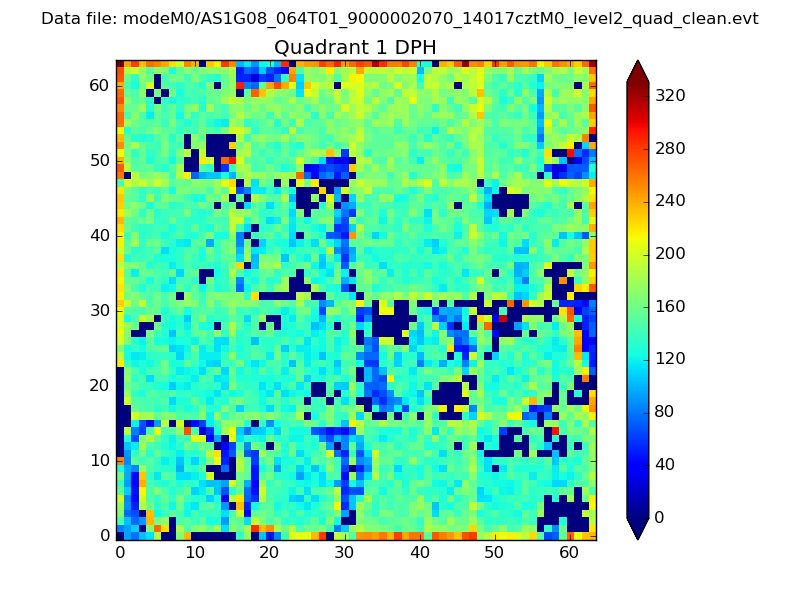 |
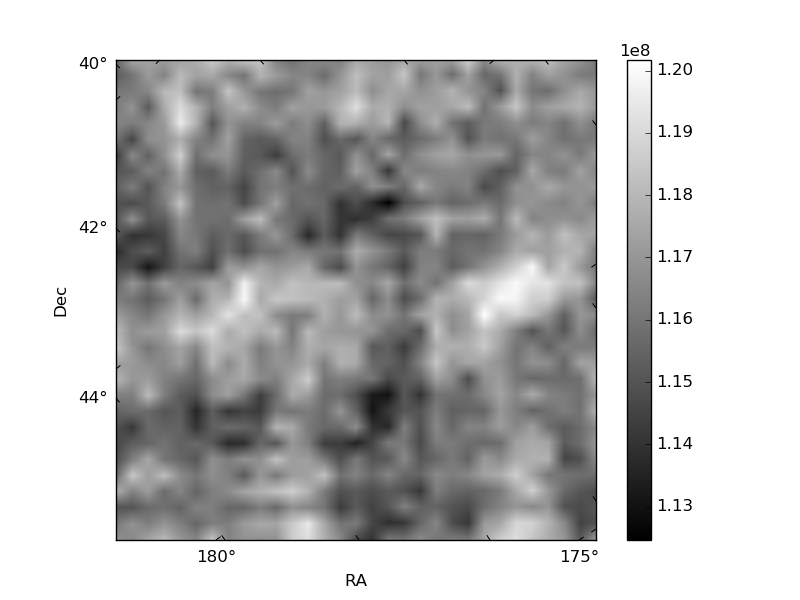
Quadrant B |
|---|---|---|---|
| Quadrant D | 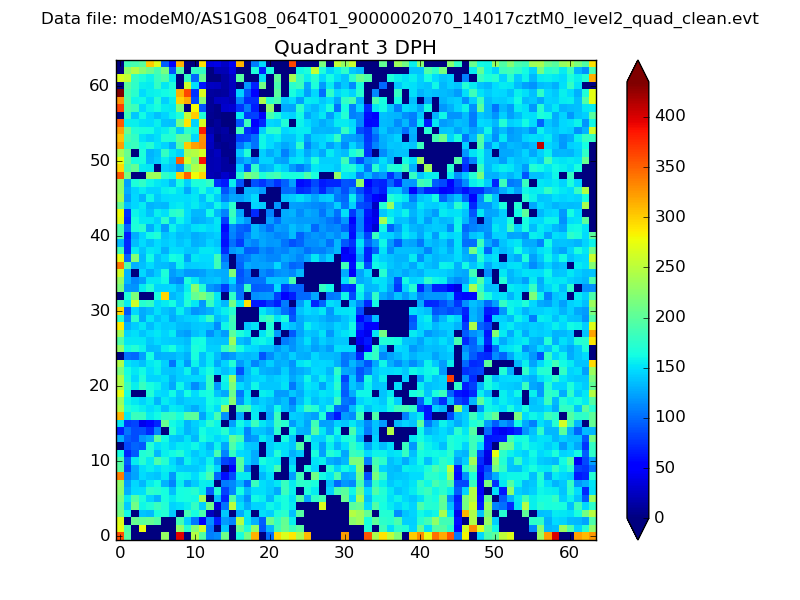 |
 |
Quadrant C |
| Plot type | Count rate plots | Images |
|---|---|---|
| Comparison with Poisson distribution Blue bars denote a histogram of data divided into 1 sec bins. Red curve is a Poisson curve with rate = median count rate of data. |
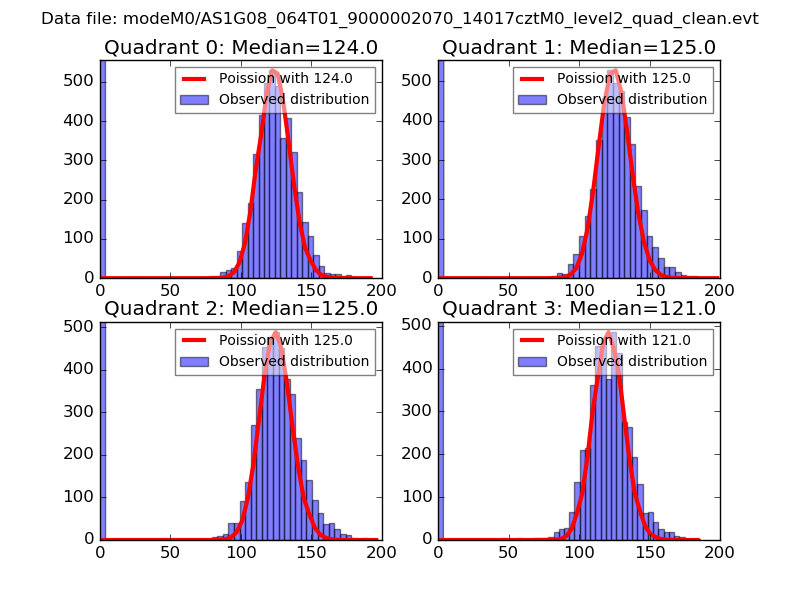 |
 |
| Quadrant-wise count rates Data is divided into 100 sec bins |
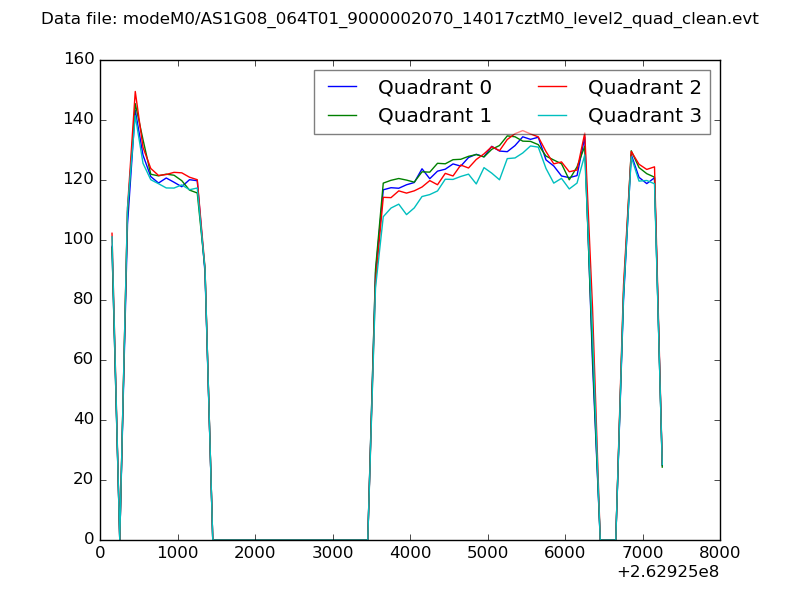 |
|
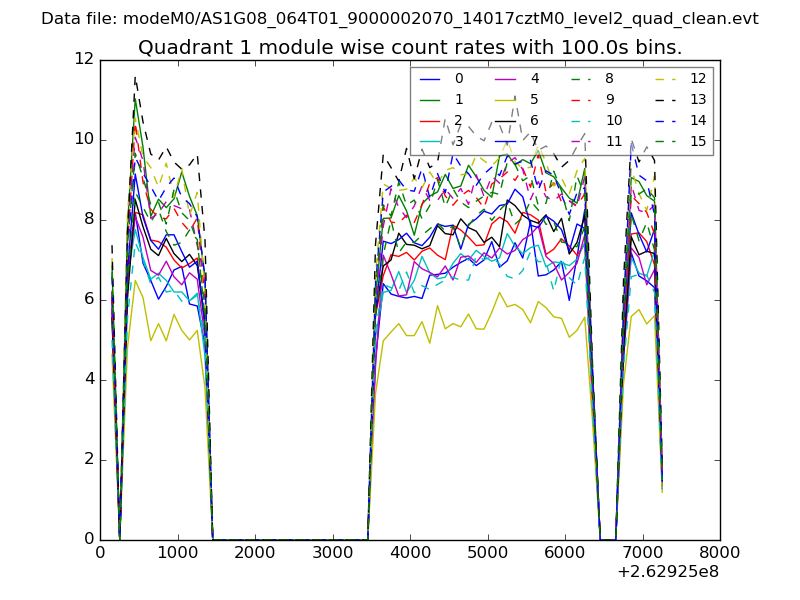
| Module-wise count rates for Quadrant A Data is divided into 100 sec bins |
 |
 |
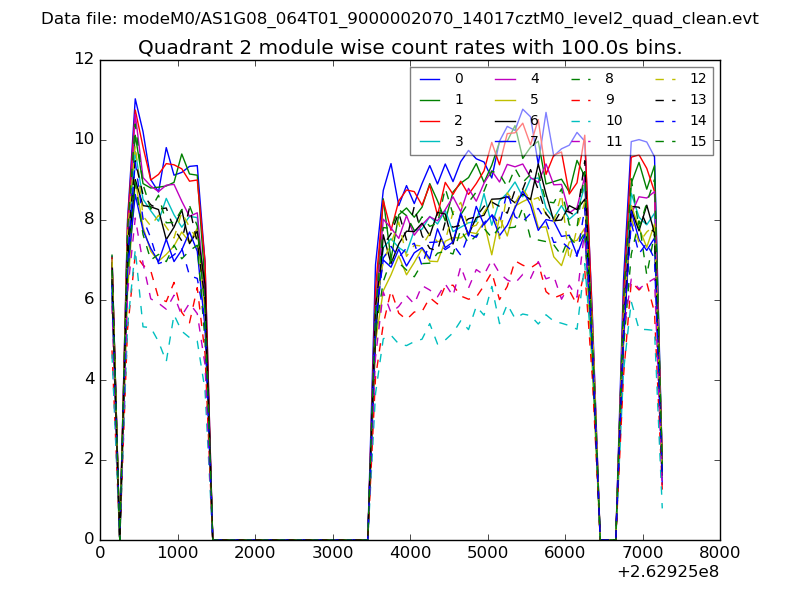
| Module-wise count rates for Quadrant B Data is divided into 100 sec bins |
 |
 |
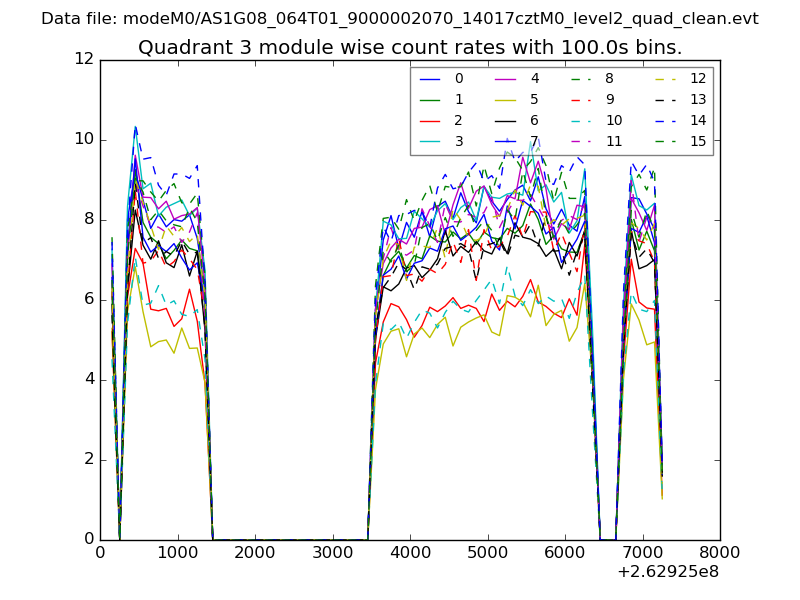
| Module-wise count rates for Quadrant C Data is divided into 100 sec bins |
 |
 |
| Module-wise count rates for Quadrant D Data is divided into 100 sec bins |
 |
 |
| Parameter | Plot |
|---|---|
| CZT HV Monitor | 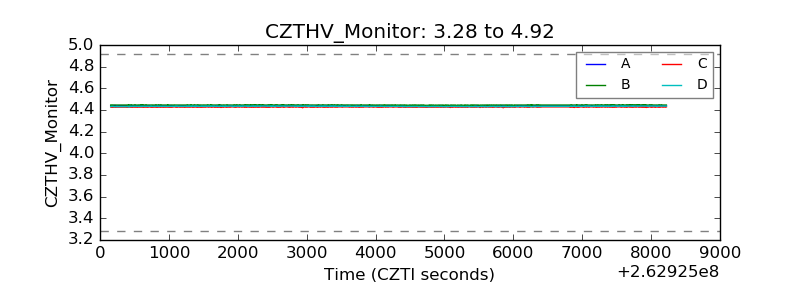 |
| D_VDD | 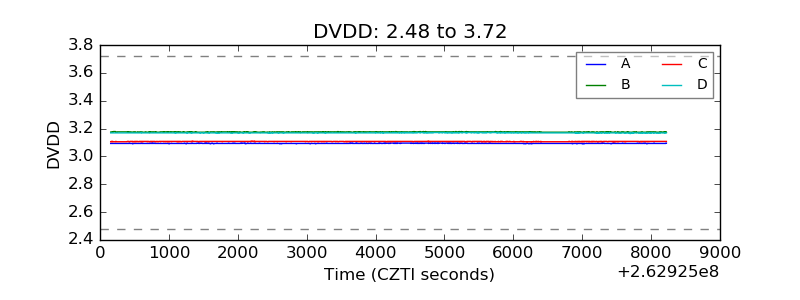 |
| Temperature 1 | 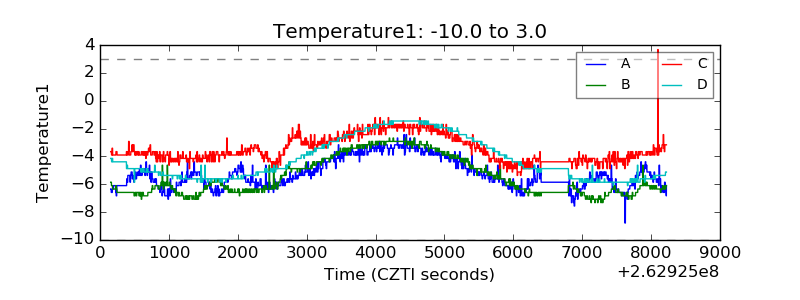 |
| Veto HV Monitor | 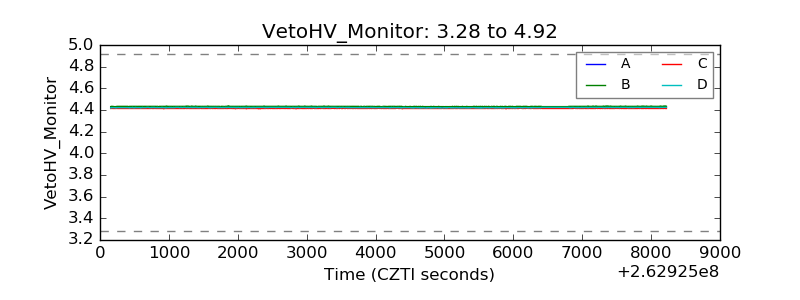 |
| Veto LLD | 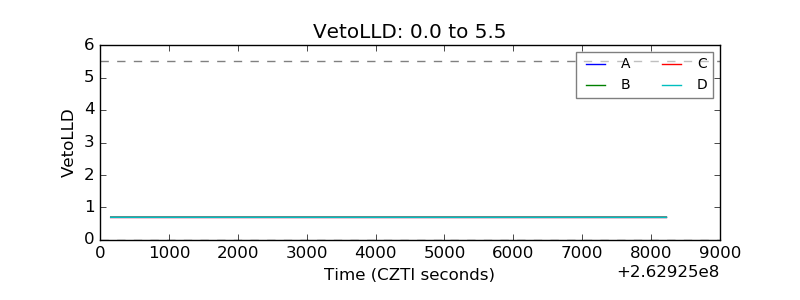 |
| Alpha Counter | 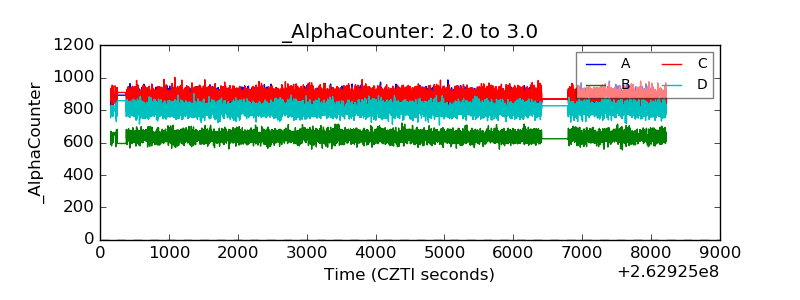 |
| _CPM_Rate | 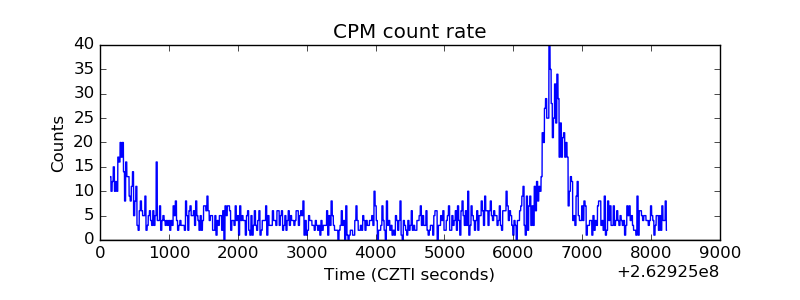 |
| CZT Counter | 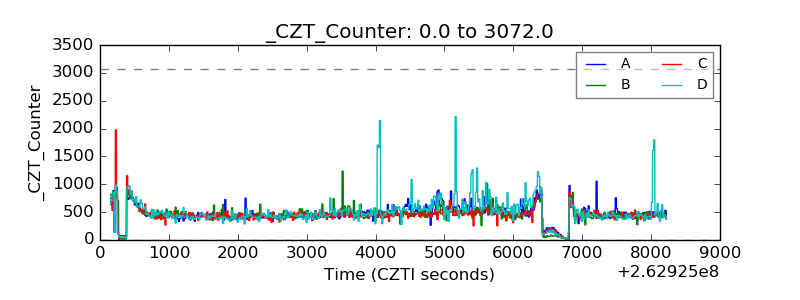 |
| +2.5 Volts monitor | 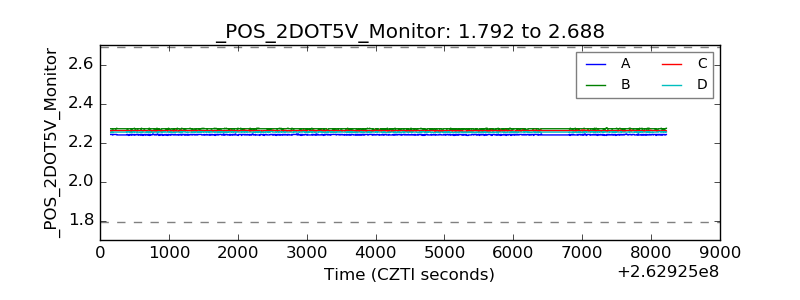 |
| +5 Volts monitor |  |
| _ROLL_ROT | 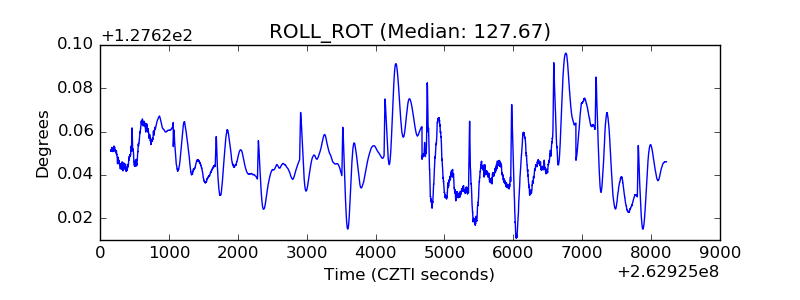 |
| _Roll_DEC | 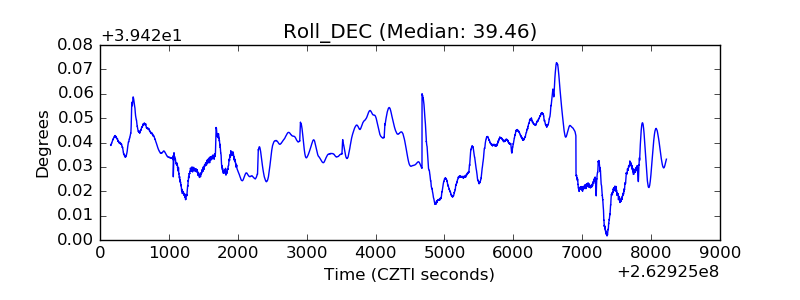 |
| _Roll_RA | 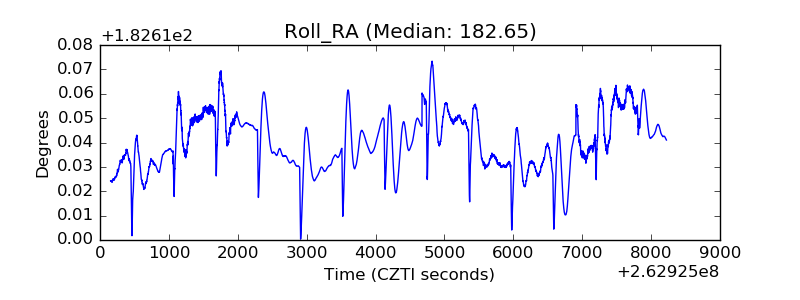 |
| Veto Counter | 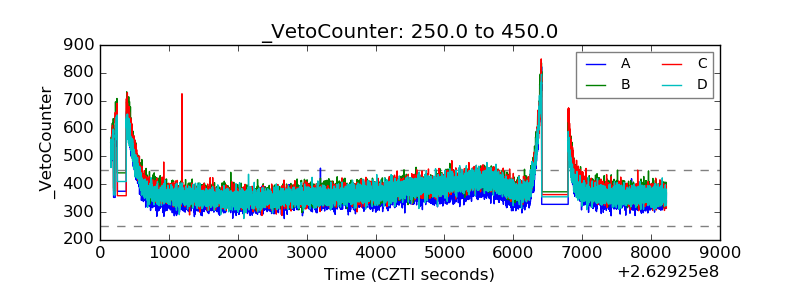 |