| Param | Original file | Final file |
|---|---|---|
| Filename | modeM0/AS1G08_064T01_9000002070_14019cztM0_level2.evt | modeM0/AS1G08_064T01_9000002070_14019cztM0_level2_quad_clean.evt |
| Size (bytes) | 886,478,400 | 144,578,880 |
| Size | 845.4 MB | 137.9 MB |
| Events in quadrant A | 6,126,675 | 884,442 |
| Events in quadrant B | 6,539,902 | 882,153 |
| Events in quadrant C | 6,041,489 | 888,031 |
| Events in quadrant D | 7,270,410 | 836,907 |
| Mode M0 | |||
|---|---|---|---|
| Quadrant | BADHDUFLAG | Total packets | Discarded packets |
| A | 0 | 26382 | 4 |
| B | 0 | 27744 | 3 |
| C | 0 | 26256 | 3 |
| D | 0 | 30276 | 3 |
| Mode SS | |||
|---|---|---|---|
| Quadrant | BADHDUFLAG | Total packets | Discarded packets |
| A | 0 | 262 | 0 |
| B | 0 | 262 | 0 |
| C | 0 | 262 | 0 |
| D | 0 | 262 | 0 |
| Mode M9 | |||
|---|---|---|---|
| Quadrant | BADHDUFLAG | Total packets | Discarded packets |
| A | 0 | 18 | 0 |
| B | 0 | 18 | 0 |
| C | 0 | 18 | 0 |
| D | 0 | 18 | 0 |
| Quadrant | Total seconds | Saturated seconds | Saturation percentage |
|---|---|---|---|
| A | 12828 | 227 | 1.769567% |
| B | 12828 | 369 | 2.876520% |
| C | 12828 | 142 | 1.106954% |
| D | 12828 | 380 | 2.962270% |
Noise dominated data is calculated using 1-second bins in cleaned event files. If a bin has >2000 counts, and if more than 50% of those come from <1% of pixels, then it is considered to be noise-dominated and hence unusable.
| Quadrant | # 1 sec bins | Bins with >0 counts | Bins with >2000 counts | High rate bins dominated by noise | Noise dominated (total time) | Noise dominated (detector-on time) | Marked lightcurve |
|---|---|---|---|---|---|---|---|
| A | 14544 | 12832 | 0 | 0 | 0.00% | 0.00% |  |
| B | 14544 | 12832 | 110 | 110 | 0.76% | 0.86% |  |
| C | 14543 | 12831 | 2 | 2 | 0.01% | 0.02% |  |
| D | 14543 | 12831 | 181 | 181 | 1.24% | 1.41% |  |
Top three noisy pixels from each quadrant. If the there are fewer than three noisy pixels in the level2.evt file, extra rows are filled as -1
| Pixel properties | Quadrant properties | ||||||
|---|---|---|---|---|---|---|---|
| Quadrant | DetID | PixID | Counts | Sigma | Mean | Median | Sigma |
| A | 8 | 15 | 165278 | 527.56 | 1528 | 1488 | 310.5 |
| A | 12 | 189 | 32380 | 99.5 | 1528 | 1488 | 310.5 |
| A | 1 | 162 | 31927 | 98.04 | 1528 | 1488 | 310.5 |
| B | 10 | 16 | 285508 | 972.75 | 1515 | 1473 | 292.0 |
| B | 3 | 64 | 106184 | 358.61 | 1515 | 1473 | 292.0 |
| B | 0 | 156 | 80326 | 270.05 | 1515 | 1473 | 292.0 |
| C | 3 | 233 | 216696 | 622.21 | 1490 | 1498 | 345.9 |
| C | 14 | 234 | 15535 | 40.59 | 1490 | 1498 | 345.9 |
| C | 13 | 61 | 10683 | 26.56 | 1490 | 1498 | 345.9 |
| D | 15 | 0 | 535919 | 1448.06 | 1464 | 1423 | 369.1 |
| D | 13 | 189 | 362471 | 978.15 | 1464 | 1423 | 369.1 |
| D | 1 | 52 | 231985 | 624.64 | 1464 | 1423 | 369.1 |
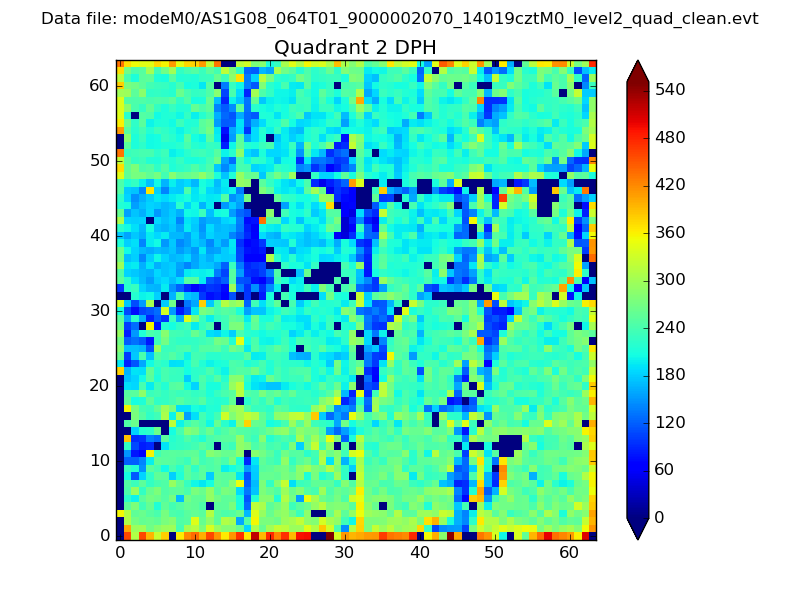
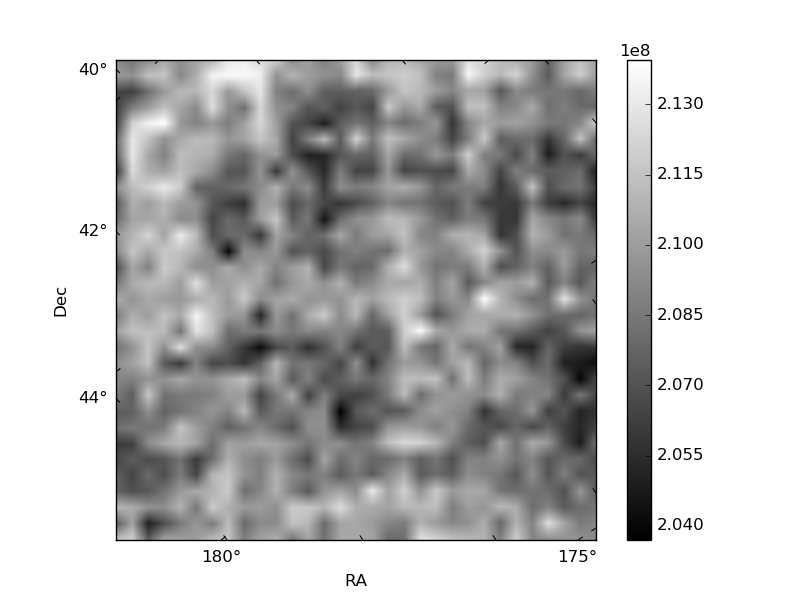
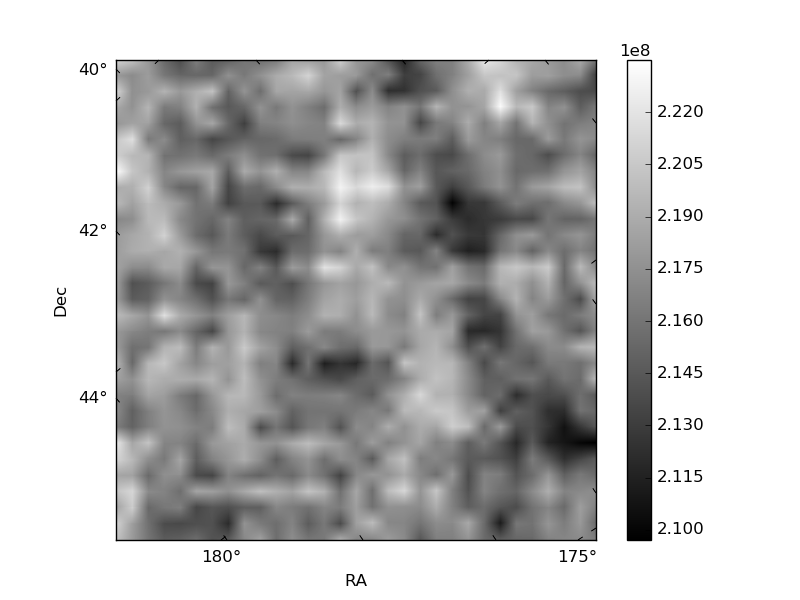
Histogram calculated using DETX and DETY for each event in the final _common_clean file
| Quadrant A | 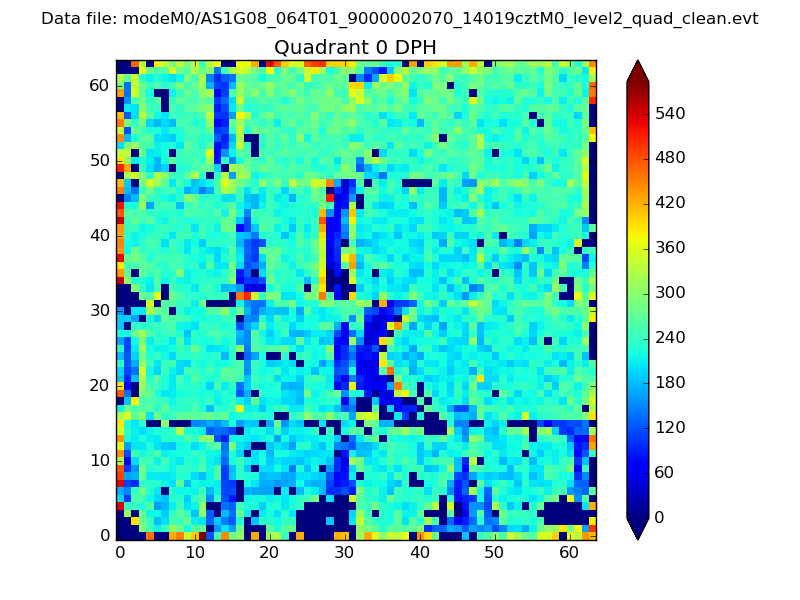 |
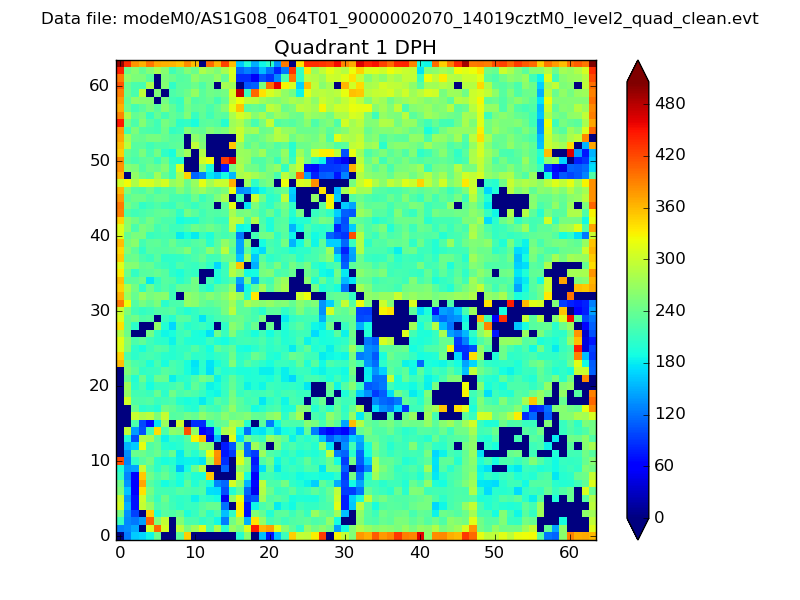 |
Quadrant B |
|---|---|---|---|
| Quadrant D | 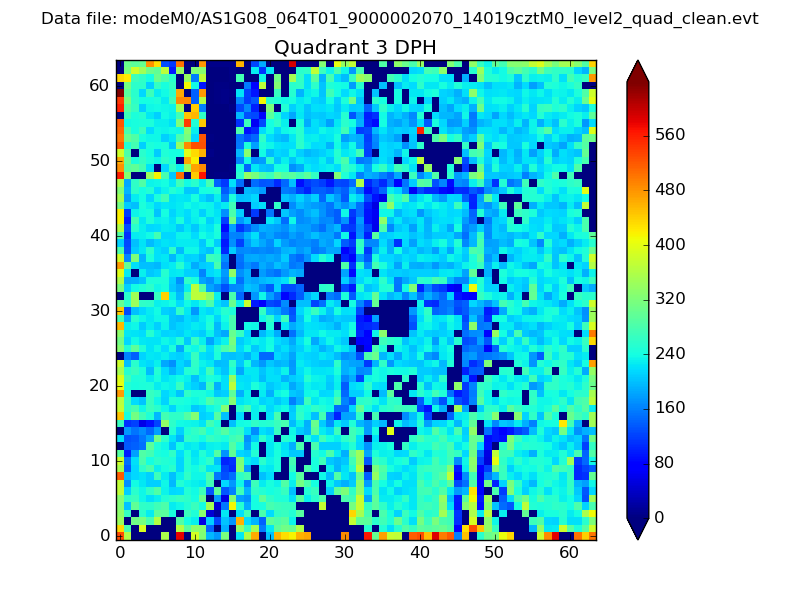 |
 |
Quadrant C |
| Plot type | Count rate plots | Images |
|---|---|---|
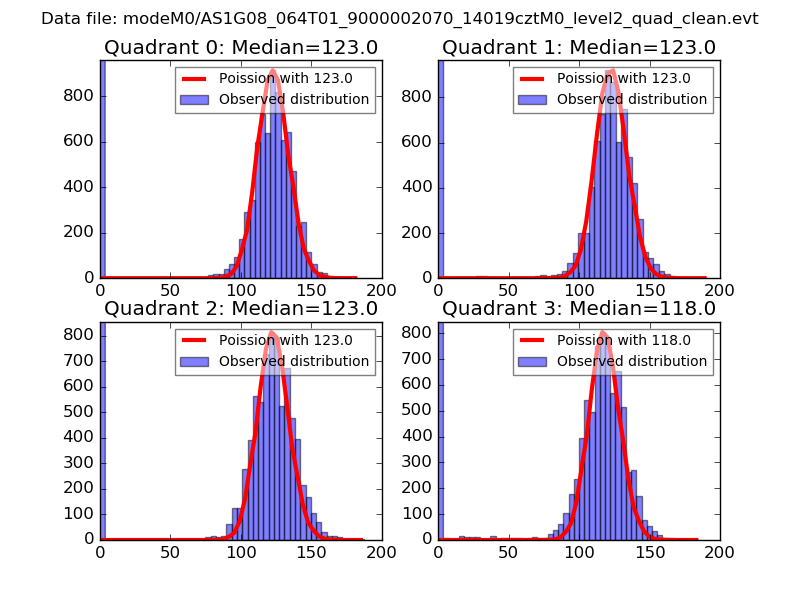
| Comparison with Poisson distribution Blue bars denote a histogram of data divided into 1 sec bins. Red curve is a Poisson curve with rate = median count rate of data. |
 |
 |
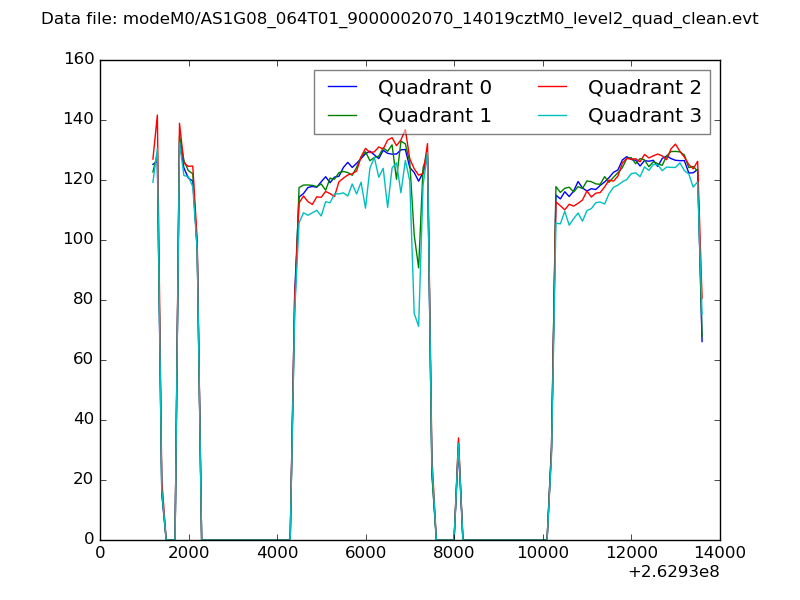
| Quadrant-wise count rates Data is divided into 100 sec bins |
 |
|
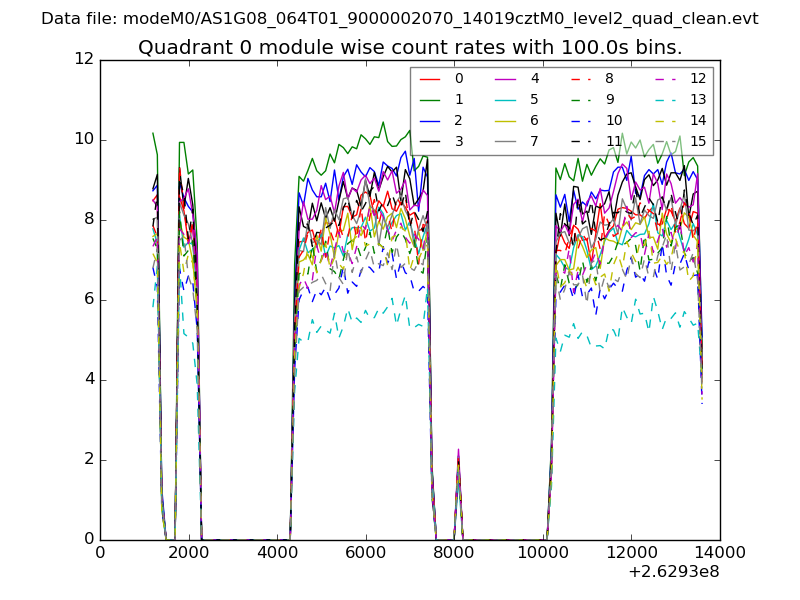
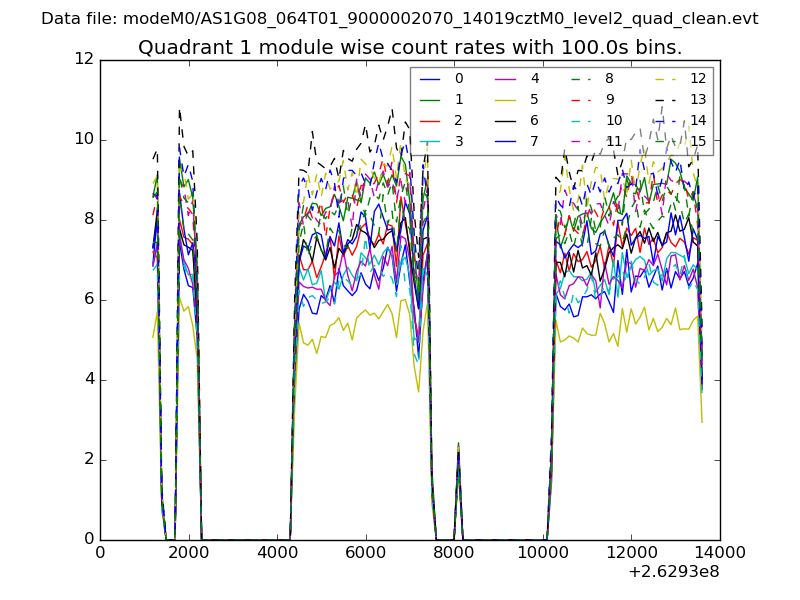
| Module-wise count rates for Quadrant A Data is divided into 100 sec bins |
 |
 |
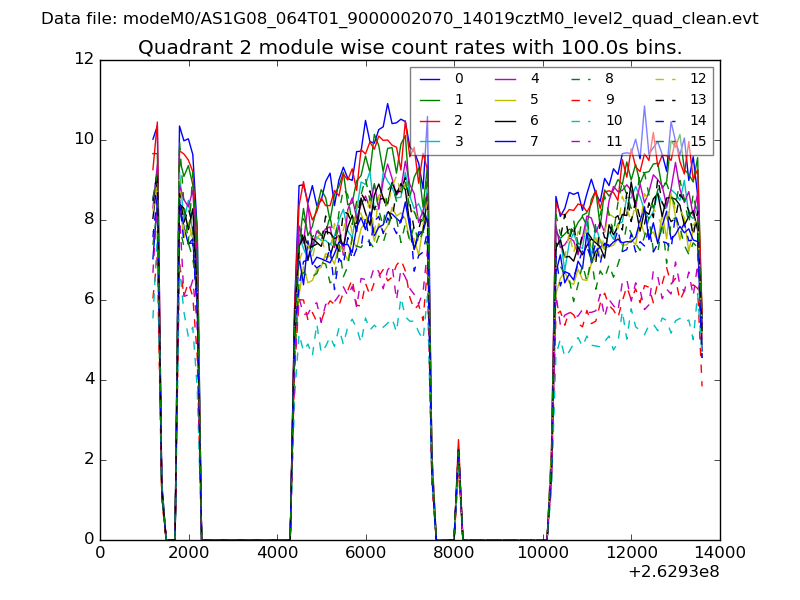
| Module-wise count rates for Quadrant B Data is divided into 100 sec bins |
 |
 |
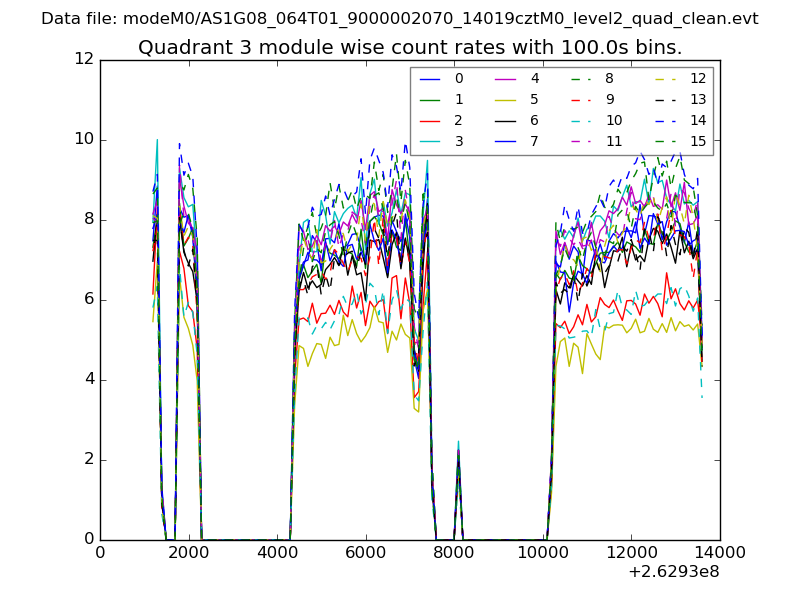
| Module-wise count rates for Quadrant C Data is divided into 100 sec bins |
 |
 |
| Module-wise count rates for Quadrant D Data is divided into 100 sec bins |
 |
 |
| Parameter | Plot |
|---|---|
| CZT HV Monitor | 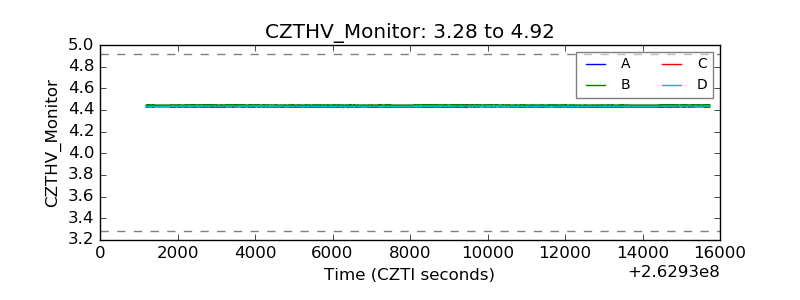 |
| D_VDD | 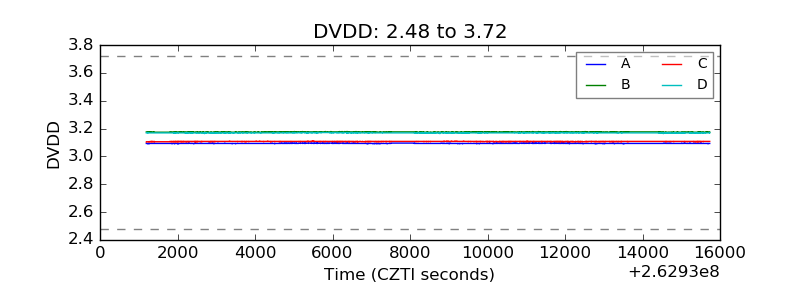 |
| Temperature 1 | 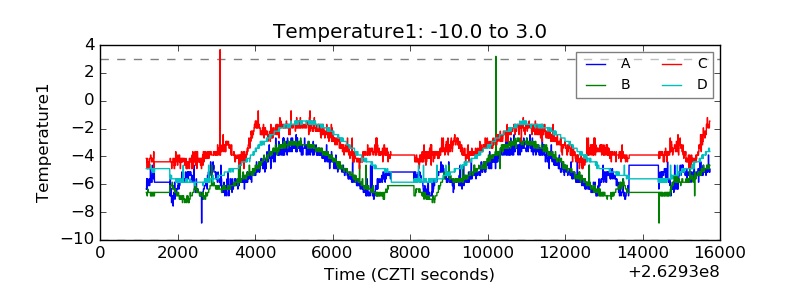 |
| Veto HV Monitor | 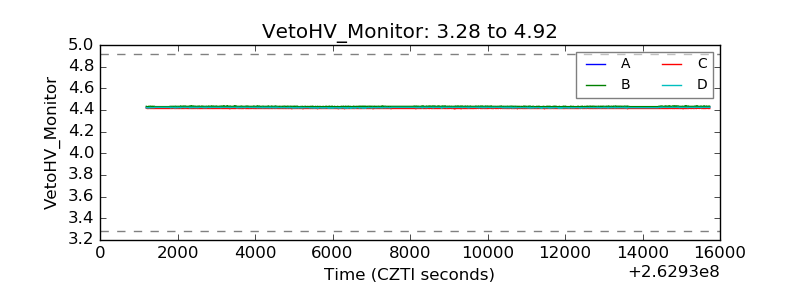 |
| Veto LLD | 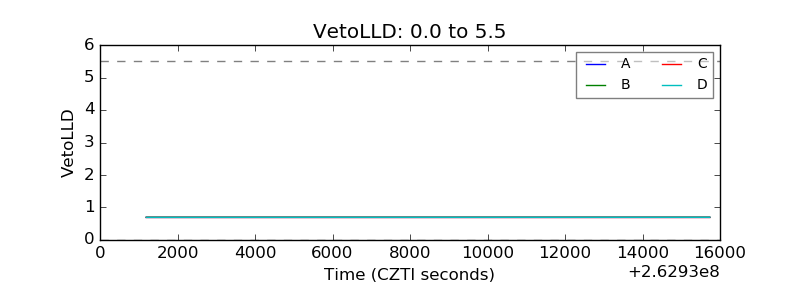 |
| Alpha Counter | 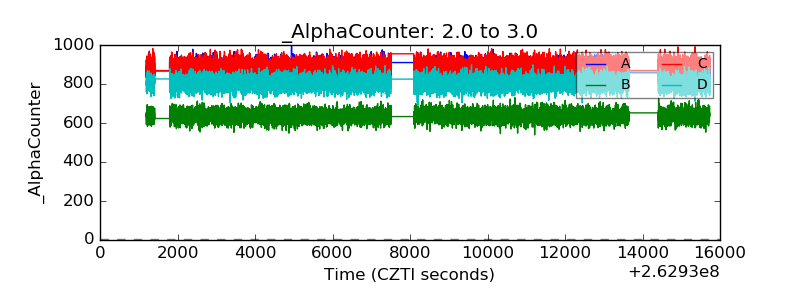 |
| _CPM_Rate | 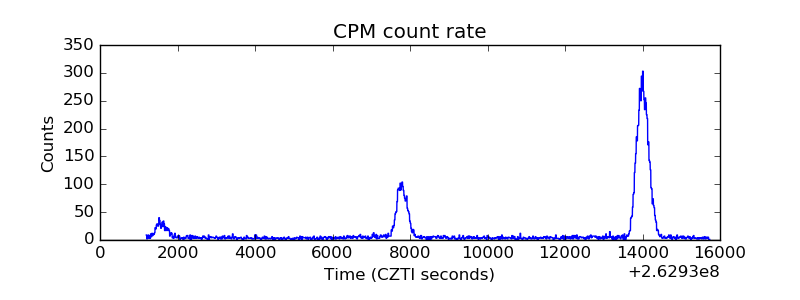 |
| CZT Counter | 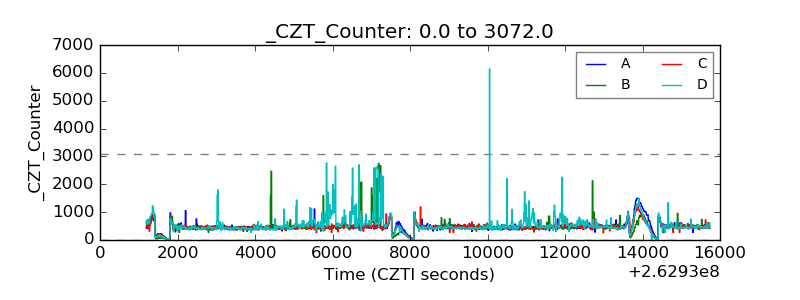 |
| +2.5 Volts monitor |  |
| +5 Volts monitor |  |
| _ROLL_ROT | 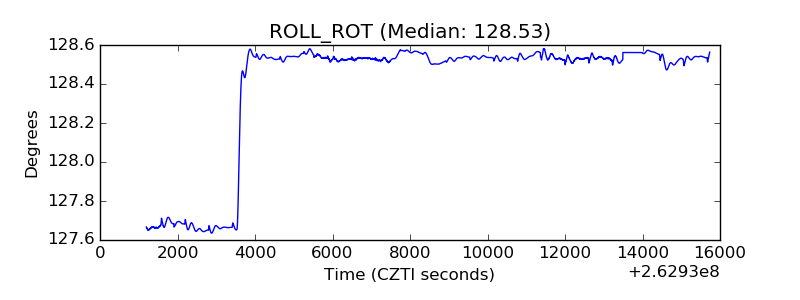 |
| _Roll_DEC | 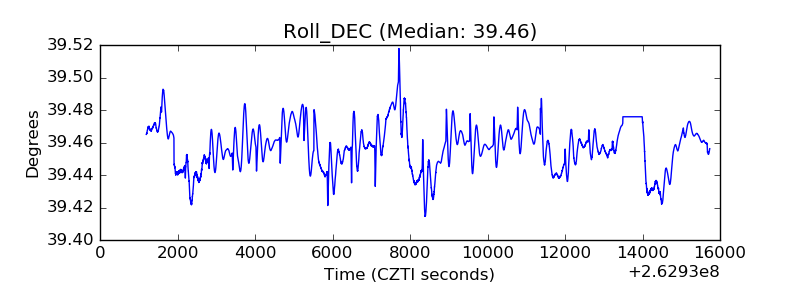 |
| _Roll_RA | 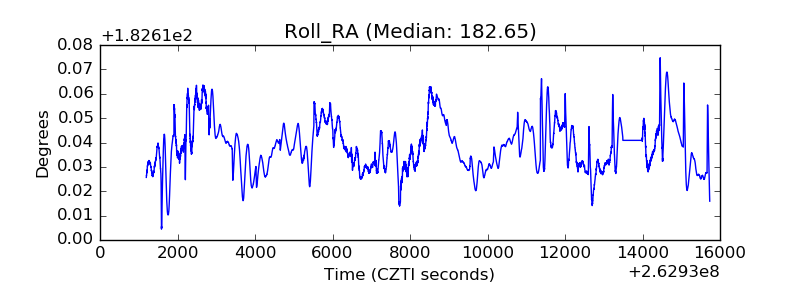 |
| Veto Counter | 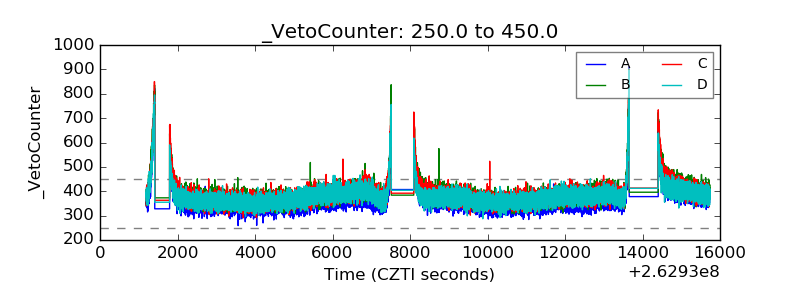 |