| Param | Original file | Final file |
|---|---|---|
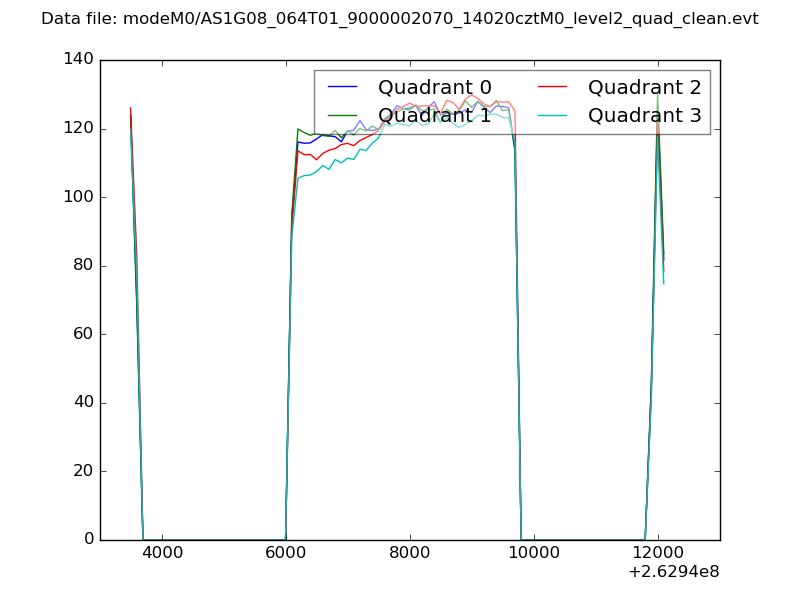
| Filename | modeM0/AS1G08_064T01_9000002070_14020cztM0_level2.evt | modeM0/AS1G08_064T01_9000002070_14020cztM0_level2_quad_clean.evt |
| Size (bytes) | 484,706,880 | 80,801,280 |
| Size | 462.3 MB | 77.1 MB |
| Events in quadrant A | 3,387,789 | 494,237 |
| Events in quadrant B | 3,568,355 | 496,397 |
| Events in quadrant C | 3,392,741 | 493,747 |
| Events in quadrant D | 3,855,093 | 474,978 |
| Mode M0 | |||
|---|---|---|---|
| Quadrant | BADHDUFLAG | Total packets | Discarded packets |
| A | 0 | 14468 | 3 |
| B | 0 | 14982 | 2 |
| C | 0 | 14439 | 2 |
| D | 0 | 15735 | 2 |
| Mode SS | |||
|---|---|---|---|
| Quadrant | BADHDUFLAG | Total packets | Discarded packets |
| A | 0 | 142 | 0 |
| B | 0 | 142 | 0 |
| C | 0 | 142 | 0 |
| D | 0 | 142 | 0 |
| Mode M9 | |||
|---|---|---|---|
| Quadrant | BADHDUFLAG | Total packets | Discarded packets |
| A | 0 | 18 | 0 |
| B | 0 | 18 | 0 |
| C | 0 | 18 | 0 |
| D | 0 | 18 | 0 |
| Quadrant | Total seconds | Saturated seconds | Saturation percentage |
|---|---|---|---|
| A | 7003 | 143 | 2.041982% |
| B | 7003 | 156 | 2.227617% |
| C | 7003 | 98 | 1.399400% |
| D | 7003 | 135 | 1.927745% |
Noise dominated data is calculated using 1-second bins in cleaned event files. If a bin has >2000 counts, and if more than 50% of those come from <1% of pixels, then it is considered to be noise-dominated and hence unusable.
| Quadrant | # 1 sec bins | Bins with >0 counts | Bins with >2000 counts | High rate bins dominated by noise | Noise dominated (total time) | Noise dominated (detector-on time) | Marked lightcurve |
|---|---|---|---|---|---|---|---|
| A | 8669 | 7006 | 0 | 0 | 0.00% | 0.00% | 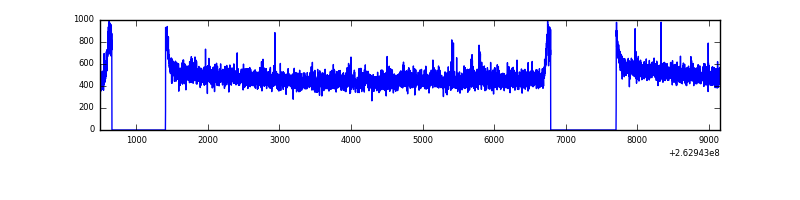 |
| B | 8669 | 7006 | 17 | 17 | 0.20% | 0.24% |  |
| C | 8669 | 7006 | 0 | 0 | 0.00% | 0.00% | 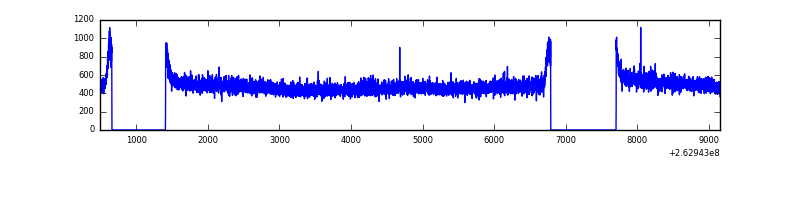 |
| D | 8669 | 7006 | 13 | 13 | 0.15% | 0.19% | 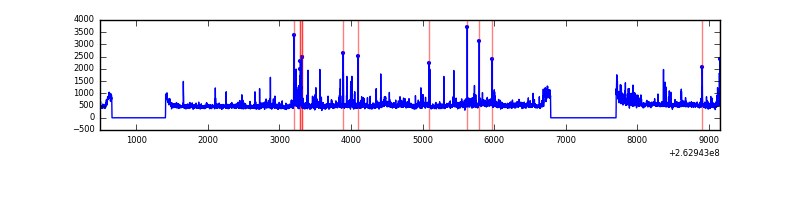 |
Top three noisy pixels from each quadrant. If the there are fewer than three noisy pixels in the level2.evt file, extra rows are filled as -1
| Pixel properties | Quadrant properties | ||||||
|---|---|---|---|---|---|---|---|
| Quadrant | DetID | PixID | Counts | Sigma | Mean | Median | Sigma |
| A | 12 | 189 | 37196 | 205.33 | 862 | 839 | 177.1 |
| A | 1 | 162 | 16591 | 88.96 | 862 | 839 | 177.1 |
| A | 8 | 15 | 11642 | 61.01 | 862 | 839 | 177.1 |
| B | 10 | 16 | 91681 | 551.83 | 855 | 833 | 164.6 |
| B | 0 | 189 | 52928 | 316.44 | 855 | 833 | 164.6 |
| B | 4 | 80 | 26626 | 156.67 | 855 | 833 | 164.6 |
| C | 3 | 233 | 144101 | 740.9 | 832 | 835 | 193.4 |
| C | 13 | 61 | 6197 | 27.73 | 832 | 835 | 193.4 |
| C | 12 | 4 | 2542 | 8.83 | 832 | 835 | 193.4 |
| D | 1 | 52 | 221336 | 999.56 | 827 | 805 | 220.6 |
| D | 8 | 195 | 209010 | 943.69 | 827 | 805 | 220.6 |
| D | 13 | 189 | 128454 | 578.57 | 827 | 805 | 220.6 |
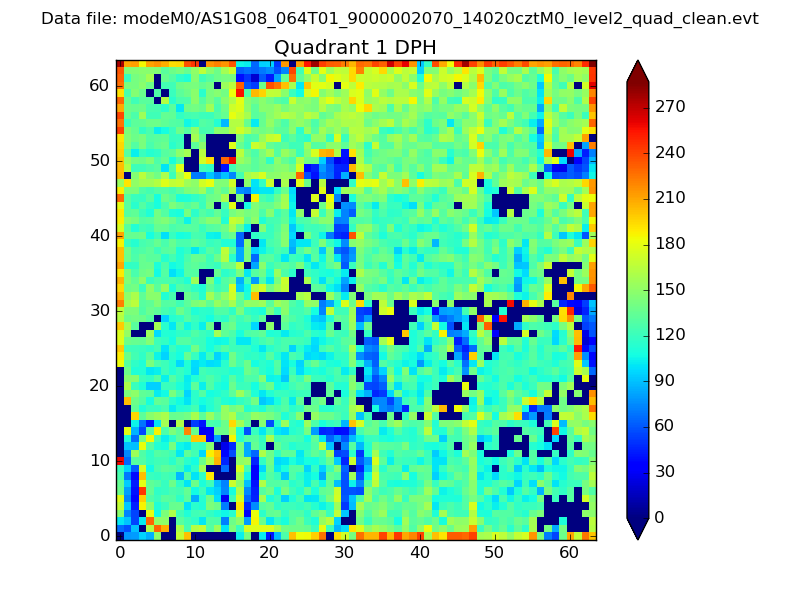
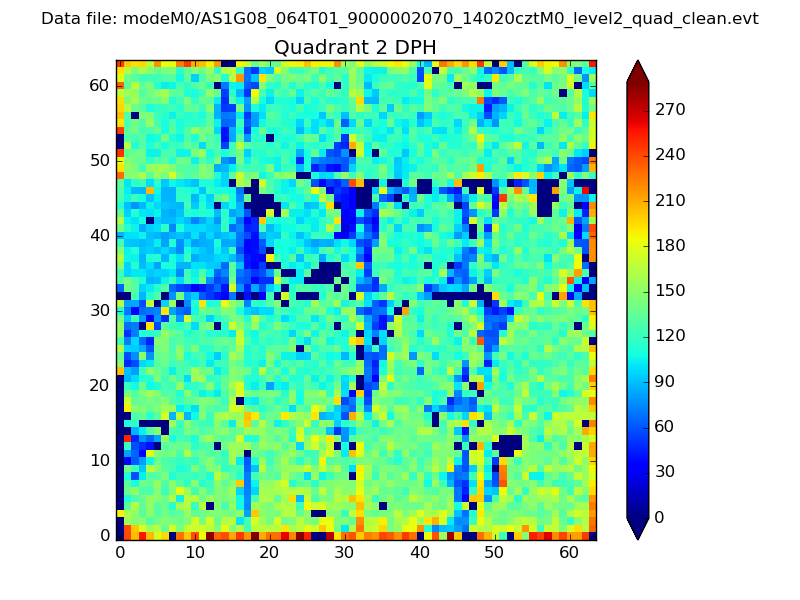
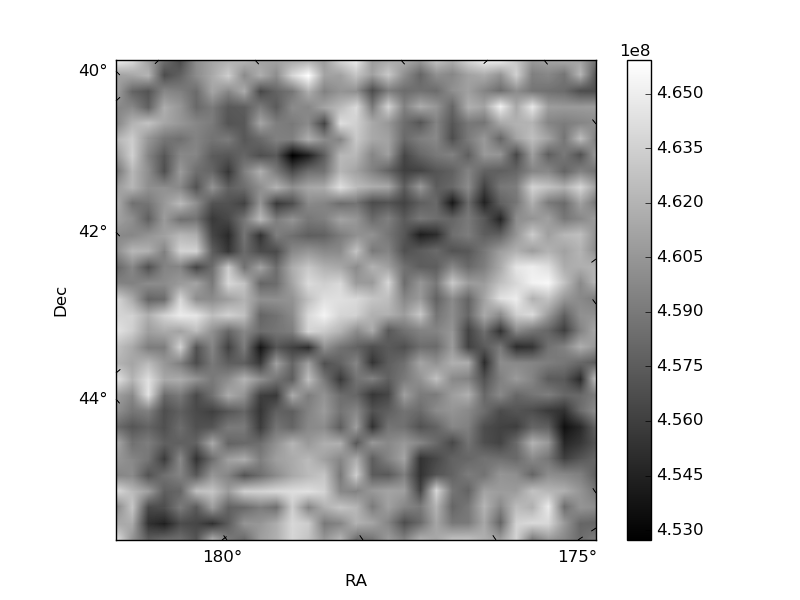
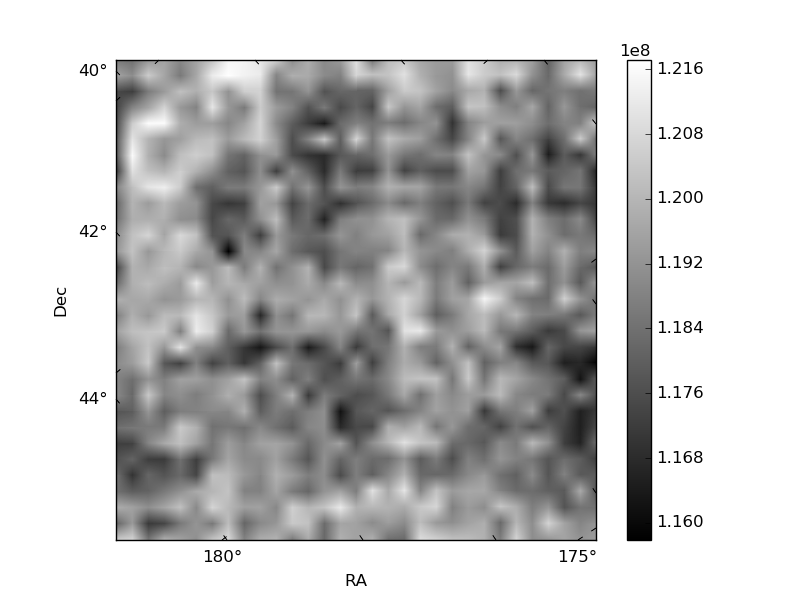
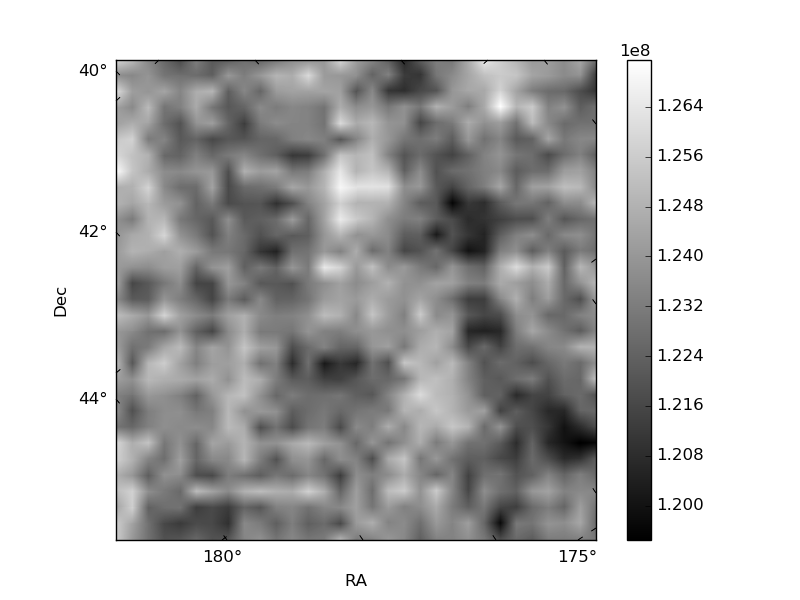
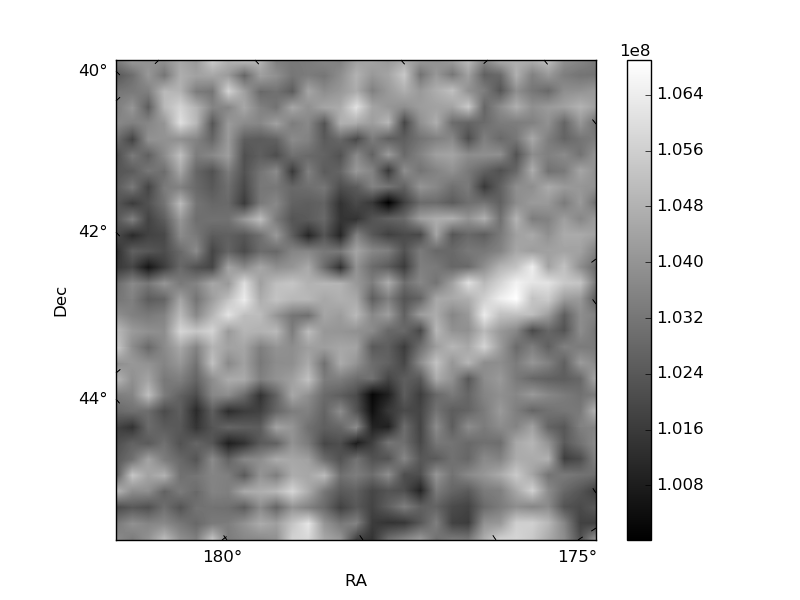
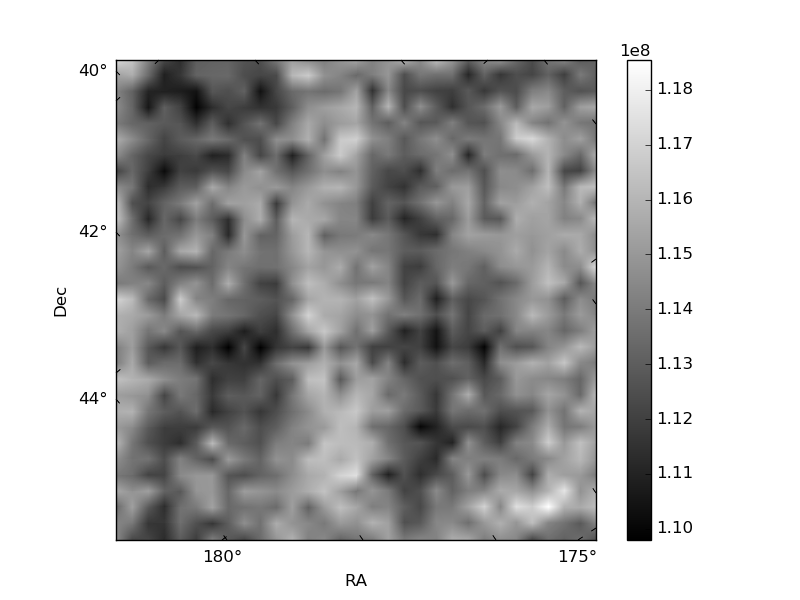
Histogram calculated using DETX and DETY for each event in the final _common_clean file
| Quadrant A | 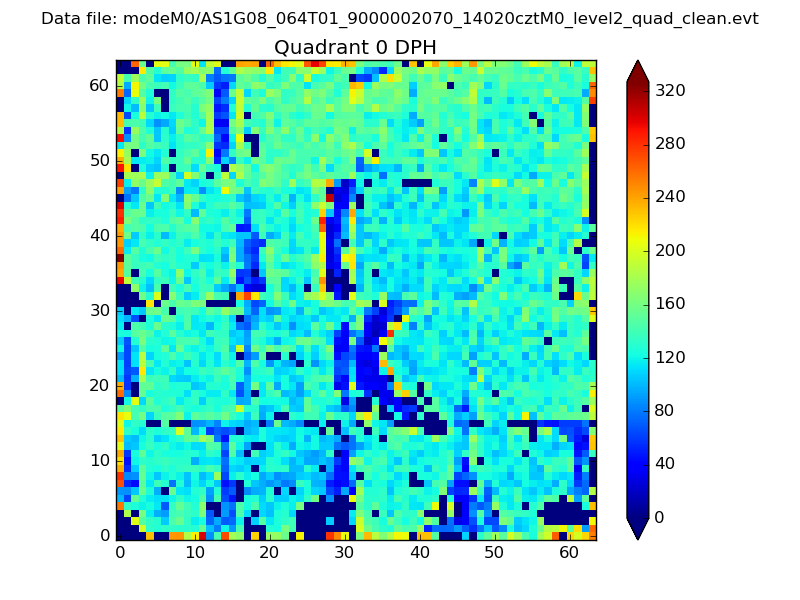 |
 |
Quadrant B |
|---|---|---|---|
| Quadrant D | 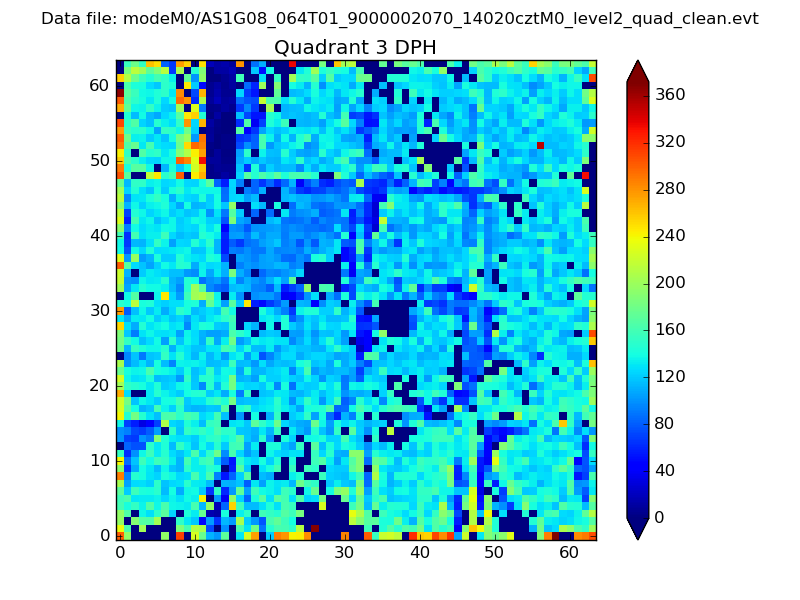 |
 |
Quadrant C |
| Plot type | Count rate plots | Images |
|---|---|---|
| Comparison with Poisson distribution Blue bars denote a histogram of data divided into 1 sec bins. Red curve is a Poisson curve with rate = median count rate of data. |
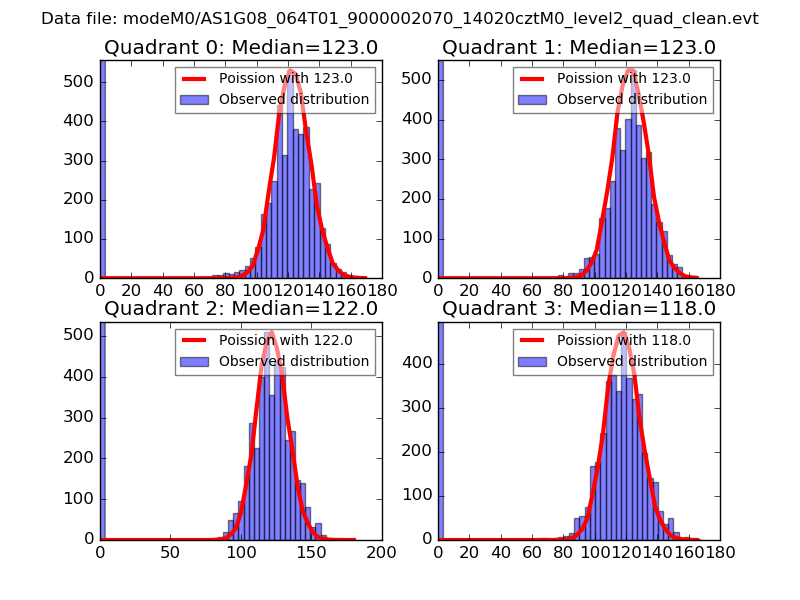 |
 |
| Quadrant-wise count rates Data is divided into 100 sec bins |
 |
|
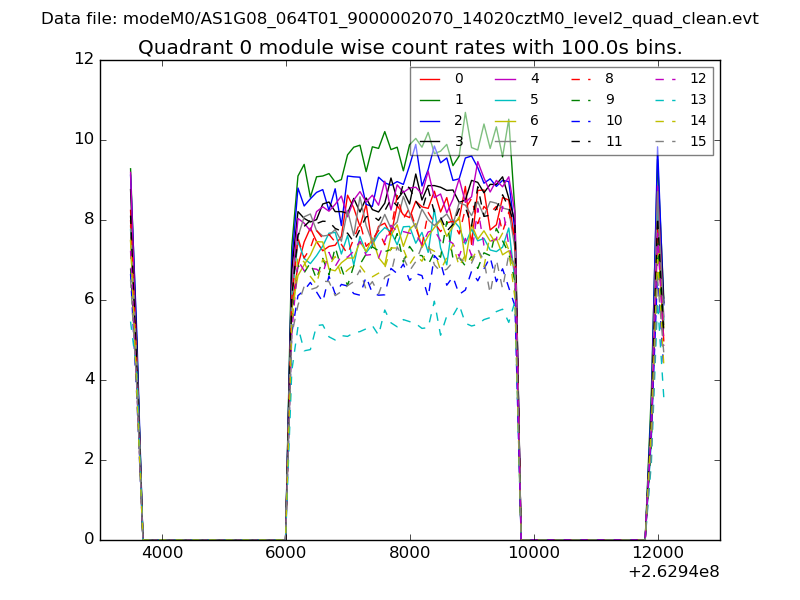
| Module-wise count rates for Quadrant A Data is divided into 100 sec bins |
 |
 |
| Module-wise count rates for Quadrant B Data is divided into 100 sec bins |
 |
 |
| Module-wise count rates for Quadrant C Data is divided into 100 sec bins |
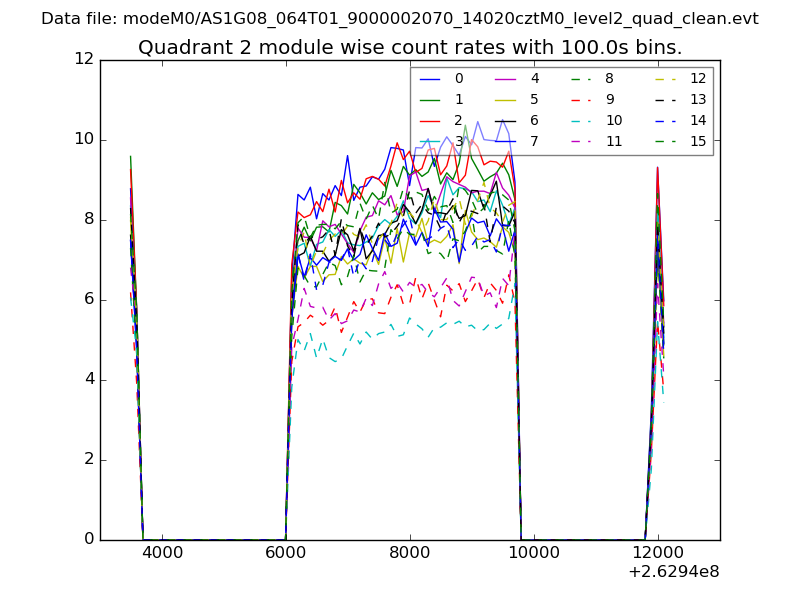 |
 |
| Module-wise count rates for Quadrant D Data is divided into 100 sec bins |
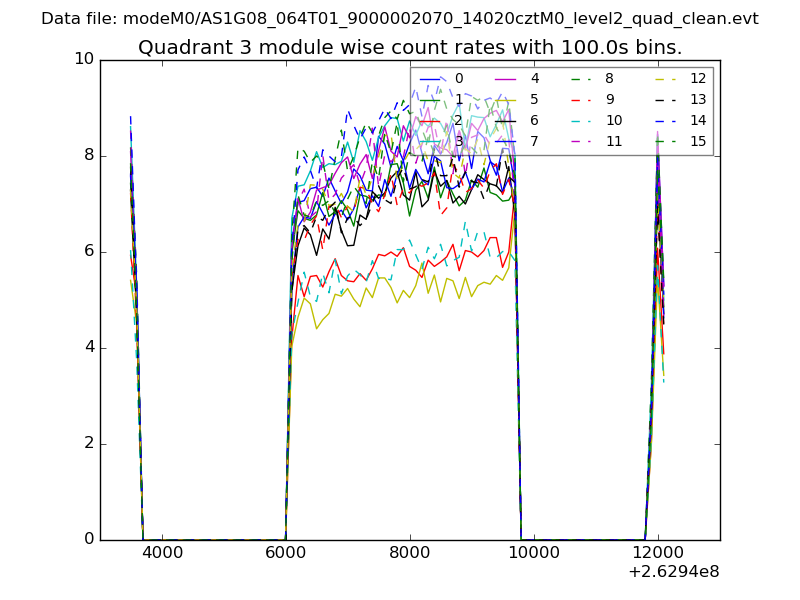 |
 |
| Parameter | Plot |
|---|---|
| CZT HV Monitor | 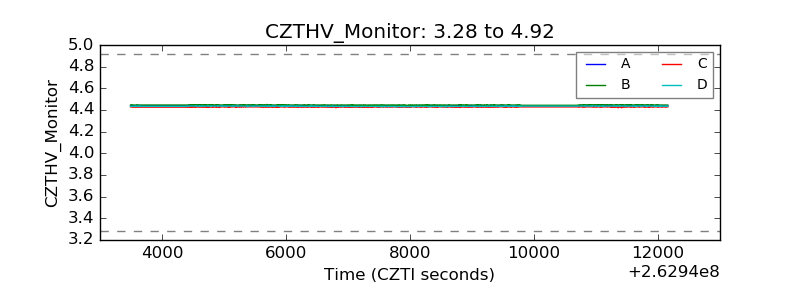 |
| D_VDD | 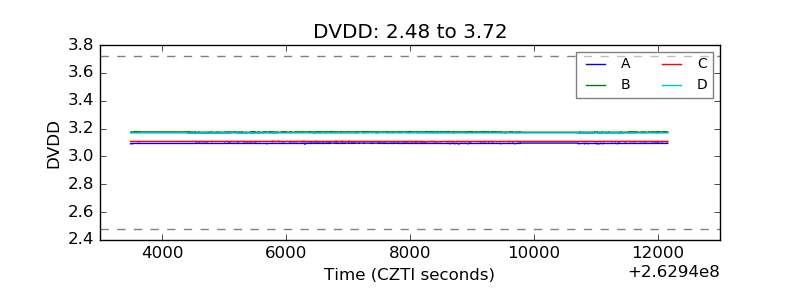 |
| Temperature 1 | 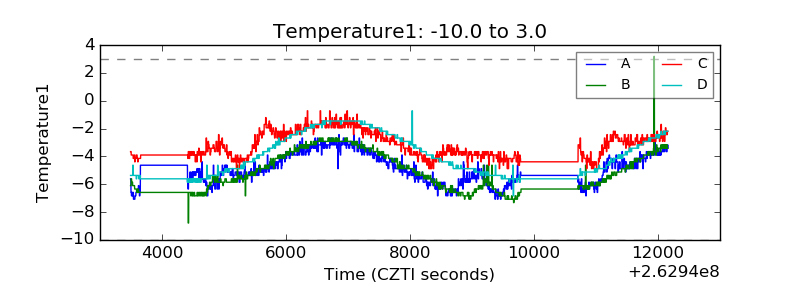 |
| Veto HV Monitor | 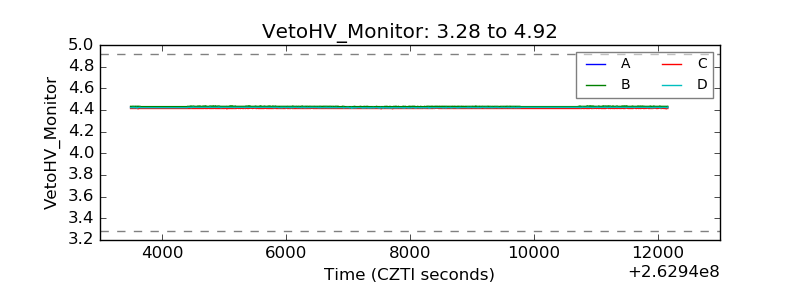 |
| Veto LLD | 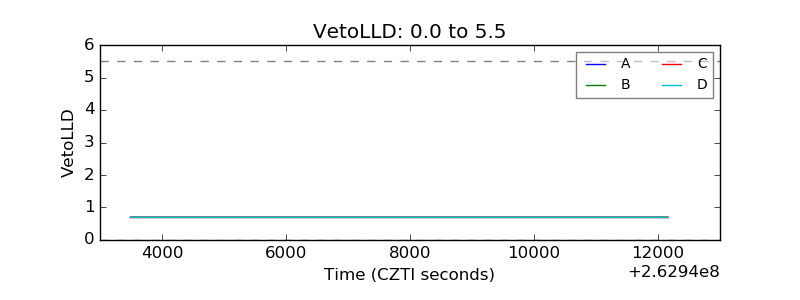 |
| Alpha Counter | 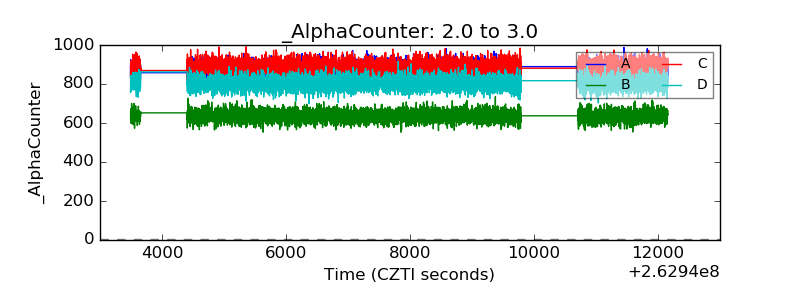 |
| _CPM_Rate | 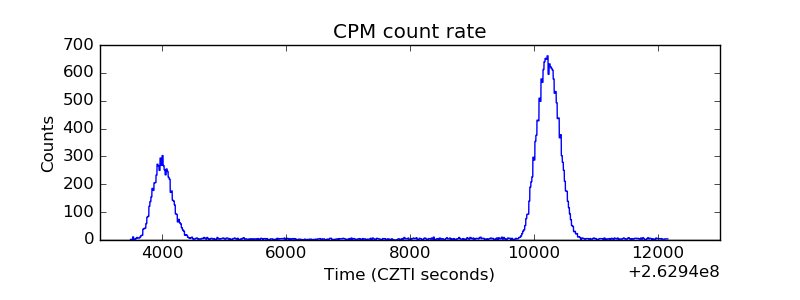 |
| CZT Counter | 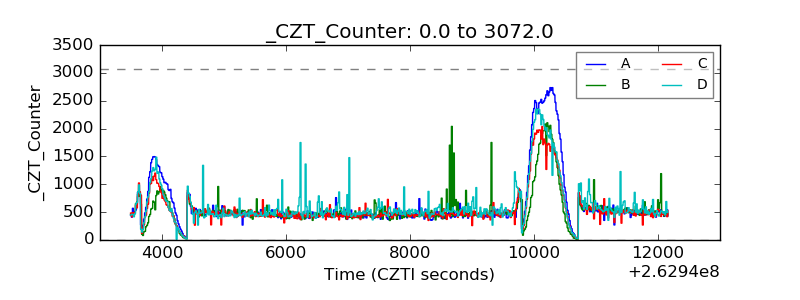 |
| +2.5 Volts monitor |  |
| +5 Volts monitor | 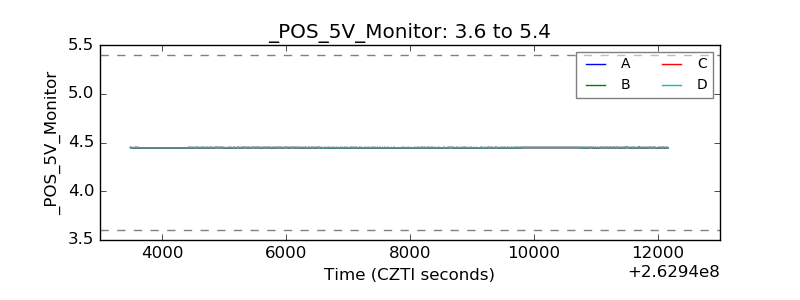 |
| _ROLL_ROT | 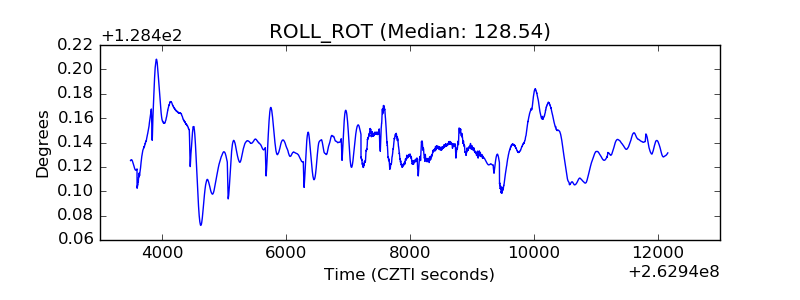 |
| _Roll_DEC | 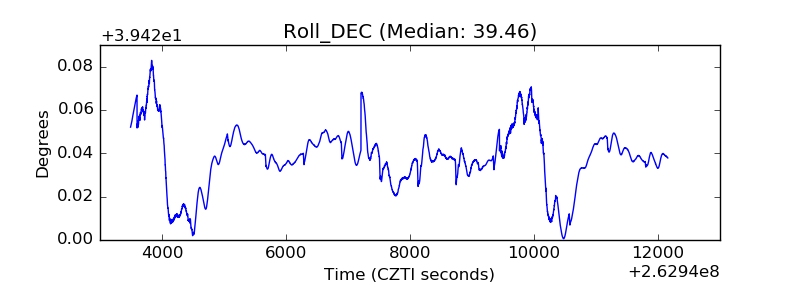 |
| _Roll_RA | 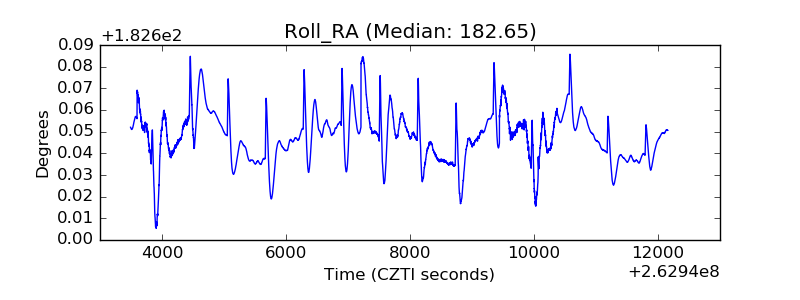 |
| Veto Counter | 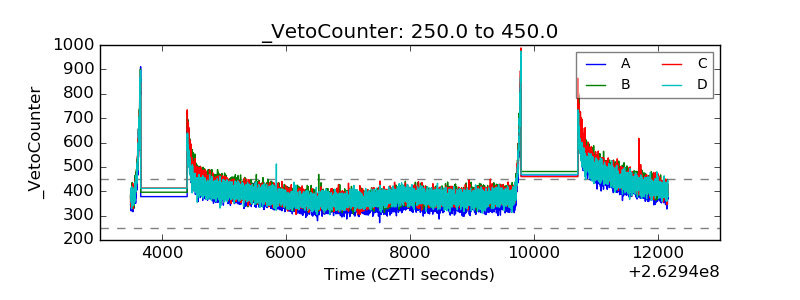 |