| Param | Original file | Final file |
|---|---|---|
| Filename | modeM0/AS1G08_064T01_9000002070_14022cztM0_level2.evt | modeM0/AS1G08_064T01_9000002070_14022cztM0_level2_quad_clean.evt |
| Size (bytes) | 247,178,880 | 38,511,360 |
| Size | 235.7 MB | 36.7 MB |
| Events in quadrant A | 1,705,500 | 237,627 |
| Events in quadrant B | 1,891,490 | 237,036 |
| Events in quadrant C | 1,698,866 | 232,052 |
| Events in quadrant D | 1,959,178 | 219,869 |
| Mode M0 | |||
|---|---|---|---|
| Quadrant | BADHDUFLAG | Total packets | Discarded packets |
| A | 0 | 13293 | 6283 |
| B | 0 | 13906 | 6289 |
| C | 0 | 13131 | 6132 |
| D | 0 | 14446 | 6627 |
| Mode SS | |||
|---|---|---|---|
| Quadrant | BADHDUFLAG | Total packets | Discarded packets |
| A | 0 | 128 | 64 |
| B | 0 | 127 | 59 |
| C | 0 | 125 | 59 |
| D | 0 | 129 | 67 |
| Mode M9 | |||
|---|---|---|---|
| Quadrant | BADHDUFLAG | Total packets | Discarded packets |
| A | 0 | 21 | 12 |
| B | 0 | 22 | 13 |
| C | 0 | 19 | 9 |
| D | 0 | 21 | 9 |
| Quadrant | Total seconds | Saturated seconds | Saturation percentage |
|---|---|---|---|
| A | 3365 | 23 | 0.683507% |
| B | 3389 | 64 | 1.888463% |
| C | 3390 | 11 | 0.324484% |
| D | 3351 | 45 | 1.342883% |
Noise dominated data is calculated using 1-second bins in cleaned event files. If a bin has >2000 counts, and if more than 50% of those come from <1% of pixels, then it is considered to be noise-dominated and hence unusable.
| Quadrant | # 1 sec bins | Bins with >0 counts | Bins with >2000 counts | High rate bins dominated by noise | Noise dominated (total time) | Noise dominated (detector-on time) | Marked lightcurve |
|---|---|---|---|---|---|---|---|
| A | 7684 | 3640 | 0 | 0 | 0.00% | 0.00% | 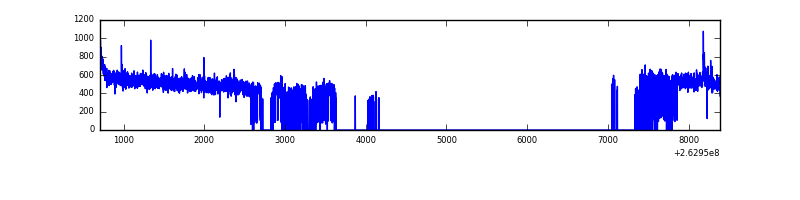 |
| B | 7684 | 3677 | 32 | 32 | 0.42% | 0.87% |  |
| C | 7684 | 3655 | 0 | 0 | 0.00% | 0.00% | 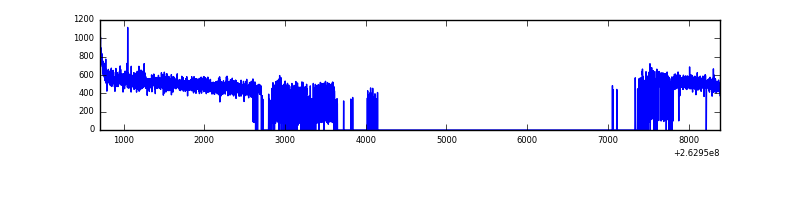 |
| D | 7684 | 3622 | 13 | 13 | 0.17% | 0.36% | 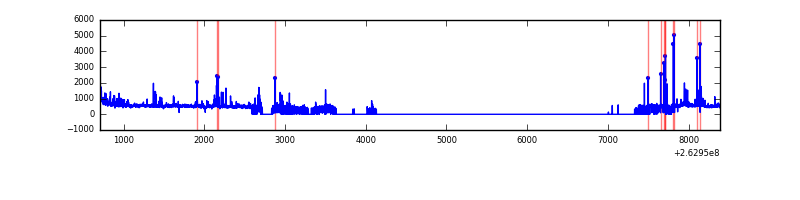 |
Top three noisy pixels from each quadrant. If the there are fewer than three noisy pixels in the level2.evt file, extra rows are filled as -1
| Pixel properties | Quadrant properties | ||||||
|---|---|---|---|---|---|---|---|
| Quadrant | DetID | PixID | Counts | Sigma | Mean | Median | Sigma |
| A | 12 | 189 | 11657 | 125.18 | 436 | 427 | 89.7 |
| A | 1 | 162 | 5616 | 57.84 | 436 | 427 | 89.7 |
| A | 0 | 226 | 3994 | 39.76 | 436 | 427 | 89.7 |
| B | 10 | 16 | 141691 | 1711.25 | 428 | 419 | 82.6 |
| B | 0 | 189 | 17995 | 212.9 | 428 | 419 | 82.6 |
| B | 4 | 80 | 17475 | 206.6 | 428 | 419 | 82.6 |
| C | 3 | 233 | 73879 | 757.59 | 416 | 419 | 97.0 |
| C | 13 | 61 | 3020 | 26.82 | 416 | 419 | 97.0 |
| C | 12 | 4 | 1253 | 8.6 | 416 | 419 | 97.0 |
| D | 13 | 189 | 129640 | 1161.43 | 409 | 399 | 111.3 |
| D | 8 | 195 | 115760 | 1036.7 | 409 | 399 | 111.3 |
| D | 1 | 52 | 76016 | 679.54 | 409 | 399 | 111.3 |
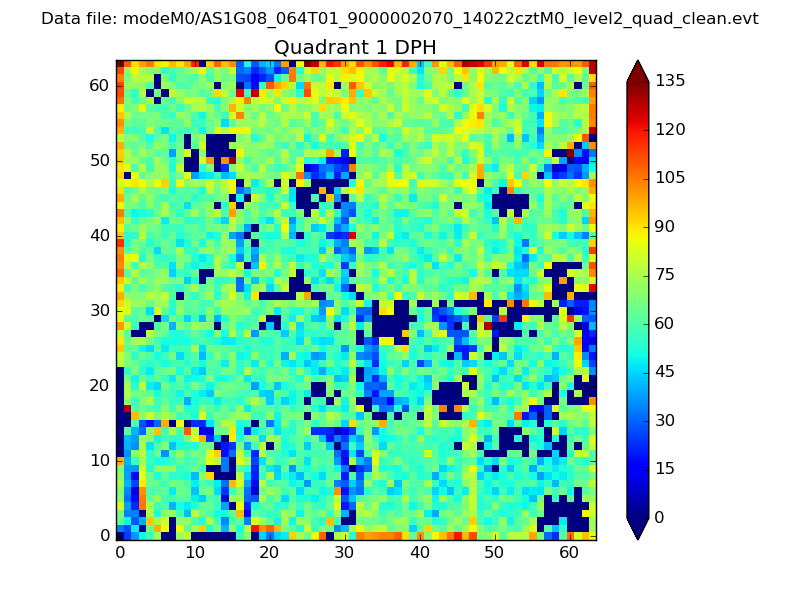
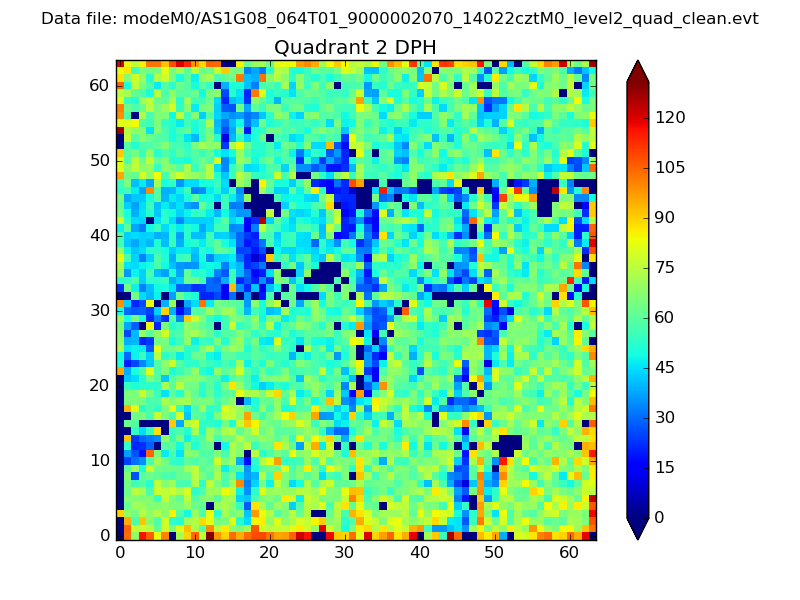
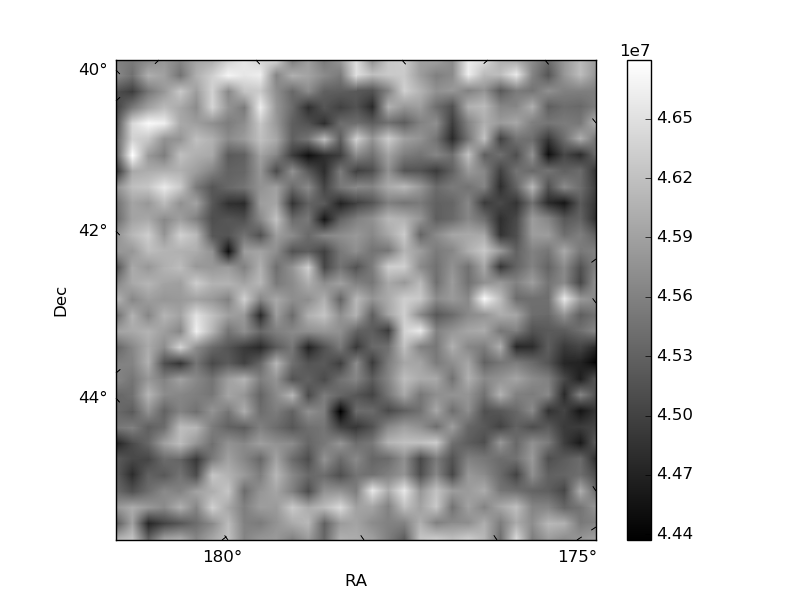
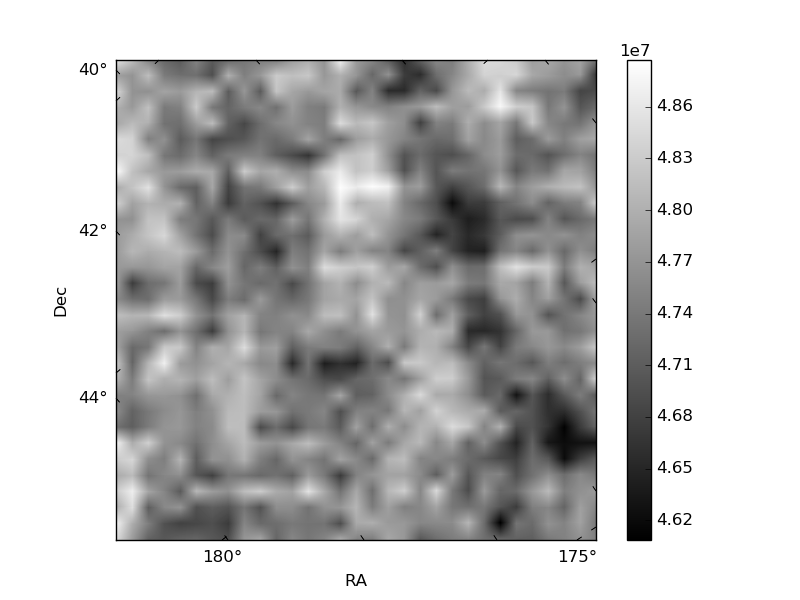
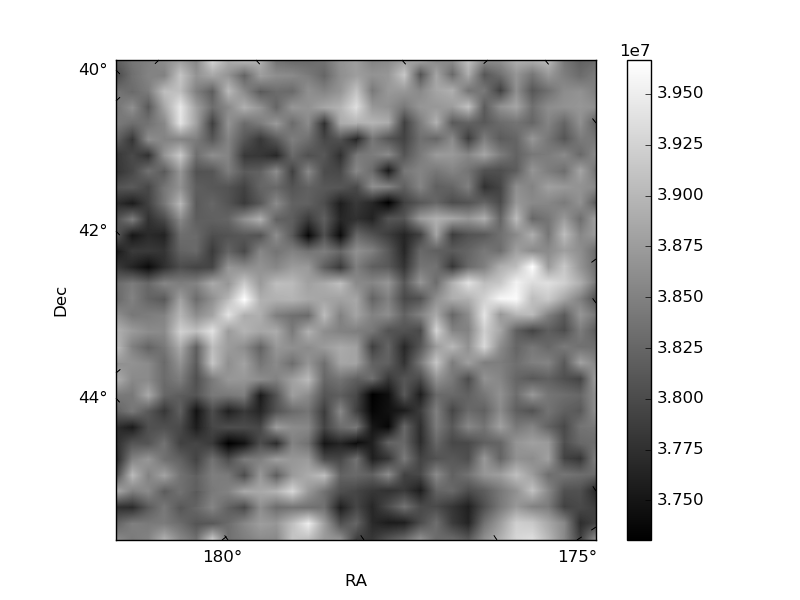
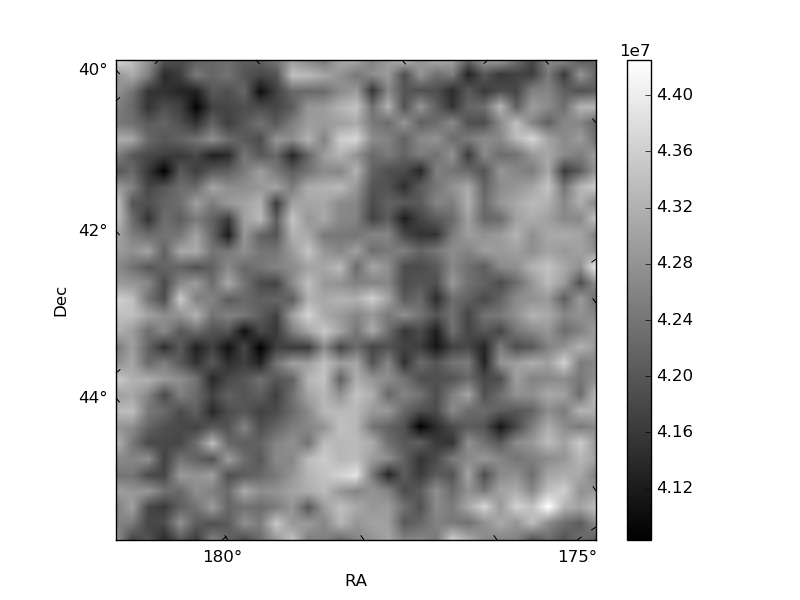
Histogram calculated using DETX and DETY for each event in the final _common_clean file
| Quadrant A | 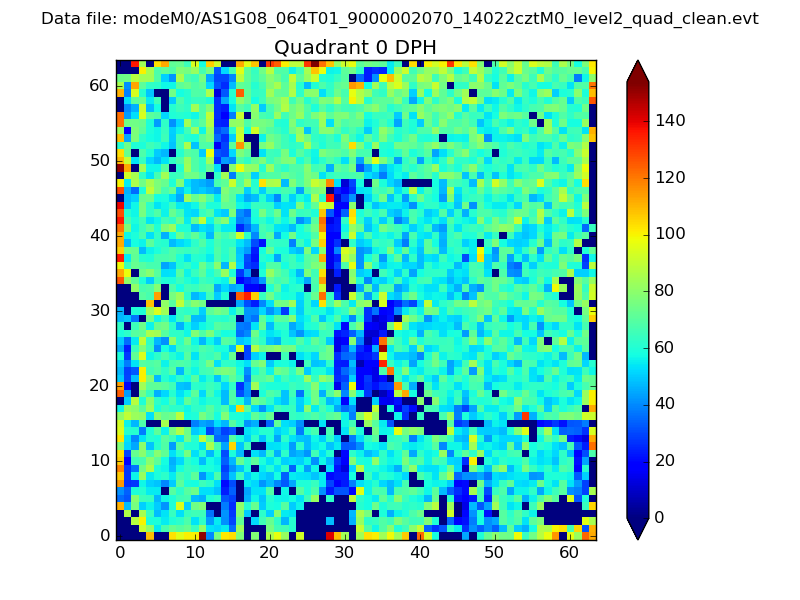 |
 |
Quadrant B |
|---|---|---|---|
| Quadrant D | 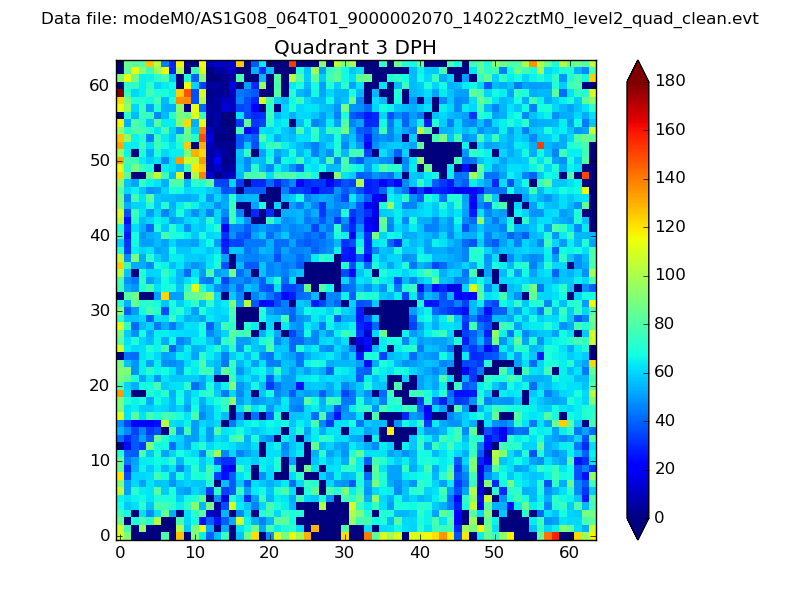 |
 |
Quadrant C |
| Plot type | Count rate plots | Images |
|---|---|---|
| Comparison with Poisson distribution Blue bars denote a histogram of data divided into 1 sec bins. Red curve is a Poisson curve with rate = median count rate of data. |
 |
 |
| Quadrant-wise count rates Data is divided into 100 sec bins |
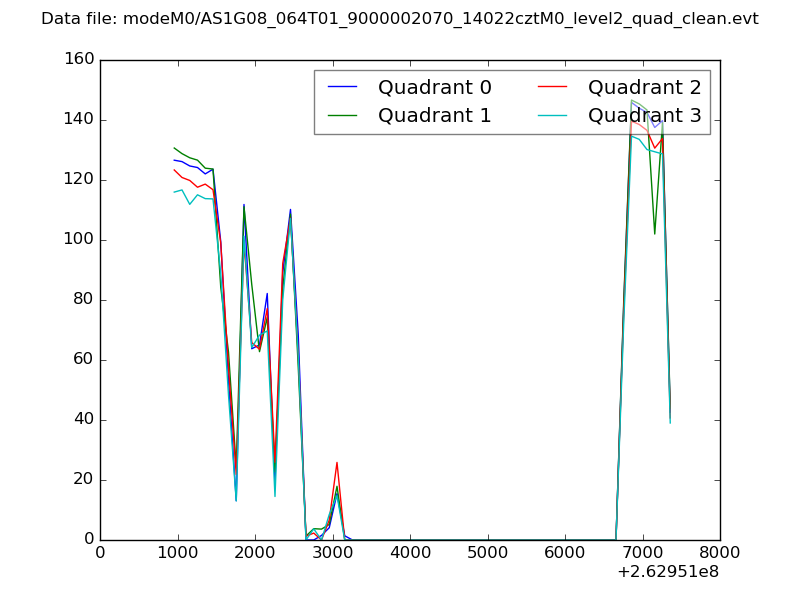 |
|
| Module-wise count rates for Quadrant A Data is divided into 100 sec bins |
 |
 |
| Module-wise count rates for Quadrant B Data is divided into 100 sec bins |
 |
 |
| Module-wise count rates for Quadrant C Data is divided into 100 sec bins |
 |
 |
| Module-wise count rates for Quadrant D Data is divided into 100 sec bins |
 |
 |
| Parameter | Plot |
|---|---|
| CZT HV Monitor |  |
| D_VDD | 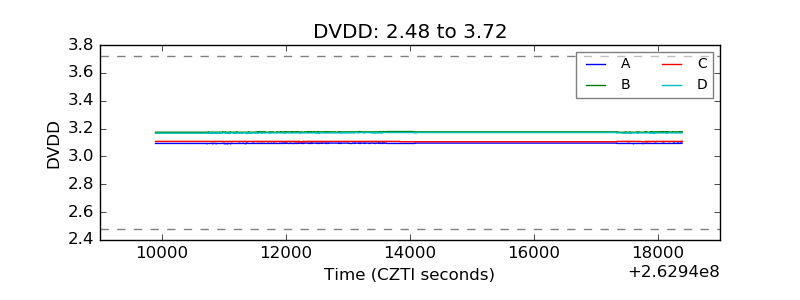 |
| Temperature 1 | 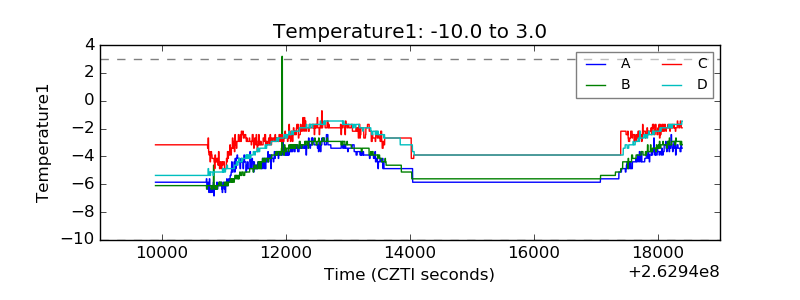 |
| Veto HV Monitor | 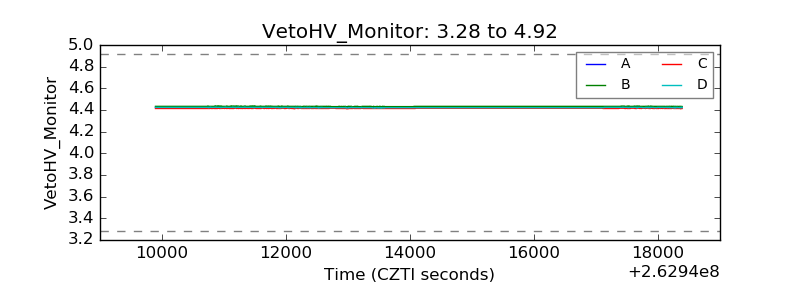 |
| Veto LLD | 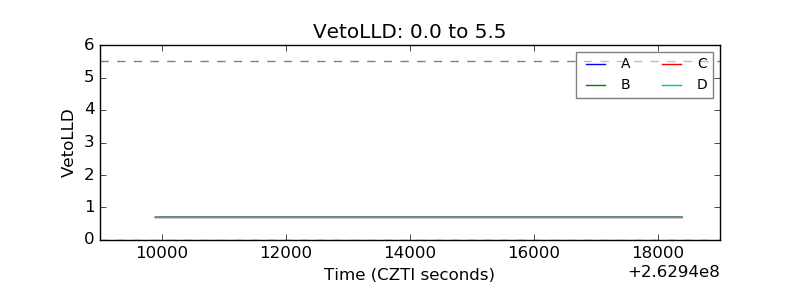 |
| Alpha Counter | 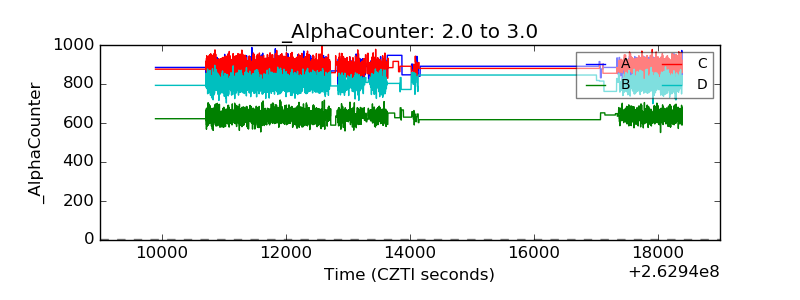 |
| _CPM_Rate | 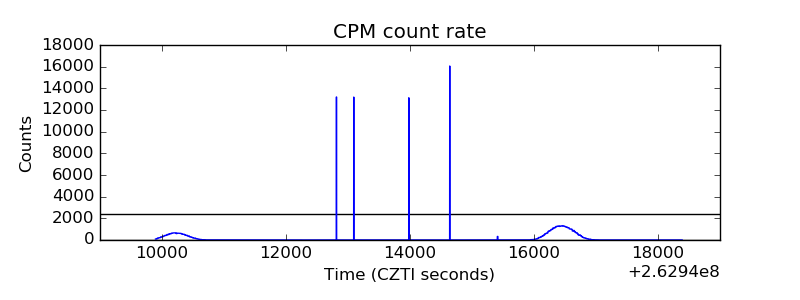 |
| CZT Counter | 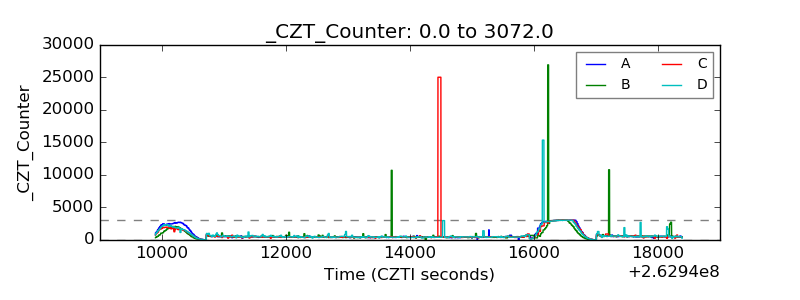 |
| +2.5 Volts monitor |  |
| +5 Volts monitor |  |
| _ROLL_ROT | 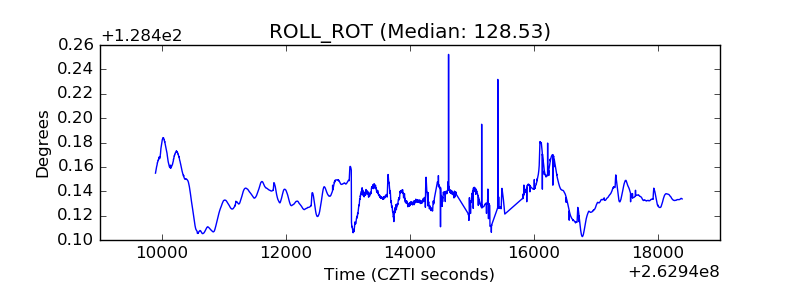 |
| _Roll_DEC | 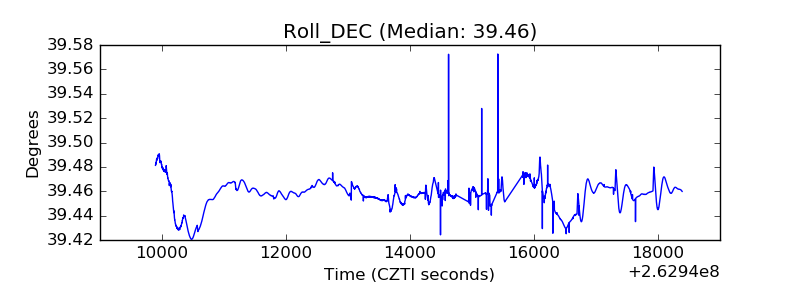 |
| _Roll_RA | 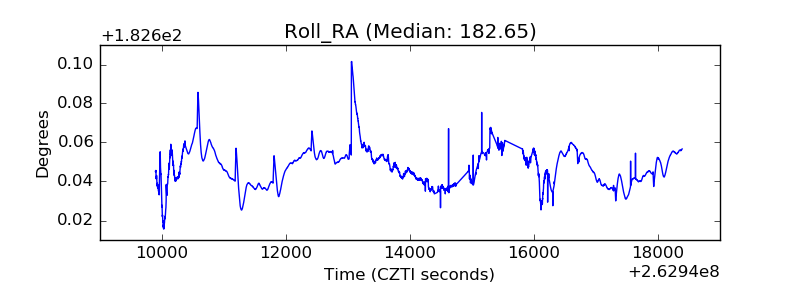 |
| Veto Counter |  |