| Param | Original file | Final file |
|---|---|---|
| Filename | modeM0/AS1G08_064T01_9000002070_14024cztM0_level2.evt | modeM0/AS1G08_064T01_9000002070_14024cztM0_level2_quad_clean.evt |
| Size (bytes) | 152,654,400 | 43,467,840 |
| Size | 145.6 MB | 41.5 MB |
| Events in quadrant A | 1,028,892 | 300,299 |
| Events in quadrant B | 1,042,259 | 299,241 |
| Events in quadrant C | 1,039,715 | 293,173 |
| Events in quadrant D | 1,373,808 | 277,918 |
| Mode M0 | |||
|---|---|---|---|
| Quadrant | BADHDUFLAG | Total packets | Discarded packets |
| A | 0 | 4282 | 0 |
| B | 0 | 4351 | 0 |
| C | 0 | 4227 | 0 |
| D | 0 | 5461 | 0 |
| Mode SS | |||
|---|---|---|---|
| Quadrant | BADHDUFLAG | Total packets | Discarded packets |
| A | 0 | 40 | 0 |
| B | 0 | 40 | 0 |
| C | 0 | 40 | 0 |
| D | 0 | 40 | 0 |
| Quadrant | Total seconds | Saturated seconds | Saturation percentage |
|---|---|---|---|
| A | 2001 | 1 | 0.049975% |
| B | 2001 | 3 | 0.149925% |
| C | 2001 | 2 | 0.099950% |
| D | 2001 | 47 | 2.348826% |
Noise dominated data is calculated using 1-second bins in cleaned event files. If a bin has >2000 counts, and if more than 50% of those come from <1% of pixels, then it is considered to be noise-dominated and hence unusable.
| Quadrant | # 1 sec bins | Bins with >0 counts | Bins with >2000 counts | High rate bins dominated by noise | Noise dominated (total time) | Noise dominated (detector-on time) | Marked lightcurve |
|---|---|---|---|---|---|---|---|
| A | 2002 | 2002 | 0 | 0 | 0.00% | 0.00% | 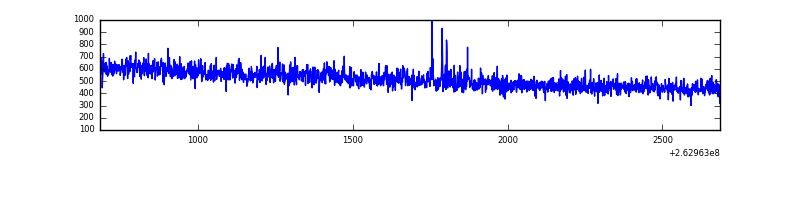 |
| B | 2002 | 2002 | 0 | 0 | 0.00% | 0.00% | 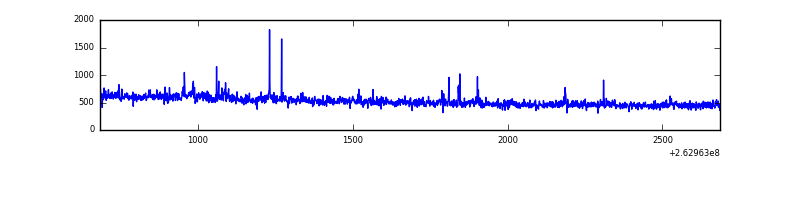 |
| C | 2002 | 2002 | 0 | 0 | 0.00% | 0.00% | 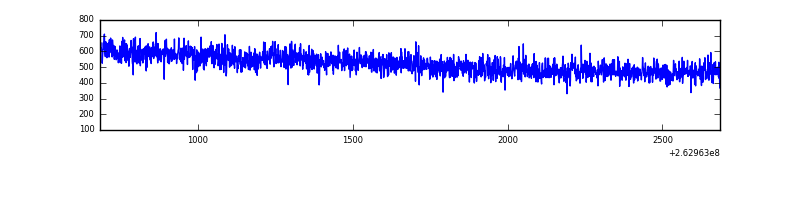 |
| D | 2002 | 2002 | 29 | 29 | 1.45% | 1.45% | 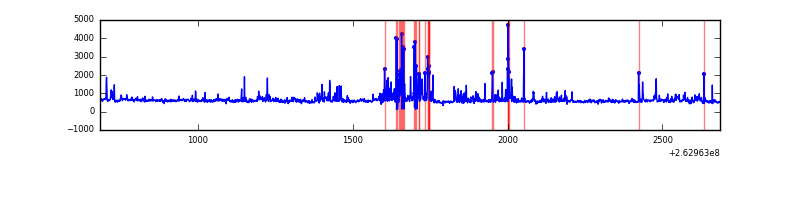 |
Top three noisy pixels from each quadrant. If the there are fewer than three noisy pixels in the level2.evt file, extra rows are filled as -1
| Pixel properties | Quadrant properties | ||||||
|---|---|---|---|---|---|---|---|
| Quadrant | DetID | PixID | Counts | Sigma | Mean | Median | Sigma |
| A | 12 | 189 | 10006 | 180.16 | 263 | 257 | 54.1 |
| A | 2 | 79 | 4160 | 72.13 | 263 | 257 | 54.1 |
| A | 0 | 226 | 2386 | 39.34 | 263 | 257 | 54.1 |
| B | 3 | 209 | 14071 | 278.82 | 256 | 251 | 49.6 |
| B | 0 | 189 | 12098 | 239.02 | 256 | 251 | 49.6 |
| B | 10 | 16 | 7948 | 155.29 | 256 | 251 | 49.6 |
| C | 3 | 233 | 48606 | 821.54 | 254 | 256 | 58.9 |
| C | 13 | 61 | 1836 | 26.85 | 254 | 256 | 58.9 |
| C | 3 | 203 | 635 | 6.44 | 254 | 256 | 58.9 |
| D | 10 | 157 | 134975 | 2055.48 | 252 | 247 | 65.5 |
| D | 8 | 195 | 125330 | 1908.33 | 252 | 247 | 65.5 |
| D | 13 | 189 | 85279 | 1297.29 | 252 | 247 | 65.5 |
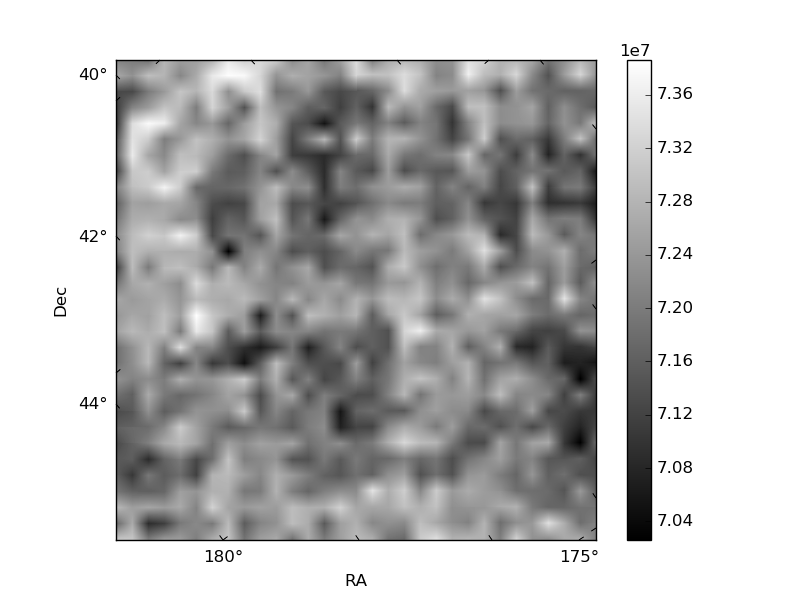
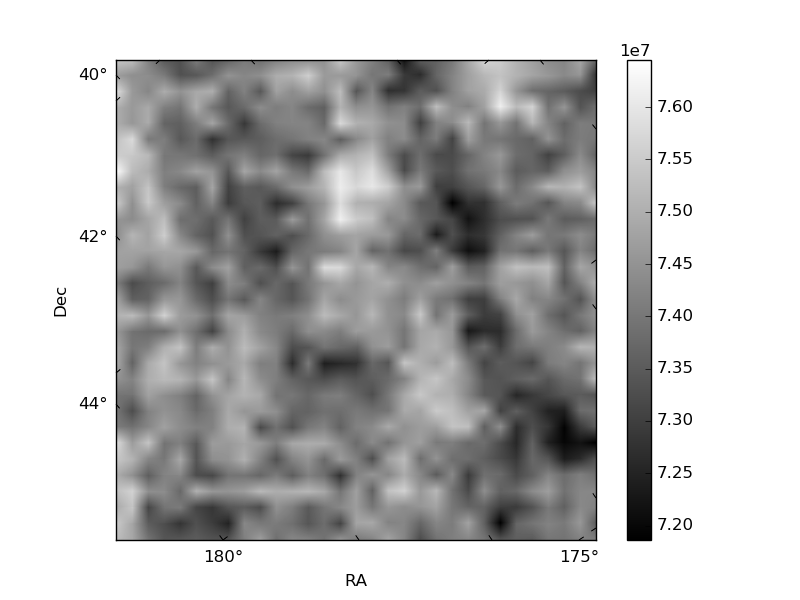
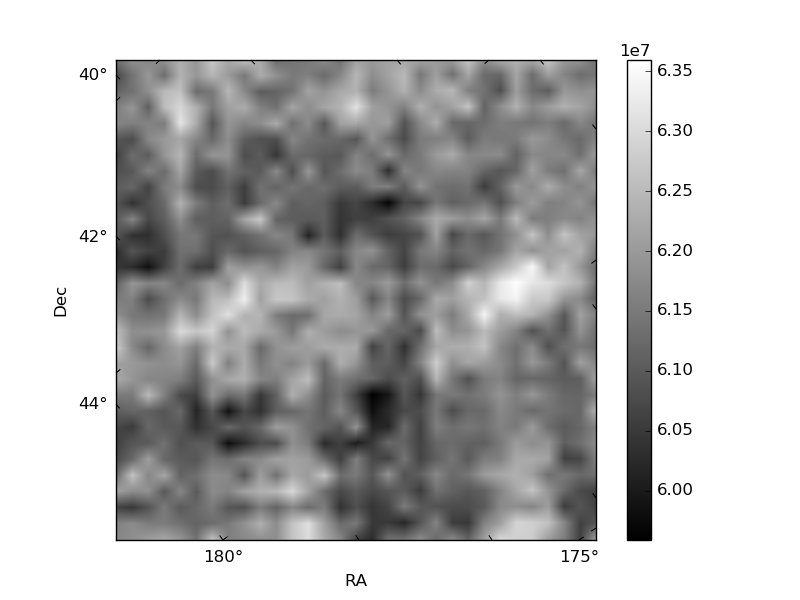
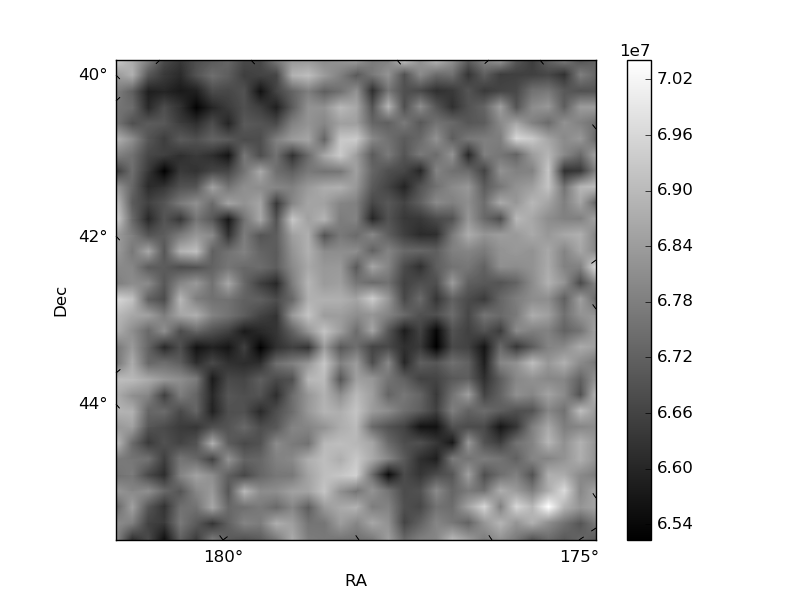
Histogram calculated using DETX and DETY for each event in the final _common_clean file
| Quadrant A | 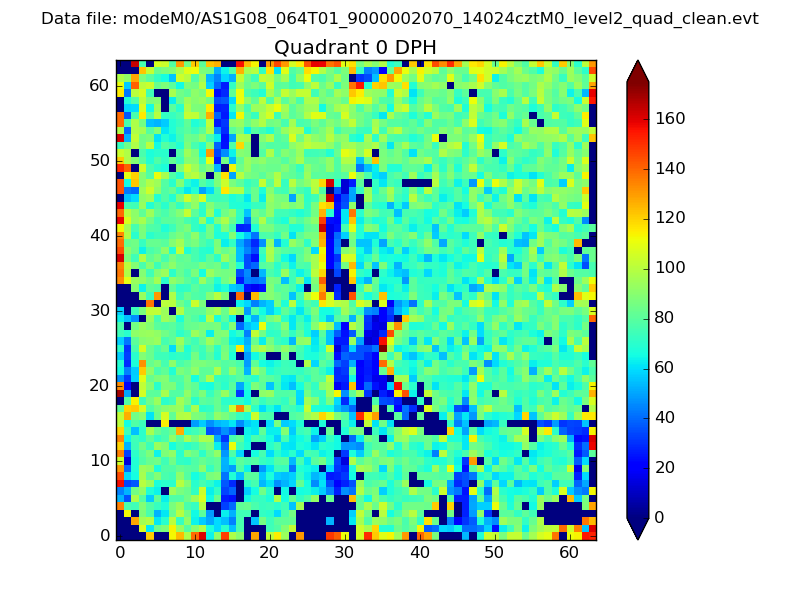 |
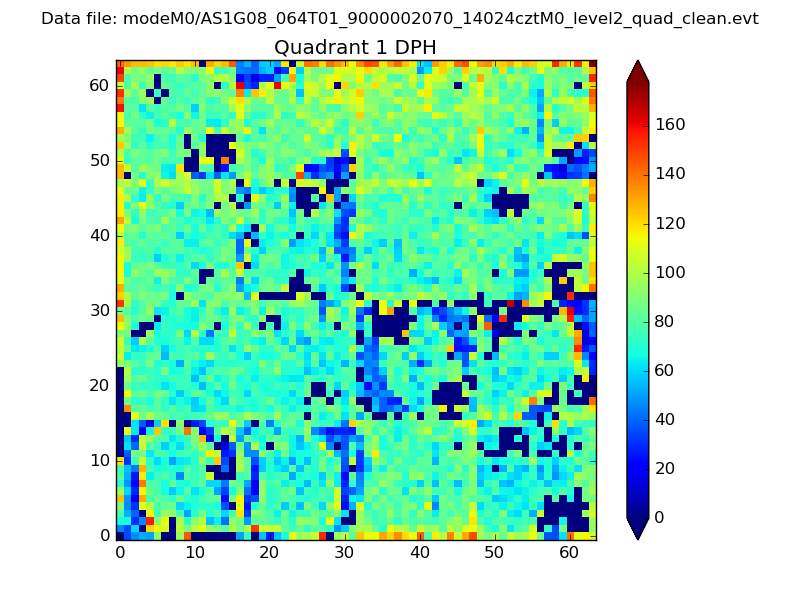 |
Quadrant B |
|---|---|---|---|
| Quadrant D | 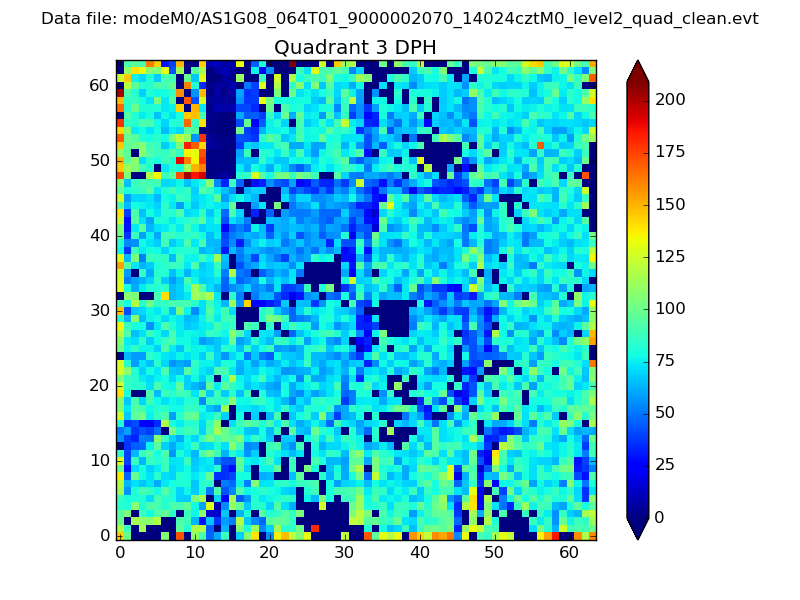 |
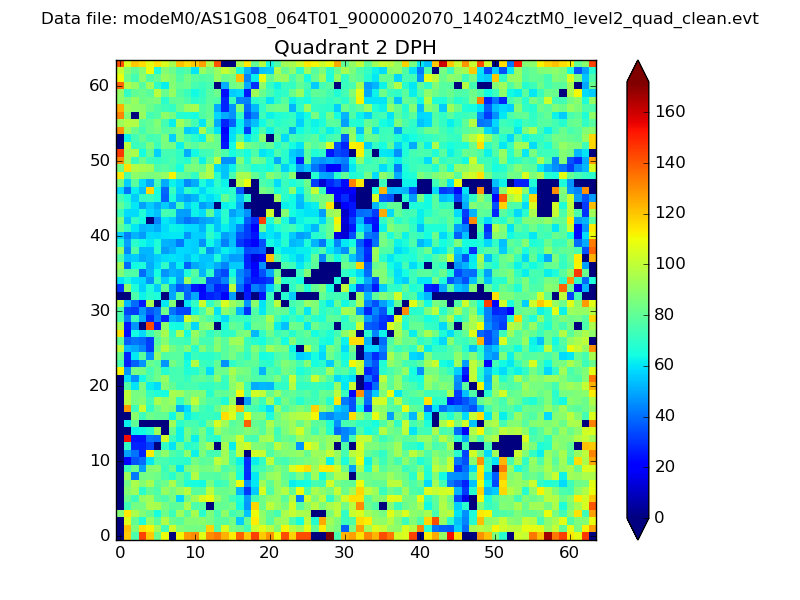 |
Quadrant C |
| Plot type | Count rate plots | Images |
|---|---|---|
| Comparison with Poisson distribution Blue bars denote a histogram of data divided into 1 sec bins. Red curve is a Poisson curve with rate = median count rate of data. |
 |
 |
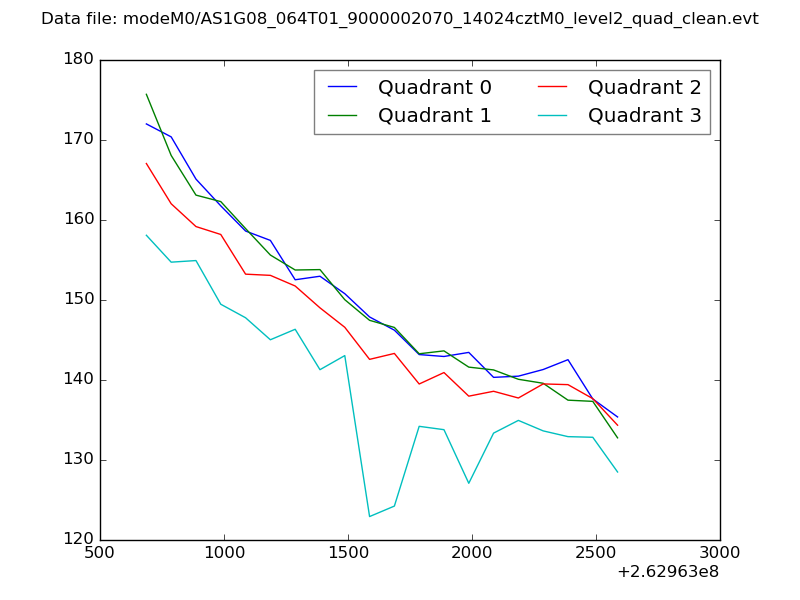
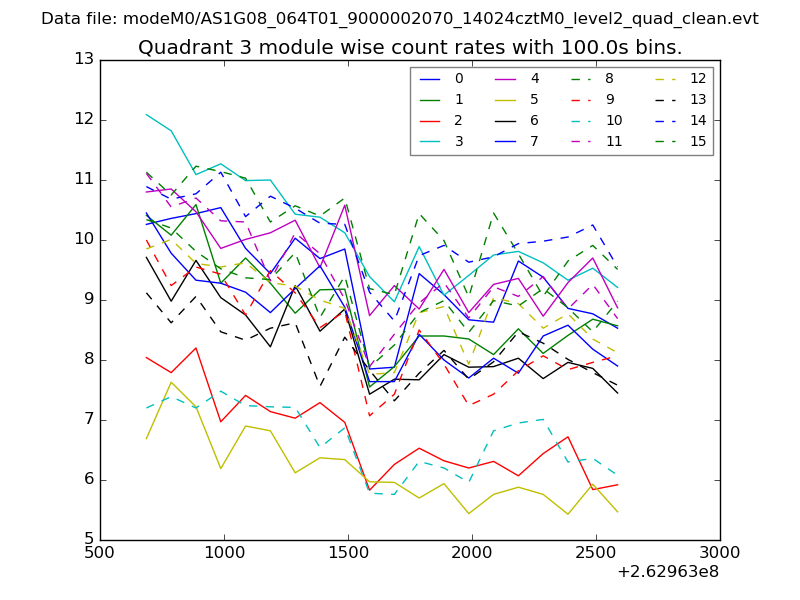
| Quadrant-wise count rates Data is divided into 100 sec bins |
 |
|
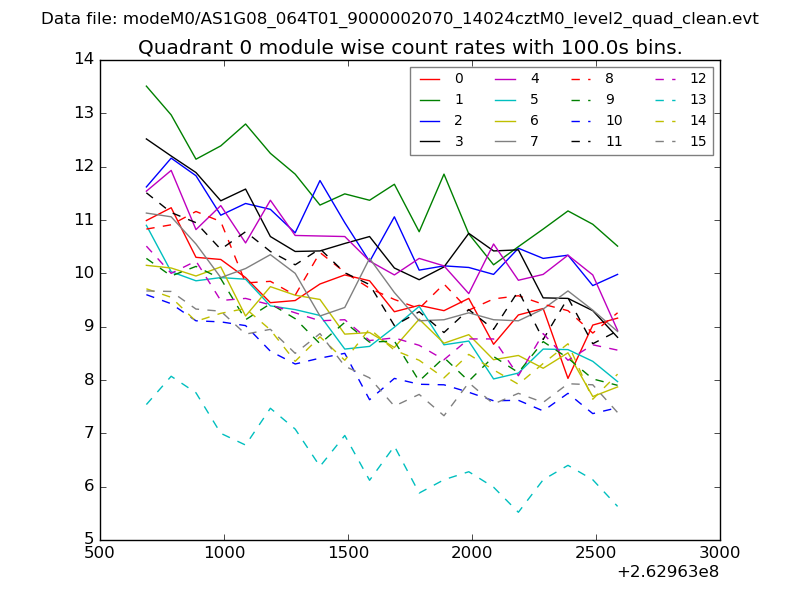
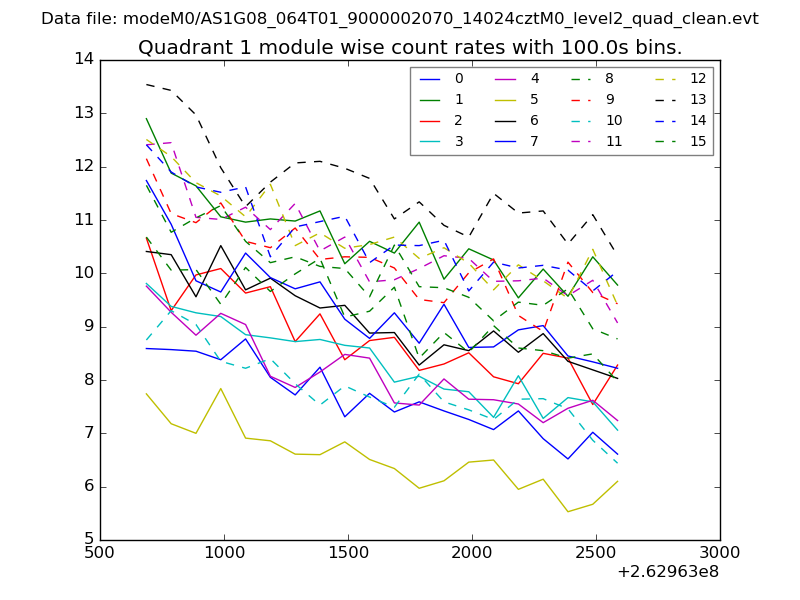
| Module-wise count rates for Quadrant A Data is divided into 100 sec bins |
 |
 |
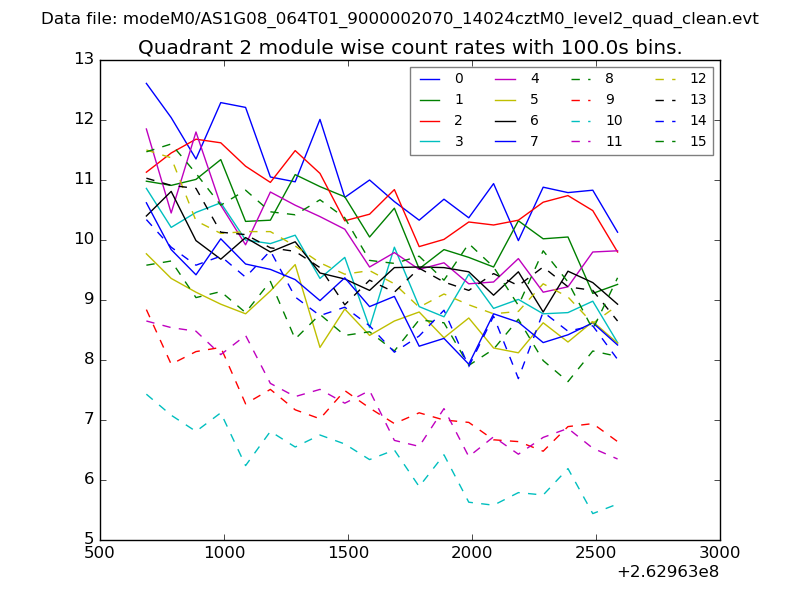
| Module-wise count rates for Quadrant B Data is divided into 100 sec bins |
 |
 |
| Module-wise count rates for Quadrant C Data is divided into 100 sec bins |
 |
 |
| Module-wise count rates for Quadrant D Data is divided into 100 sec bins |
 |
 |
| Parameter | Plot |
|---|---|
| CZT HV Monitor | 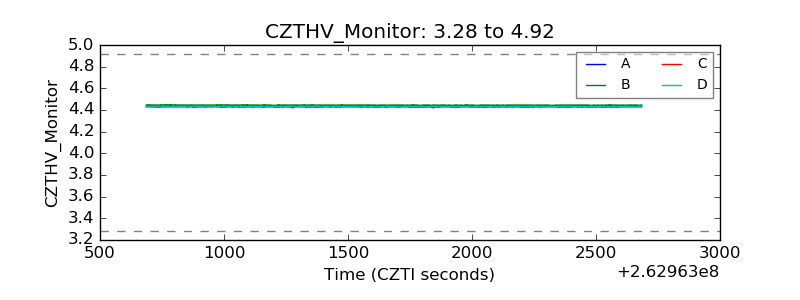 |
| D_VDD | 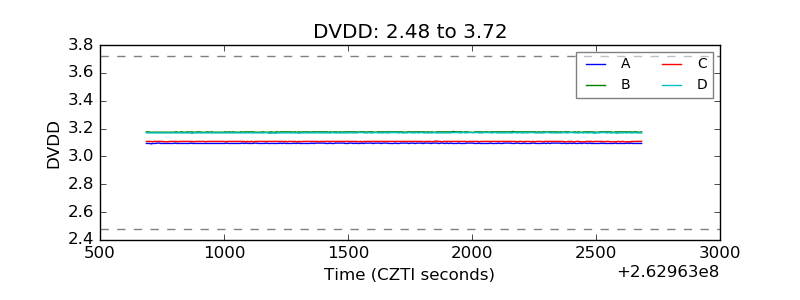 |
| Temperature 1 |  |
| Veto HV Monitor | 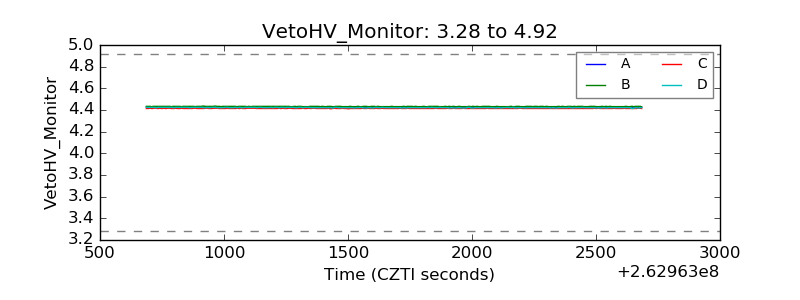 |
| Veto LLD | 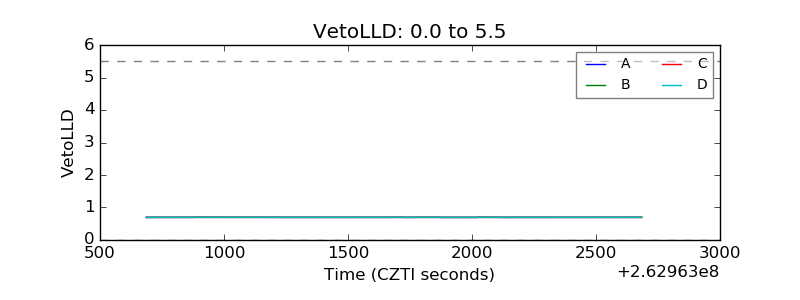 |
| Alpha Counter | 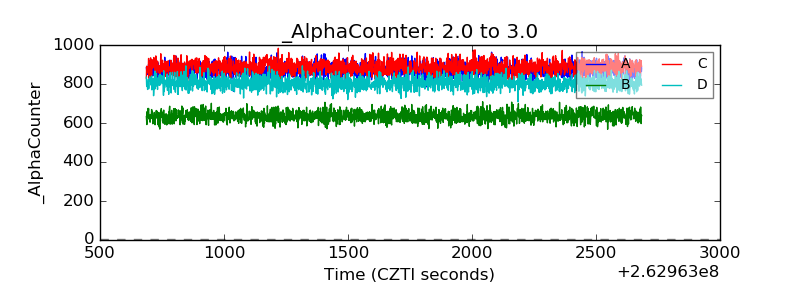 |
| _CPM_Rate | 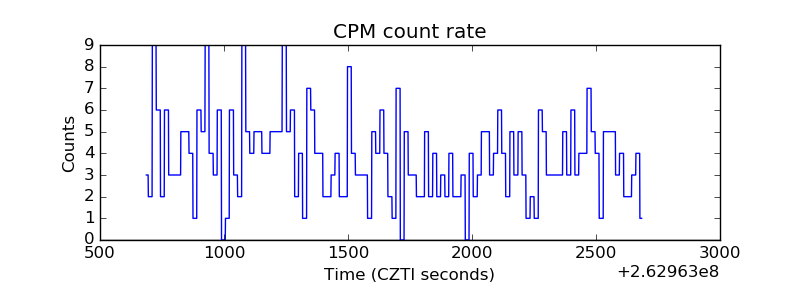 |
| CZT Counter | 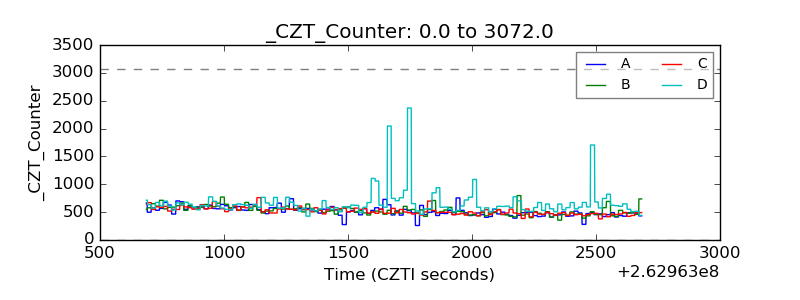 |
| +2.5 Volts monitor |  |
| +5 Volts monitor |  |
| _ROLL_ROT | 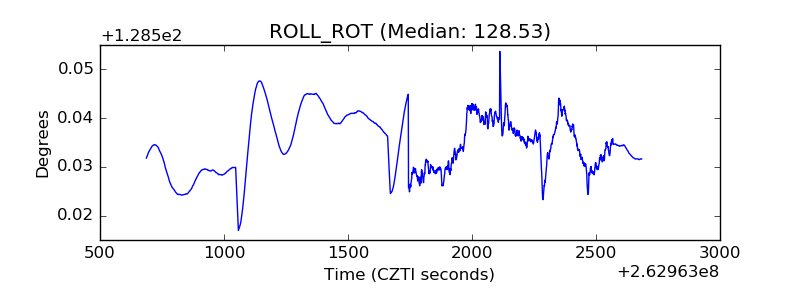 |
| _Roll_DEC | 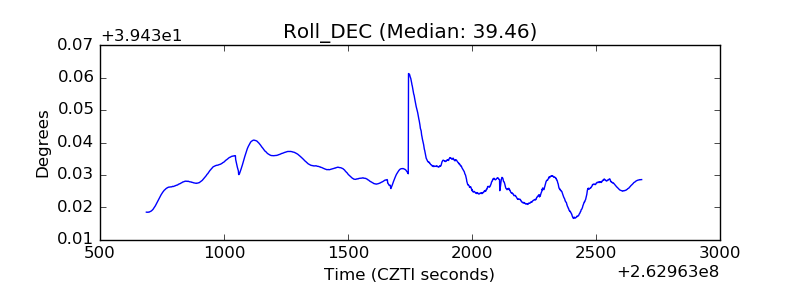 |
| _Roll_RA | 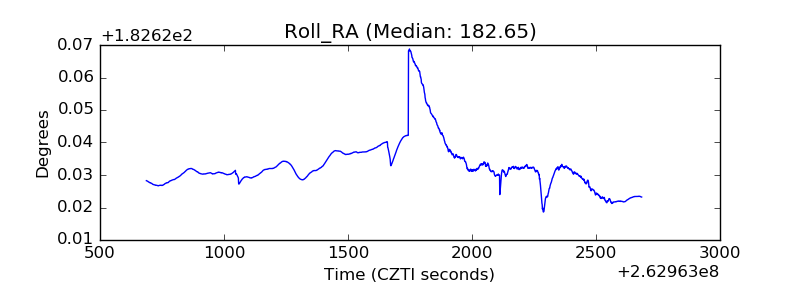 |
| Veto Counter | 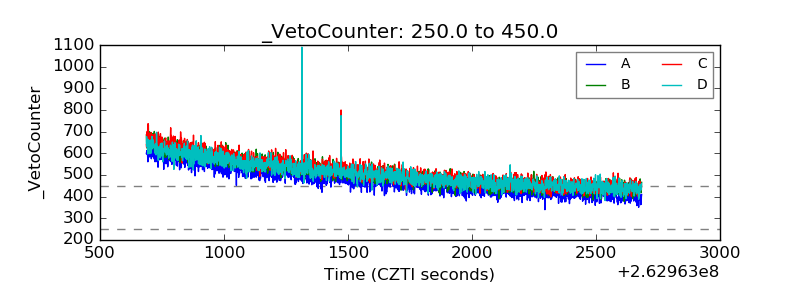 |