| Param | Original file | Final file |
|---|---|---|
| Filename | modeM0/AS1G08_002T01_9000002072_14024cztM0_level2.evt | modeM0/AS1G08_002T01_9000002072_14024cztM0_level2_quad_clean.evt |
| Size (bytes) | 263,171,520 | 56,373,120 |
| Size | 251.0 MB | 53.8 MB |
| Events in quadrant A | 1,860,845 | 369,532 |
| Events in quadrant B | 1,882,077 | 371,682 |
| Events in quadrant C | 1,849,480 | 368,614 |
| Events in quadrant D | 2,143,866 | 354,464 |
| Mode M9 | |||
|---|---|---|---|
| Quadrant | BADHDUFLAG | Total packets | Discarded packets |
| A | 0 | 13 | 0 |
| B | 0 | 13 | 0 |
| C | 0 | 13 | 0 |
| D | 0 | 13 | 0 |
| Mode SS | |||
|---|---|---|---|
| Quadrant | BADHDUFLAG | Total packets | Discarded packets |
| A | 0 | 70 | 0 |
| B | 0 | 70 | 0 |
| C | 0 | 70 | 0 |
| D | 0 | 70 | 0 |
| Mode M0 | |||
|---|---|---|---|
| Quadrant | BADHDUFLAG | Total packets | Discarded packets |
| A | 0 | 7762 | 2 |
| B | 0 | 7803 | 1 |
| C | 0 | 7676 | 1 |
| D | 0 | 8662 | 1 |
| Quadrant | Total seconds | Saturated seconds | Saturation percentage |
|---|---|---|---|
| A | 3424 | 75 | 2.190421% |
| B | 3424 | 85 | 2.482477% |
| C | 3424 | 68 | 1.985981% |
| D | 3424 | 69 | 2.015187% |
Noise dominated data is calculated using 1-second bins in cleaned event files. If a bin has >2000 counts, and if more than 50% of those come from <1% of pixels, then it is considered to be noise-dominated and hence unusable.
| Quadrant | # 1 sec bins | Bins with >0 counts | Bins with >2000 counts | High rate bins dominated by noise | Noise dominated (total time) | Noise dominated (detector-on time) | Marked lightcurve |
|---|---|---|---|---|---|---|---|
| A | 4715 | 3426 | 1 | 1 | 0.02% | 0.03% | 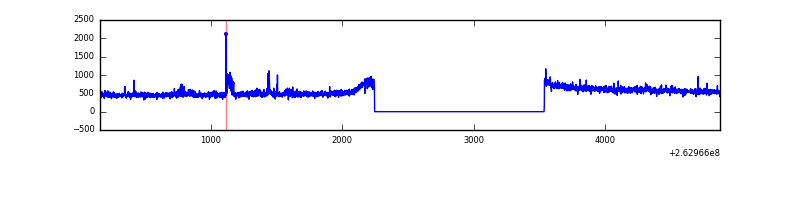 |
| B | 4715 | 3426 | 5 | 5 | 0.11% | 0.15% | 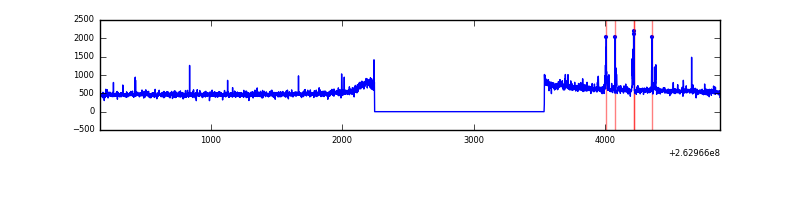 |
| C | 4715 | 3426 | 0 | 0 | 0.00% | 0.00% | 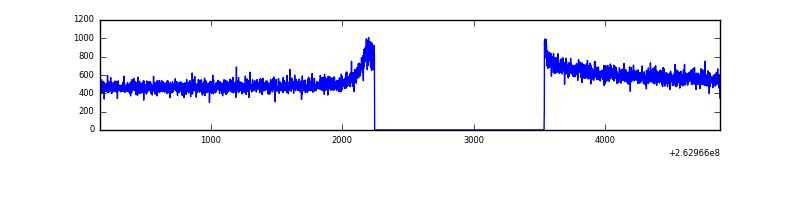 |
| D | 4715 | 3426 | 4 | 4 | 0.08% | 0.12% | 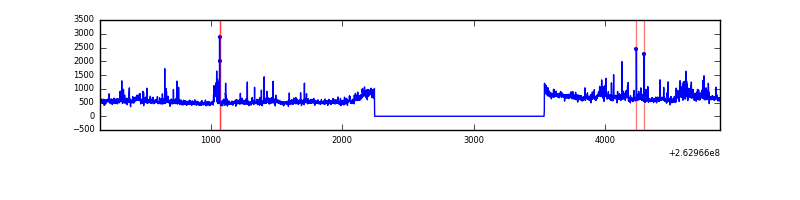 |
Top three noisy pixels from each quadrant. If the there are fewer than three noisy pixels in the level2.evt file, extra rows are filled as -1
| Pixel properties | Quadrant properties | ||||||
|---|---|---|---|---|---|---|---|
| Quadrant | DetID | PixID | Counts | Sigma | Mean | Median | Sigma |
| A | 12 | 189 | 28083 | 292.27 | 469 | 460 | 94.5 |
| A | 14 | 111 | 19488 | 201.33 | 469 | 460 | 94.5 |
| A | 1 | 162 | 5189 | 50.04 | 469 | 460 | 94.5 |
| B | 10 | 16 | 26918 | 297.98 | 462 | 451 | 88.8 |
| B | 4 | 173 | 20135 | 221.61 | 462 | 451 | 88.8 |
| B | 0 | 214 | 11598 | 125.5 | 462 | 451 | 88.8 |
| C | 3 | 233 | 69439 | 645.74 | 456 | 459 | 106.8 |
| C | 13 | 61 | 3204 | 25.7 | 456 | 459 | 106.8 |
| C | 3 | 202 | 1005 | 5.11 | 456 | 459 | 106.8 |
| D | 8 | 195 | 187732 | 1566.99 | 451 | 444 | 119.5 |
| D | 1 | 52 | 142879 | 1191.71 | 451 | 444 | 119.5 |
| D | 13 | 189 | 47861 | 396.72 | 451 | 444 | 119.5 |
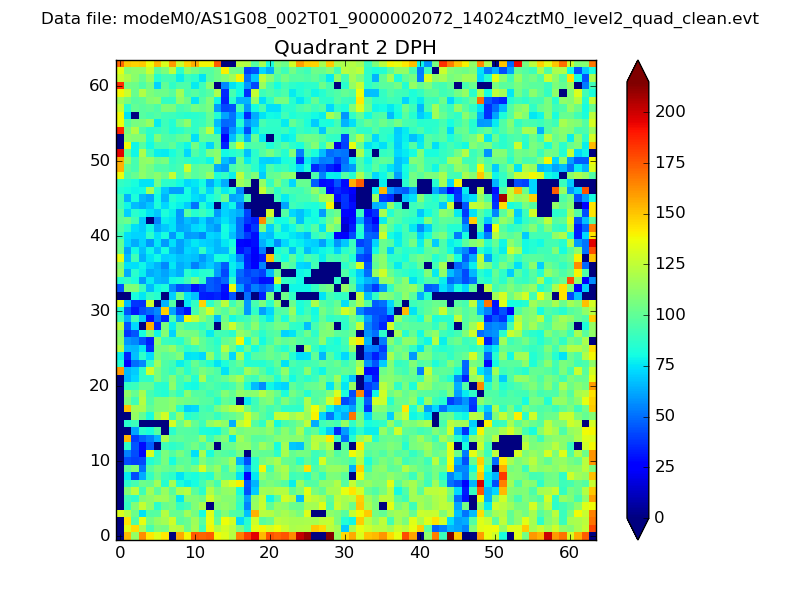
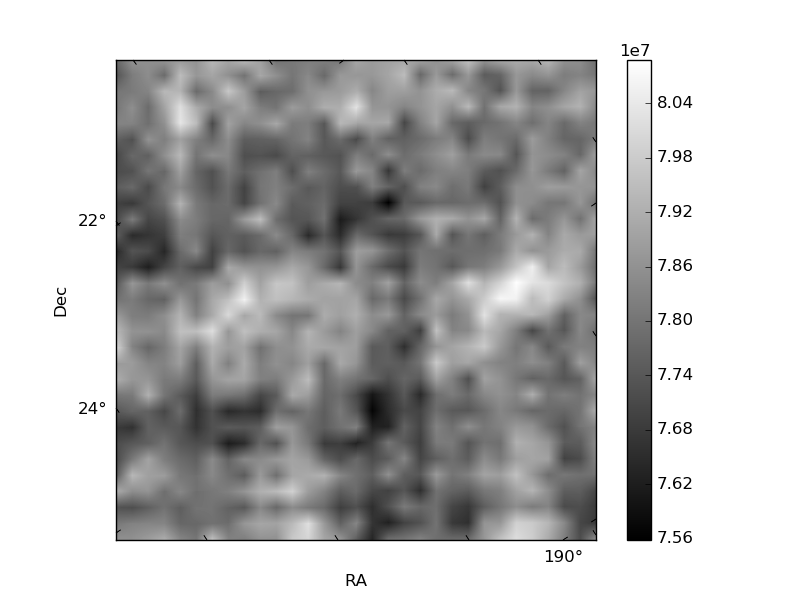
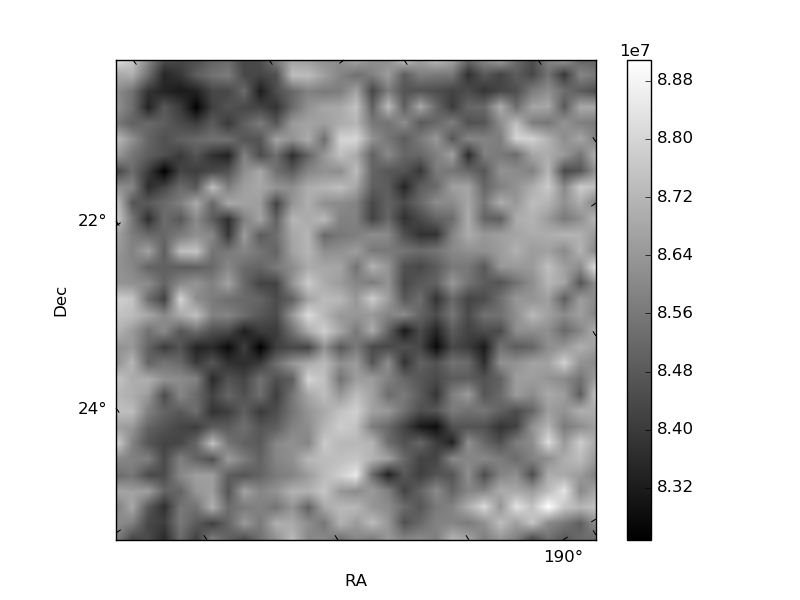
Histogram calculated using DETX and DETY for each event in the final _common_clean file
| Quadrant A |  |
 |
Quadrant B |
|---|---|---|---|
| Quadrant D | 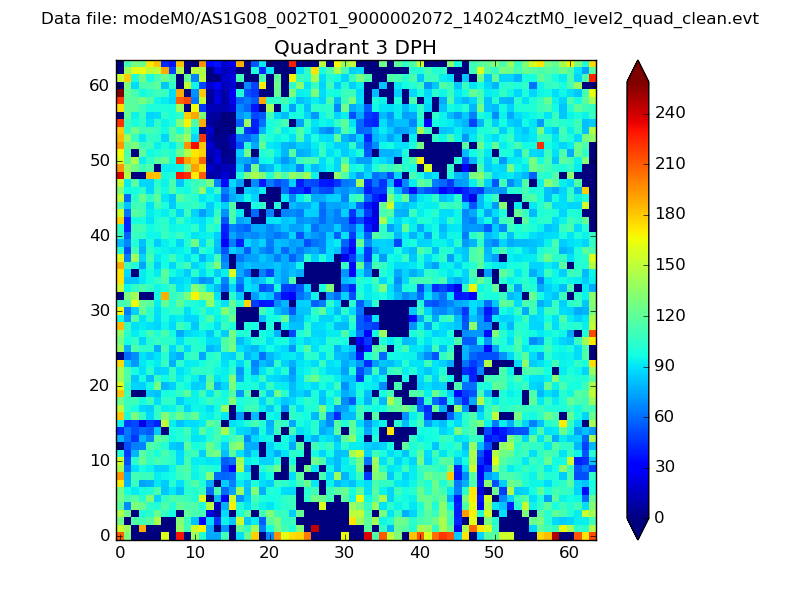 |
 |
Quadrant C |
| Plot type | Count rate plots | Images |
|---|---|---|
| Comparison with Poisson distribution Blue bars denote a histogram of data divided into 1 sec bins. Red curve is a Poisson curve with rate = median count rate of data. |
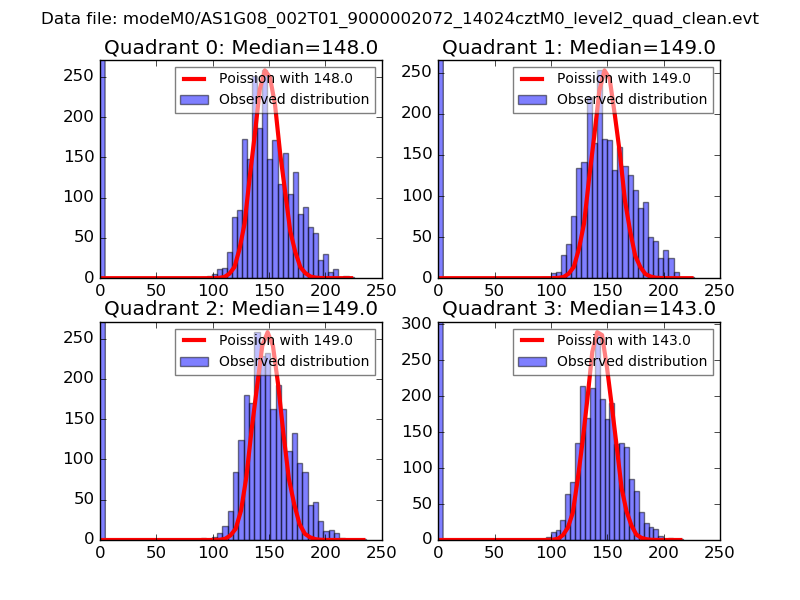 |
 |
| Quadrant-wise count rates Data is divided into 100 sec bins |
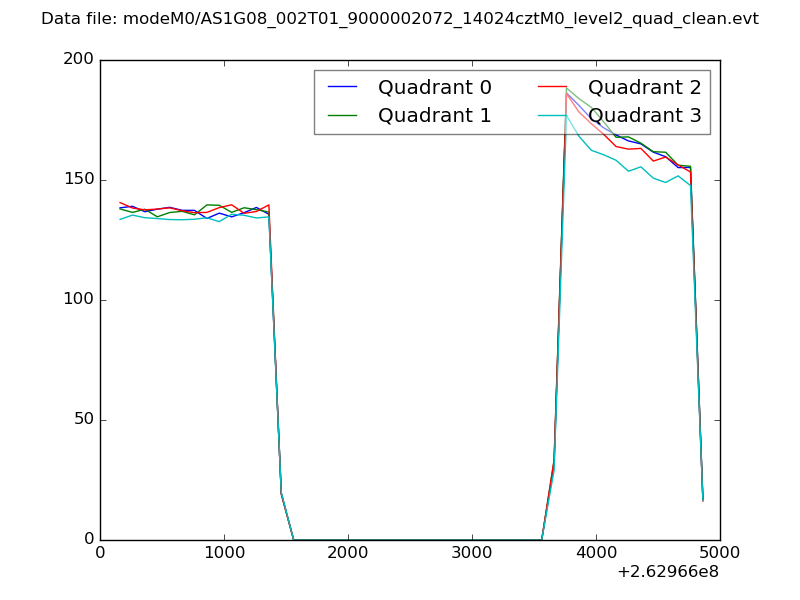 |
|
| Module-wise count rates for Quadrant A Data is divided into 100 sec bins |
 |
 |
| Module-wise count rates for Quadrant B Data is divided into 100 sec bins |
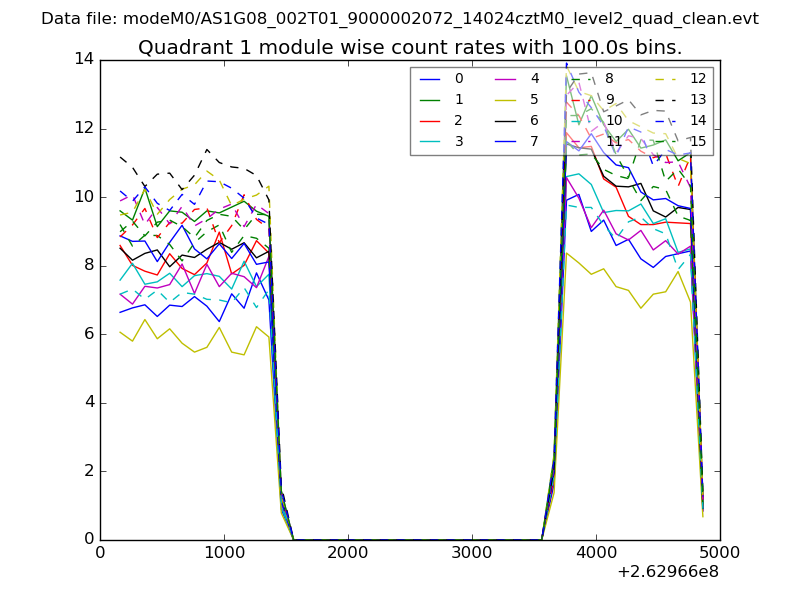 |
 |
| Module-wise count rates for Quadrant C Data is divided into 100 sec bins |
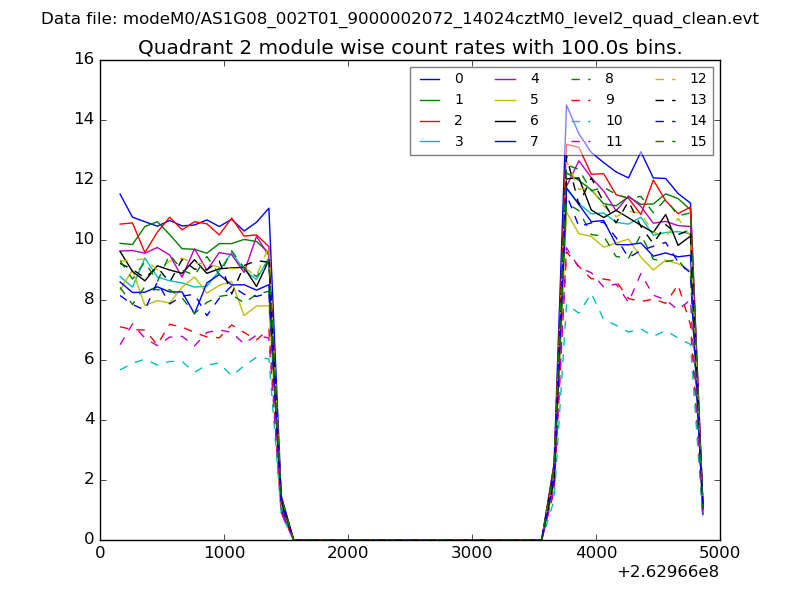 |
 |
| Module-wise count rates for Quadrant D Data is divided into 100 sec bins |
 |
 |
| Parameter | Plot |
|---|---|
| CZT HV Monitor | 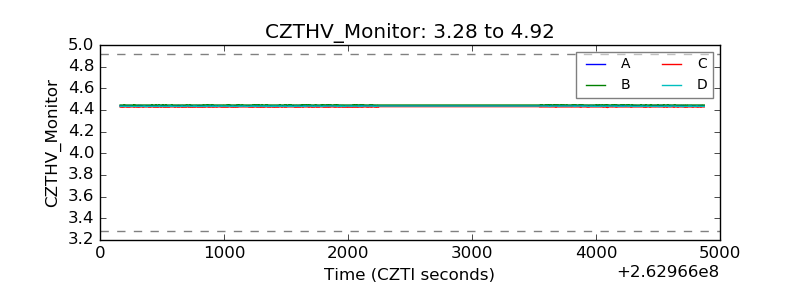 |
| D_VDD | 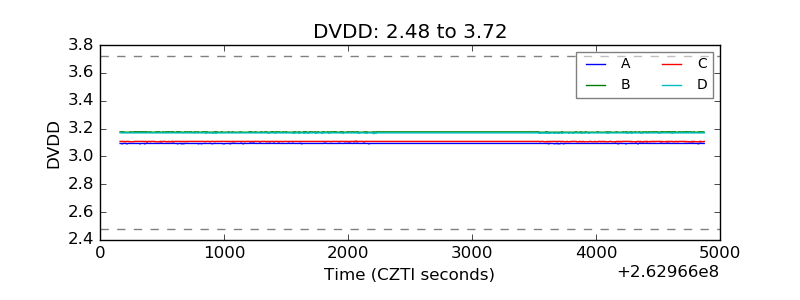 |
| Temperature 1 | 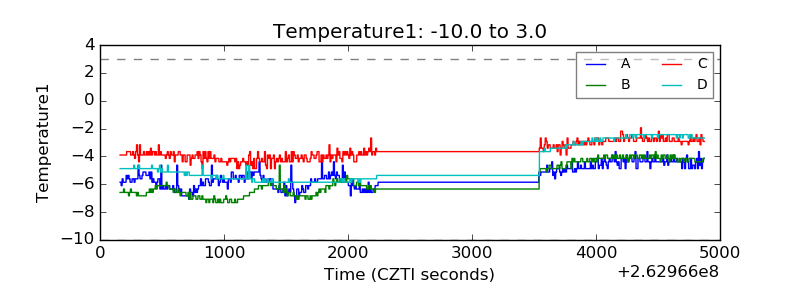 |
| Veto HV Monitor | 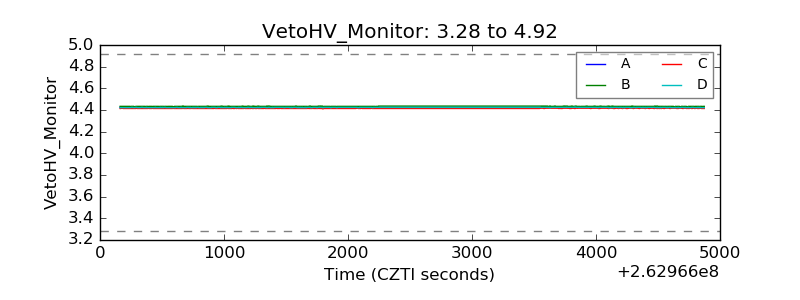 |
| Veto LLD | 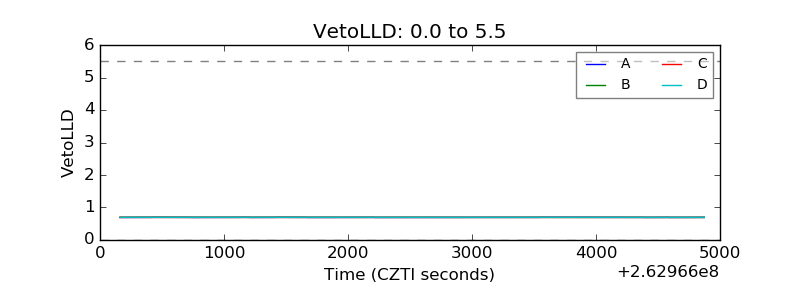 |
| Alpha Counter | 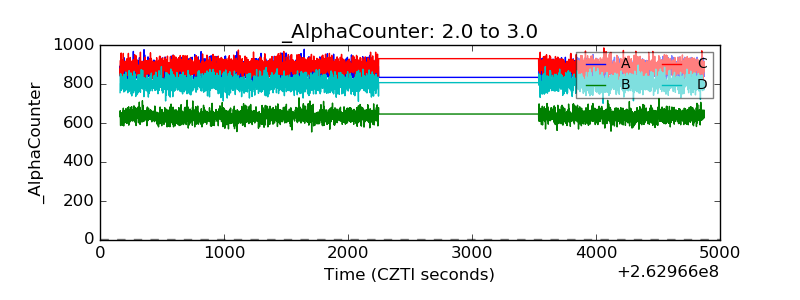 |
| _CPM_Rate | 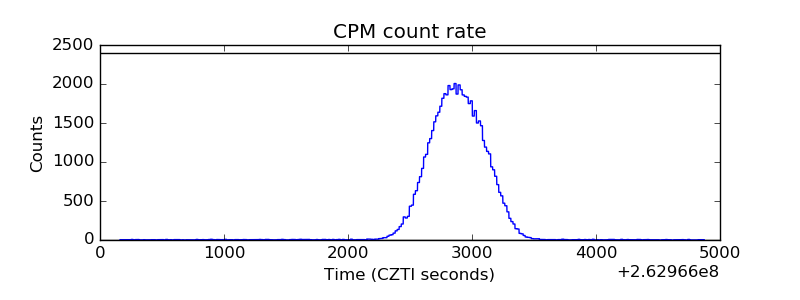 |
| CZT Counter | 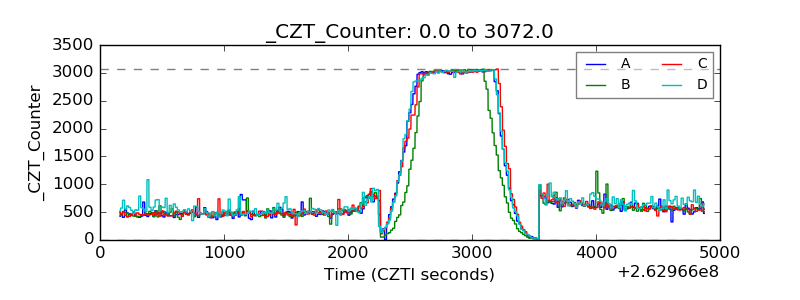 |
| +2.5 Volts monitor | 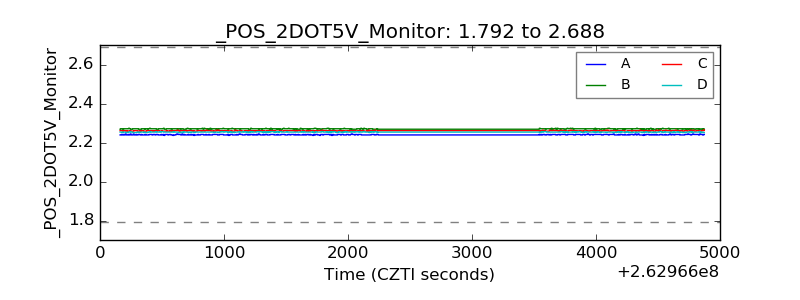 |
| +5 Volts monitor | 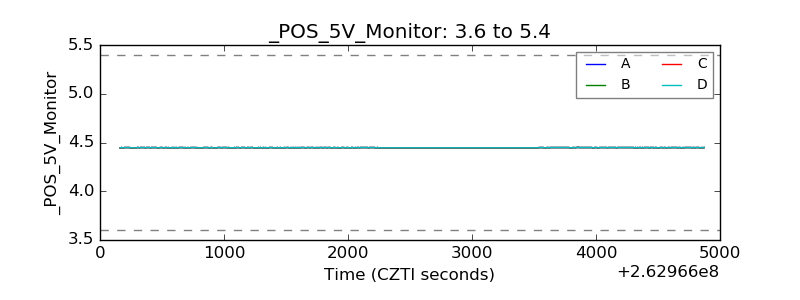 |
| _ROLL_ROT | 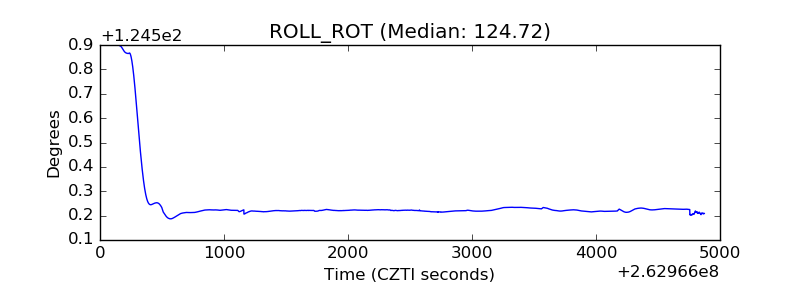 |
| _Roll_DEC | 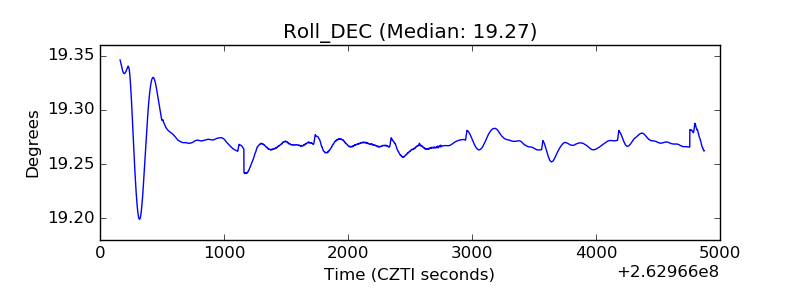 |
| _Roll_RA | 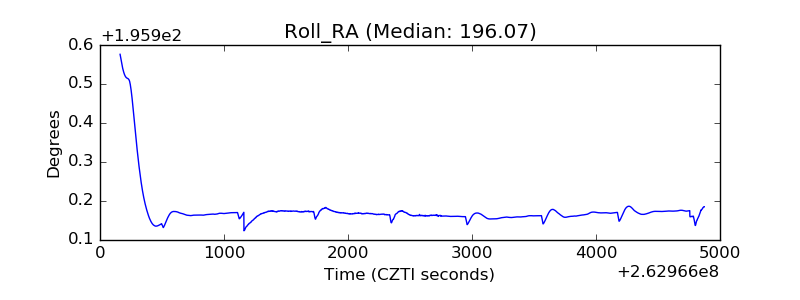 |
| Veto Counter | 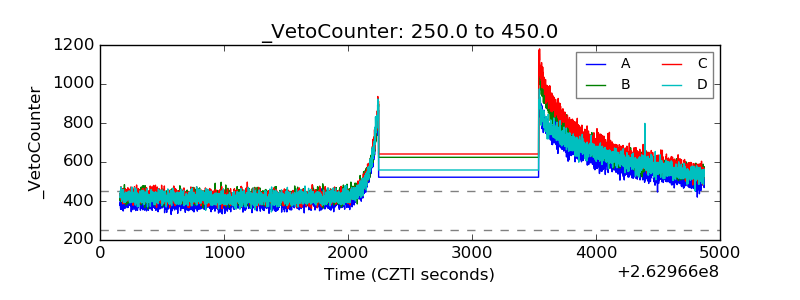 |