| Param | Original file | Final file |
|---|---|---|
| Filename | modeM0/AS1G08_002T01_9000002072_14025cztM0_level2.evt | modeM0/AS1G08_002T01_9000002072_14025cztM0_level2_quad_clean.evt |
| Size (bytes) | 484,295,040 | 113,189,760 |
| Size | 461.9 MB | 107.9 MB |
| Events in quadrant A | 3,256,736 | 759,067 |
| Events in quadrant B | 3,520,563 | 762,616 |
| Events in quadrant C | 3,273,170 | 760,689 |
| Events in quadrant D | 4,206,454 | 723,740 |
| Mode M9 | |||
|---|---|---|---|
| Quadrant | BADHDUFLAG | Total packets | Discarded packets |
| A | 0 | 13 | 0 |
| B | 0 | 13 | 0 |
| C | 0 | 13 | 0 |
| D | 0 | 13 | 0 |
| Mode SS | |||
|---|---|---|---|
| Quadrant | BADHDUFLAG | Total packets | Discarded packets |
| A | 0 | 122 | 0 |
| B | 0 | 122 | 0 |
| C | 0 | 122 | 0 |
| D | 0 | 122 | 0 |
| Mode M0 | |||
|---|---|---|---|
| Quadrant | BADHDUFLAG | Total packets | Discarded packets |
| A | 0 | 13445 | 2 |
| B | 0 | 14346 | 1 |
| C | 0 | 13414 | 1 |
| D | 0 | 16768 | 1 |
| Quadrant | Total seconds | Saturated seconds | Saturation percentage |
|---|---|---|---|
| A | 6048 | 104 | 1.719577% |
| B | 6048 | 146 | 2.414021% |
| C | 6048 | 102 | 1.686508% |
| D | 6048 | 162 | 2.678571% |
Noise dominated data is calculated using 1-second bins in cleaned event files. If a bin has >2000 counts, and if more than 50% of those come from <1% of pixels, then it is considered to be noise-dominated and hence unusable.
| Quadrant | # 1 sec bins | Bins with >0 counts | Bins with >2000 counts | High rate bins dominated by noise | Noise dominated (total time) | Noise dominated (detector-on time) | Marked lightcurve |
|---|---|---|---|---|---|---|---|
| A | 7354 | 6050 | 0 | 0 | 0.00% | 0.00% | 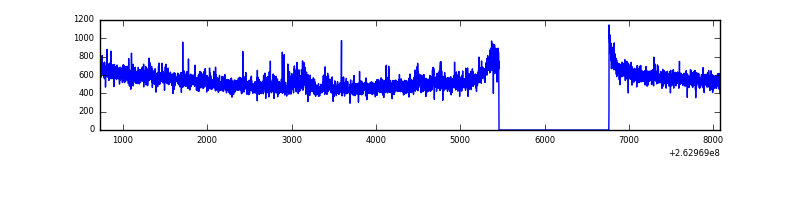 |
| B | 7354 | 6050 | 27 | 27 | 0.37% | 0.45% | 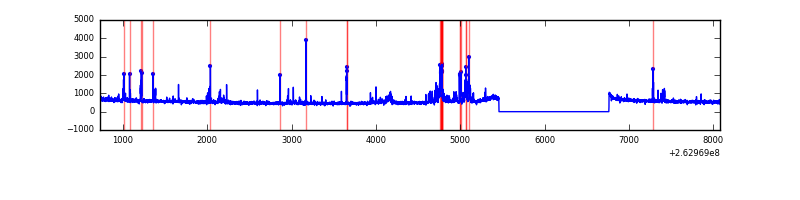 |
| C | 7354 | 6050 | 0 | 0 | 0.00% | 0.00% | 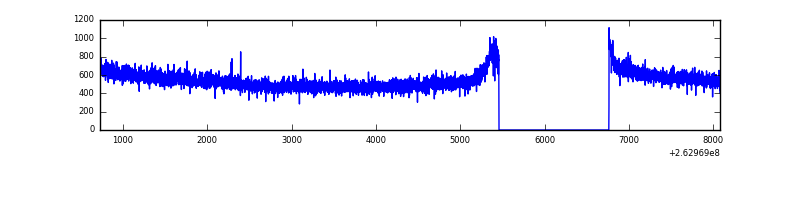 |
| D | 7354 | 6050 | 60 | 60 | 0.82% | 0.99% | 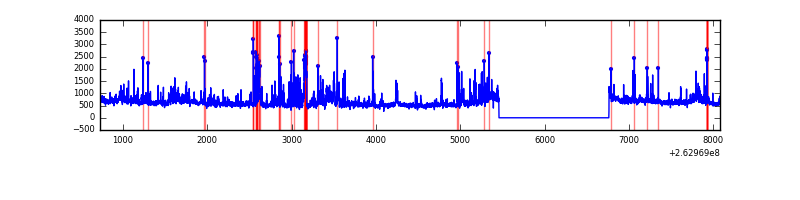 |
Top three noisy pixels from each quadrant. If the there are fewer than three noisy pixels in the level2.evt file, extra rows are filled as -1
| Pixel properties | Quadrant properties | ||||||
|---|---|---|---|---|---|---|---|
| Quadrant | DetID | PixID | Counts | Sigma | Mean | Median | Sigma |
| A | 12 | 189 | 55649 | 332.0 | 823 | 808 | 165.2 |
| A | 1 | 162 | 17309 | 99.89 | 823 | 808 | 165.2 |
| A | 8 | 15 | 8539 | 46.8 | 823 | 808 | 165.2 |
| B | 10 | 16 | 280024 | 1842.81 | 807 | 787 | 151.5 |
| B | 4 | 173 | 44630 | 289.34 | 807 | 787 | 151.5 |
| B | 12 | 111 | 17390 | 109.57 | 807 | 787 | 151.5 |
| C | 3 | 233 | 127913 | 684.2 | 806 | 813 | 185.8 |
| C | 13 | 61 | 5726 | 26.45 | 806 | 813 | 185.8 |
| C | 12 | 4 | 2663 | 9.96 | 806 | 813 | 185.8 |
| D | 1 | 52 | 455653 | 2167.12 | 795 | 784 | 209.9 |
| D | 8 | 195 | 291705 | 1386.02 | 795 | 784 | 209.9 |
| D | 10 | 157 | 150013 | 710.97 | 795 | 784 | 209.9 |
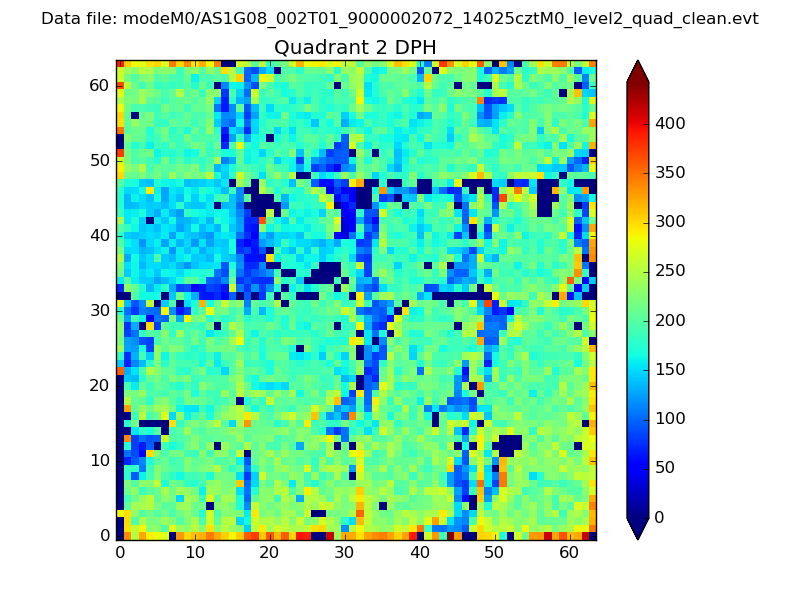
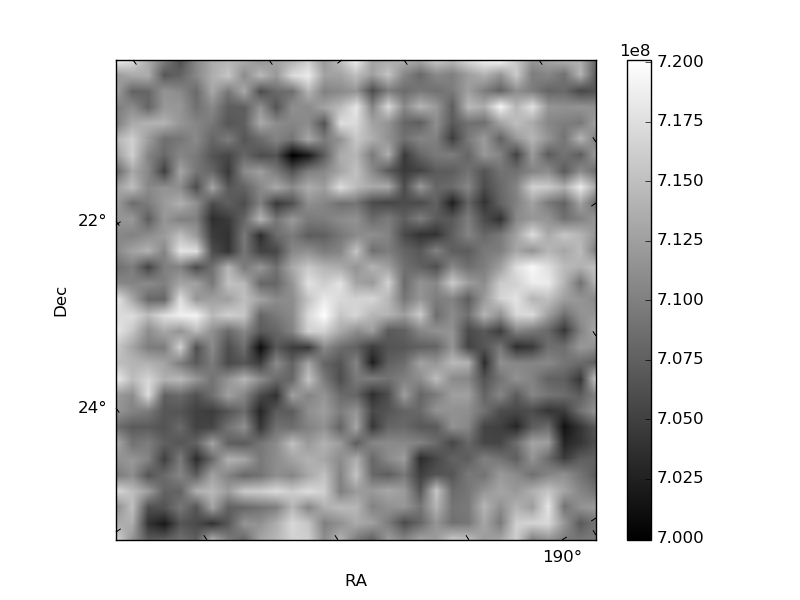
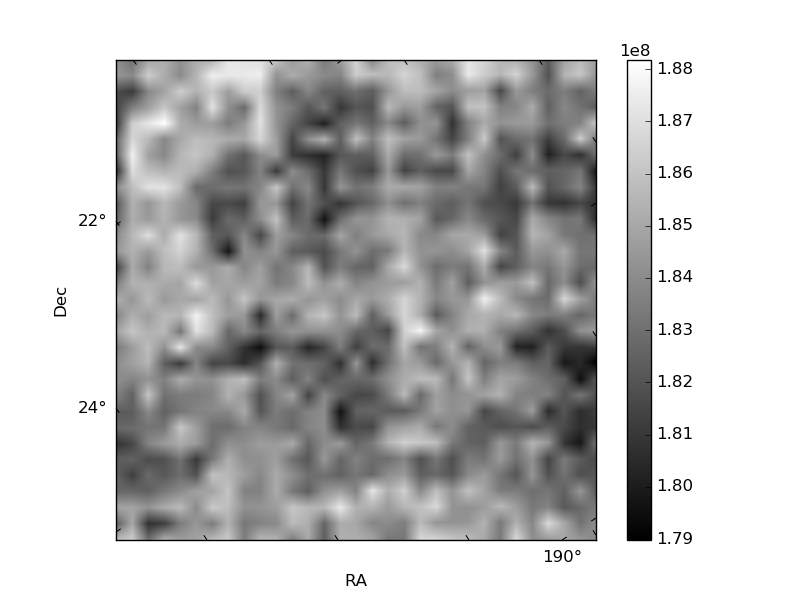
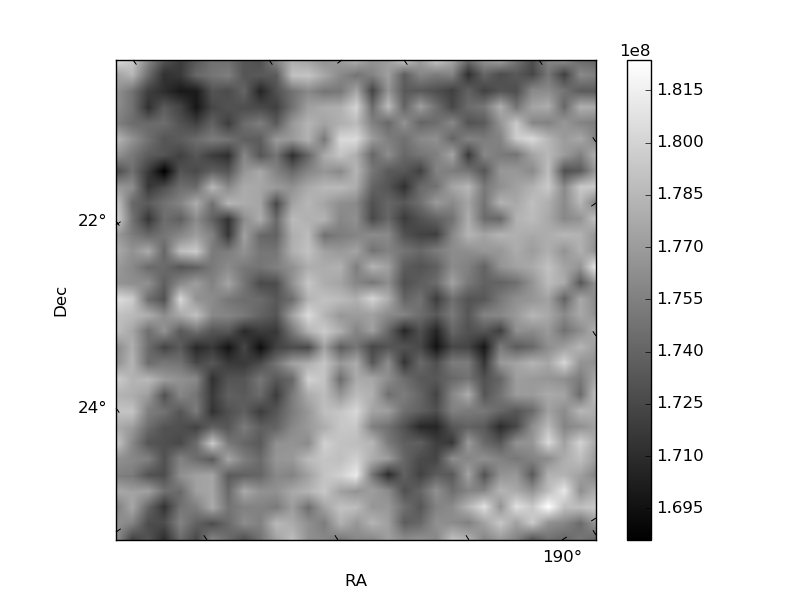
Histogram calculated using DETX and DETY for each event in the final _common_clean file
| Quadrant A | 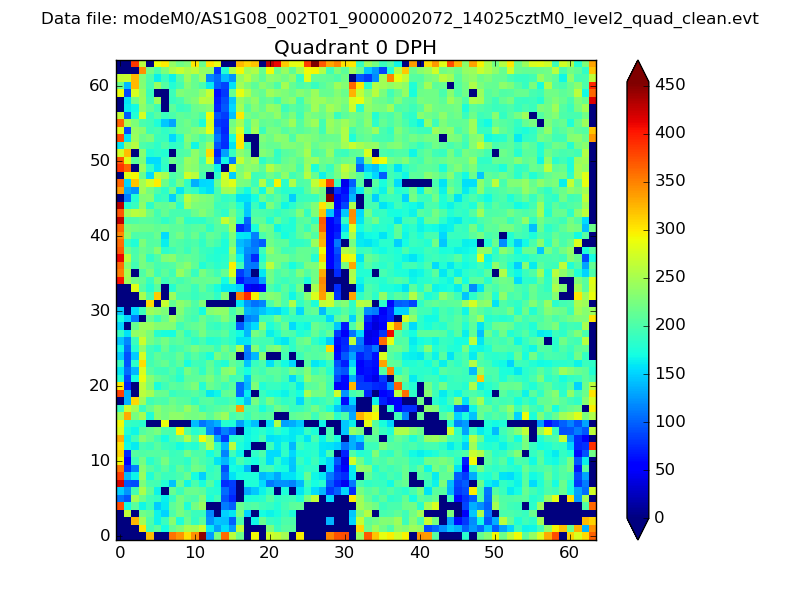 |
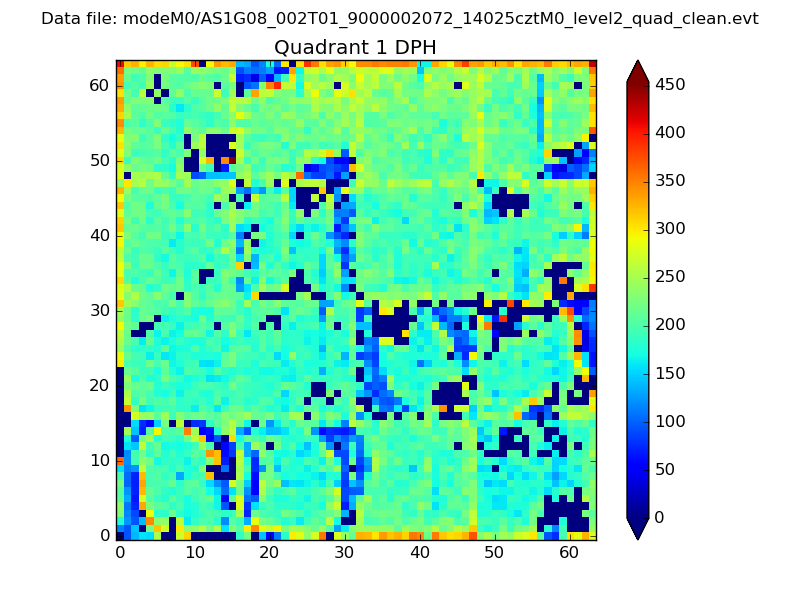 |
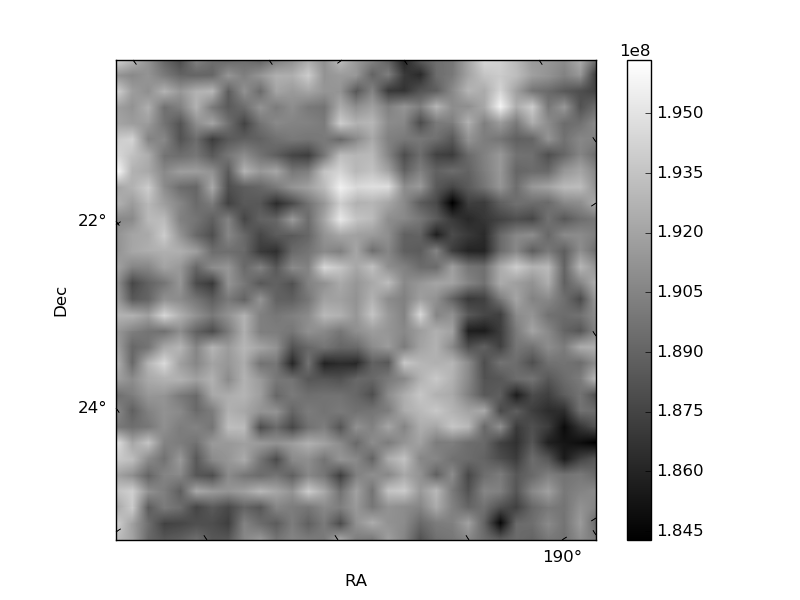
Quadrant B |
|---|---|---|---|
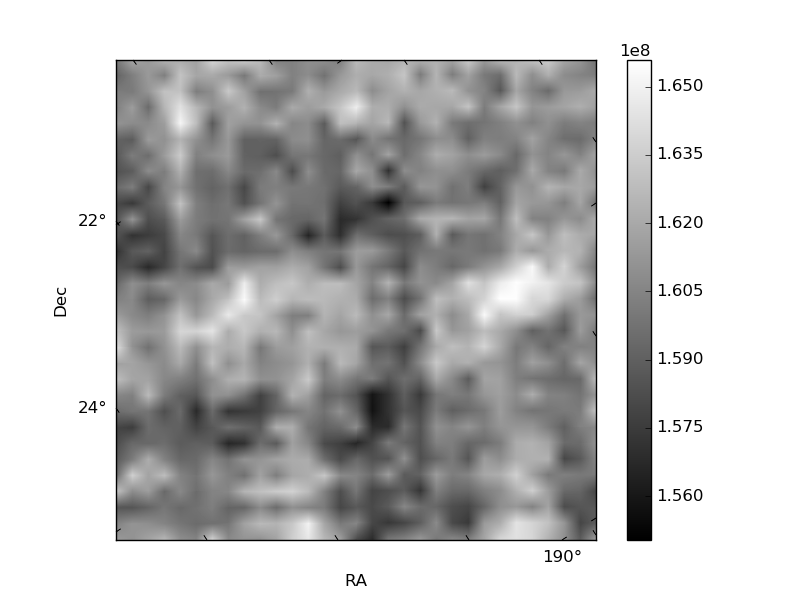
| Quadrant D | 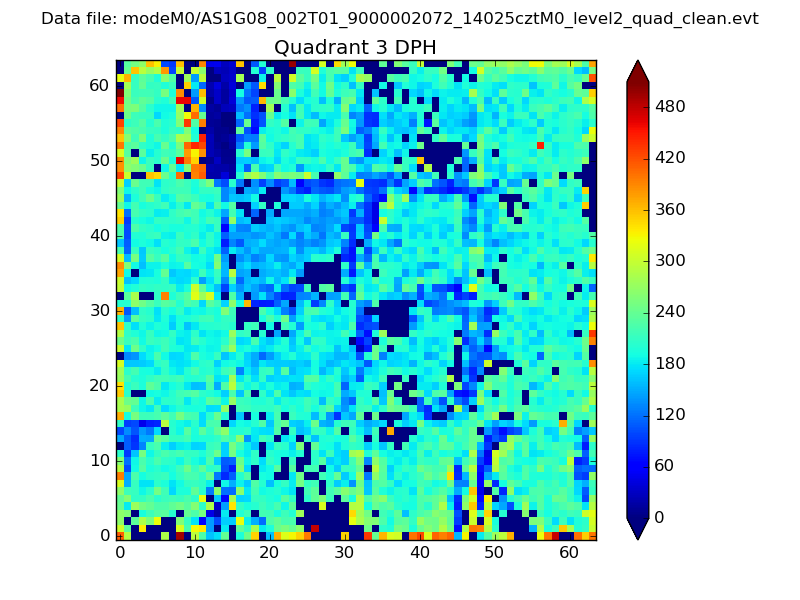 |
 |
Quadrant C |
| Plot type | Count rate plots | Images |
|---|---|---|
| Comparison with Poisson distribution Blue bars denote a histogram of data divided into 1 sec bins. Red curve is a Poisson curve with rate = median count rate of data. |
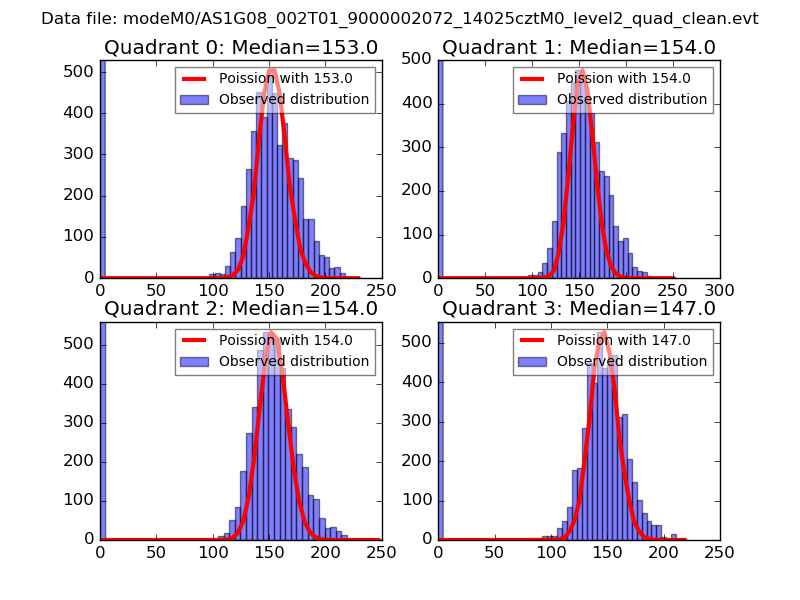 |
 |
| Quadrant-wise count rates Data is divided into 100 sec bins |
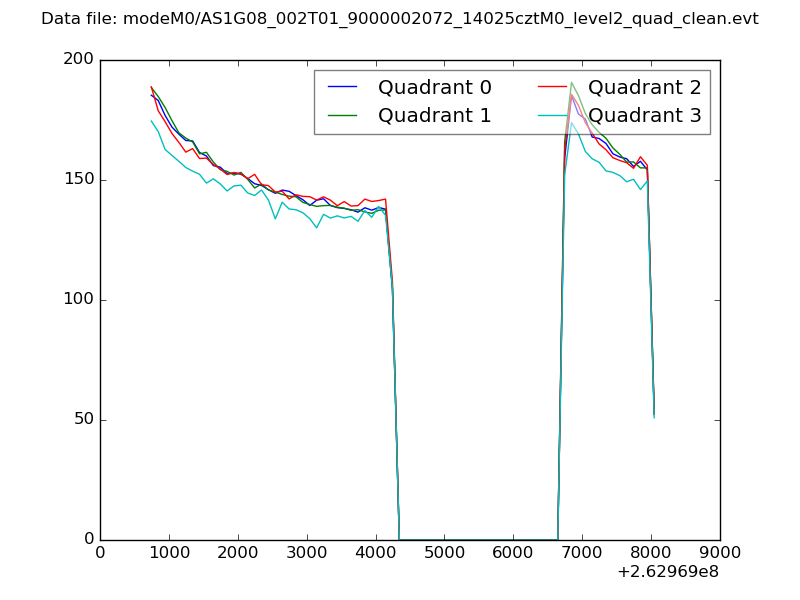 |
|
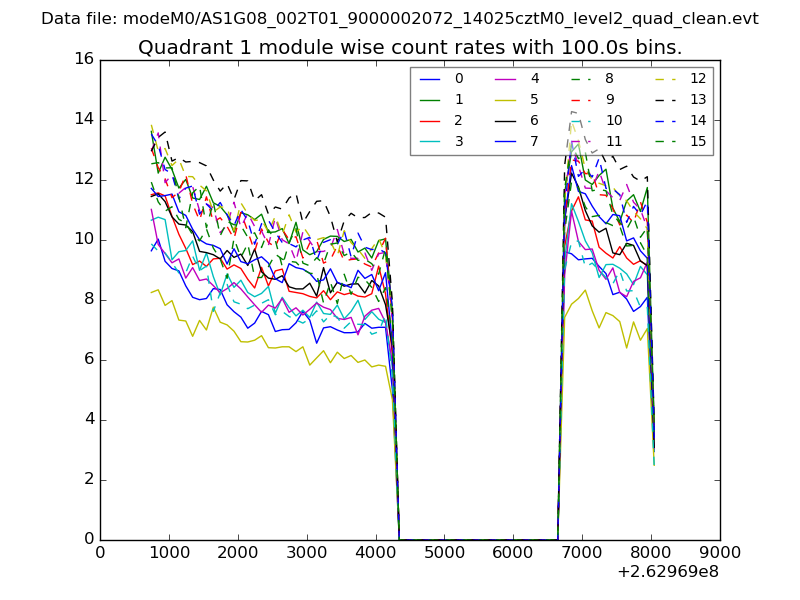
| Module-wise count rates for Quadrant A Data is divided into 100 sec bins |
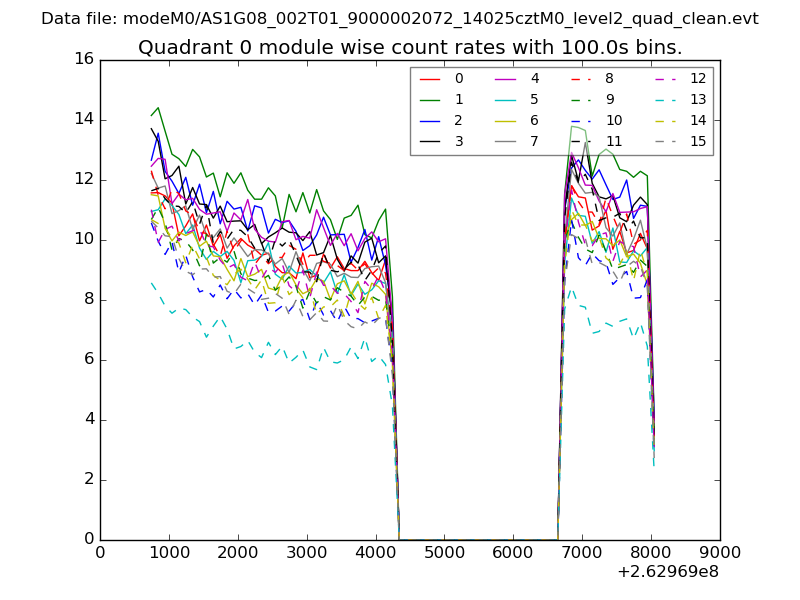 |
 |
| Module-wise count rates for Quadrant B Data is divided into 100 sec bins |
 |
 |
| Module-wise count rates for Quadrant C Data is divided into 100 sec bins |
 |
 |
| Module-wise count rates for Quadrant D Data is divided into 100 sec bins |
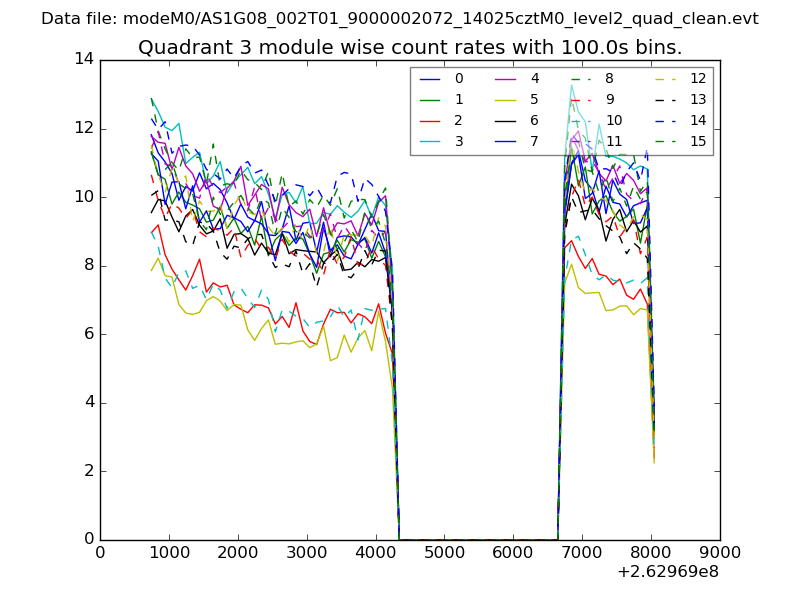 |
 |
| Parameter | Plot |
|---|---|
| CZT HV Monitor | 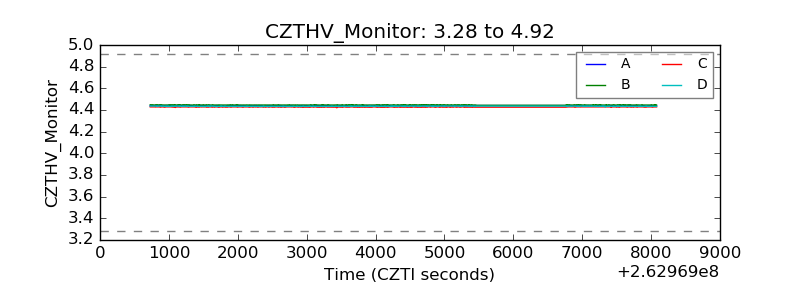 |
| D_VDD | 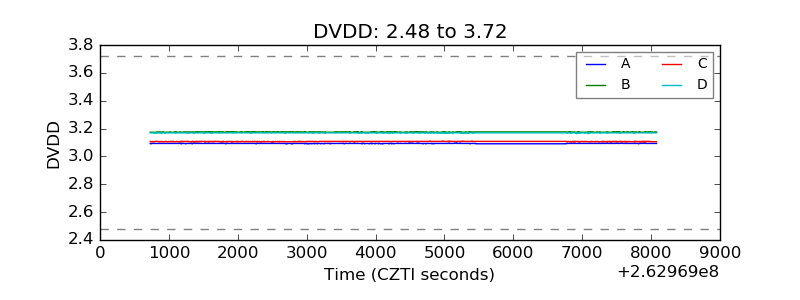 |
| Temperature 1 | 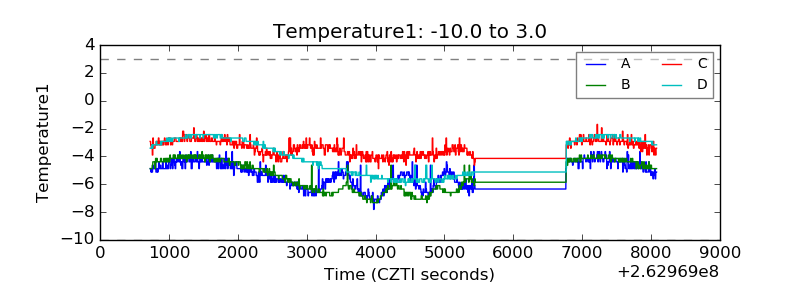 |
| Veto HV Monitor | 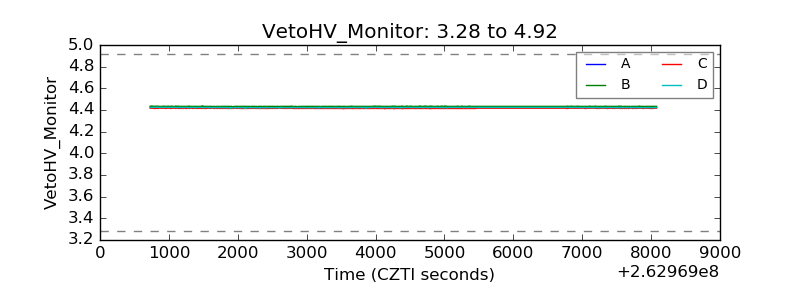 |
| Veto LLD | 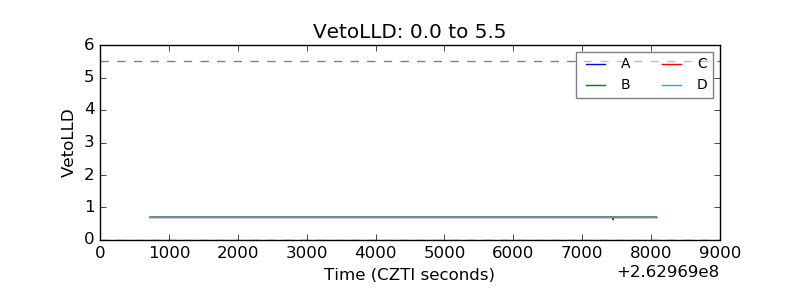 |
| Alpha Counter | 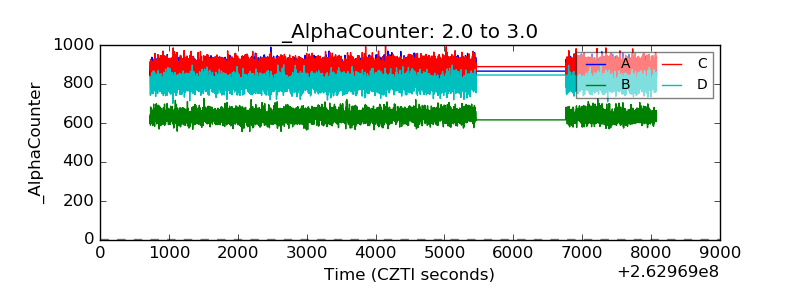 |
| _CPM_Rate | 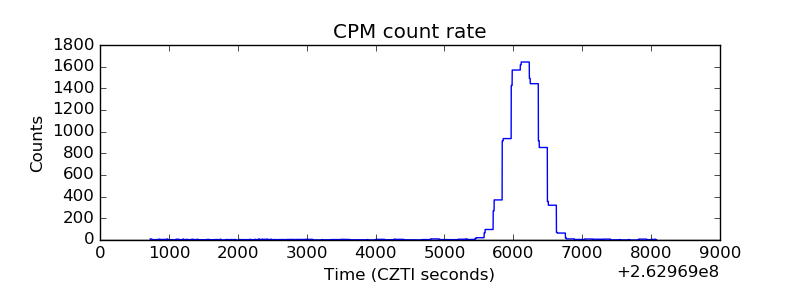 |
| CZT Counter | 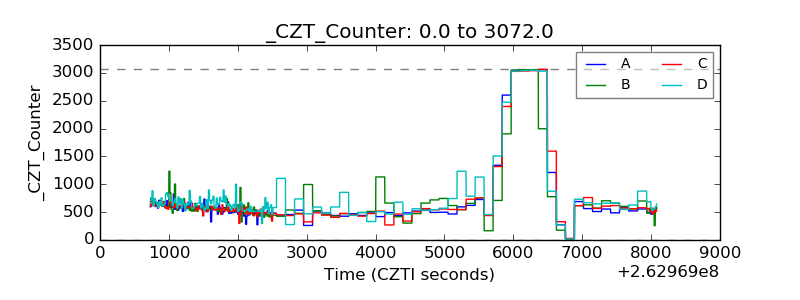 |
| +2.5 Volts monitor |  |
| +5 Volts monitor |  |
| _ROLL_ROT | 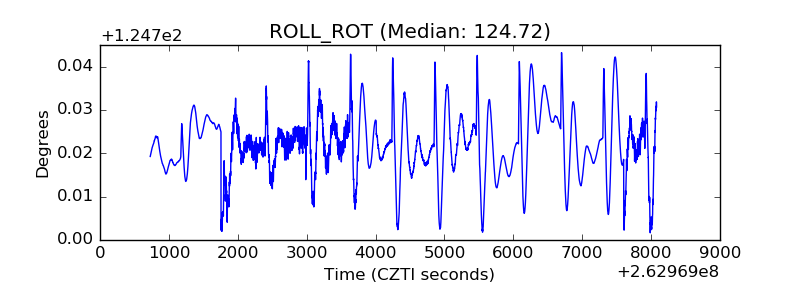 |
| _Roll_DEC | 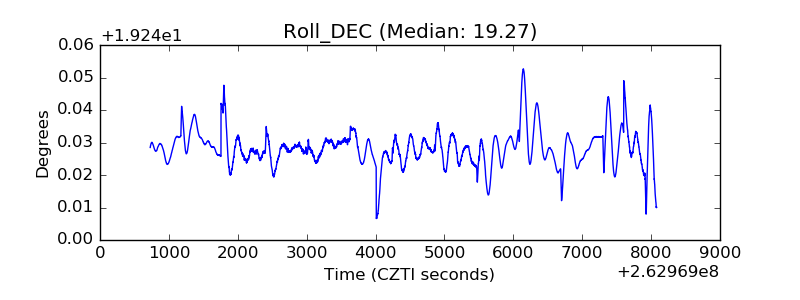 |
| _Roll_RA | 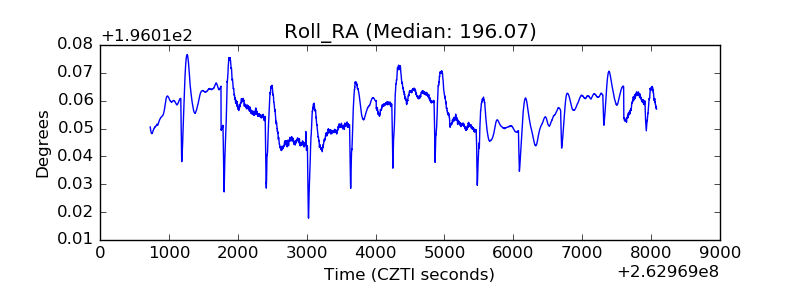 |
| Veto Counter | 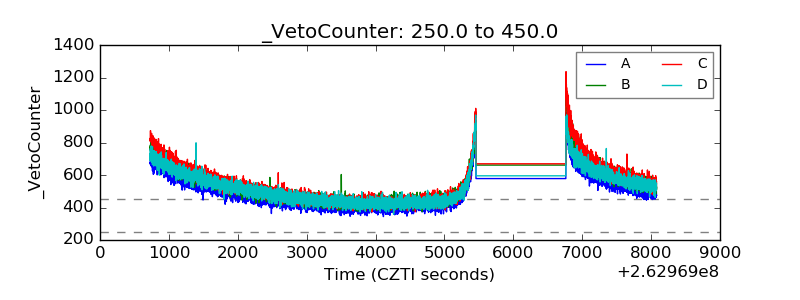 |