| Param | Original file | Final file |
|---|---|---|
| Filename | modeM0/AS1G08_002T01_9000002072_14026cztM0_level2.evt | modeM0/AS1G08_002T01_9000002072_14026cztM0_level2_quad_clean.evt |
| Size (bytes) | 485,648,640 | 108,699,840 |
| Size | 463.2 MB | 103.7 MB |
| Events in quadrant A | 3,364,644 | 716,847 |
| Events in quadrant B | 3,355,455 | 724,410 |
| Events in quadrant C | 3,325,817 | 725,936 |
| Events in quadrant D | 4,236,342 | 687,156 |
| Mode M9 | |||
|---|---|---|---|
| Quadrant | BADHDUFLAG | Total packets | Discarded packets |
| A | 0 | 14 | 0 |
| B | 0 | 14 | 0 |
| C | 0 | 14 | 0 |
| D | 0 | 14 | 0 |
| Mode SS | |||
|---|---|---|---|
| Quadrant | BADHDUFLAG | Total packets | Discarded packets |
| A | 0 | 126 | 0 |
| B | 0 | 126 | 0 |
| C | 0 | 126 | 0 |
| D | 0 | 126 | 0 |
| Mode M0 | |||
|---|---|---|---|
| Quadrant | BADHDUFLAG | Total packets | Discarded packets |
| A | 0 | 13861 | 3 |
| B | 0 | 13884 | 2 |
| C | 0 | 13714 | 2 |
| D | 0 | 16796 | 2 |
| Quadrant | Total seconds | Saturated seconds | Saturation percentage |
|---|---|---|---|
| A | 6279 | 99 | 1.576684% |
| B | 6279 | 99 | 1.576684% |
| C | 6279 | 70 | 1.114827% |
| D | 6280 | 140 | 2.229299% |
Noise dominated data is calculated using 1-second bins in cleaned event files. If a bin has >2000 counts, and if more than 50% of those come from <1% of pixels, then it is considered to be noise-dominated and hence unusable.
| Quadrant | # 1 sec bins | Bins with >0 counts | Bins with >2000 counts | High rate bins dominated by noise | Noise dominated (total time) | Noise dominated (detector-on time) | Marked lightcurve |
|---|---|---|---|---|---|---|---|
| A | 7590 | 6281 | 9 | 9 | 0.12% | 0.14% | 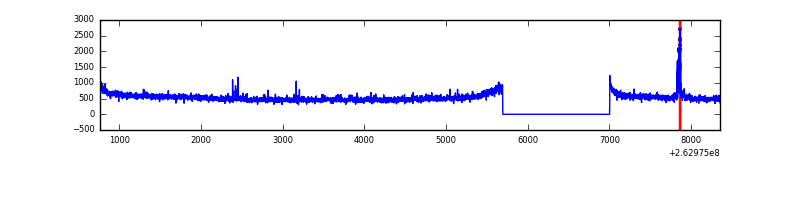 |
| B | 7590 | 6281 | 4 | 4 | 0.05% | 0.06% | 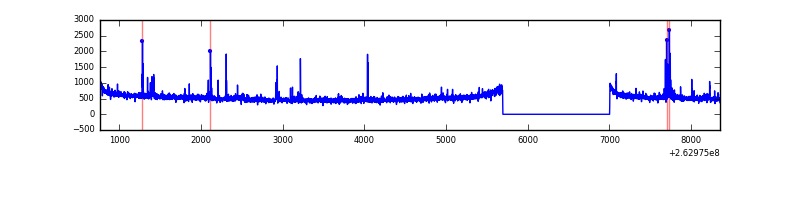 |
| C | 7590 | 6281 | 0 | 0 | 0.00% | 0.00% | 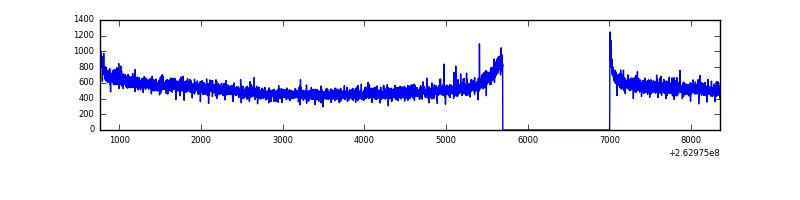 |
| D | 7591 | 6282 | 55 | 55 | 0.72% | 0.88% | 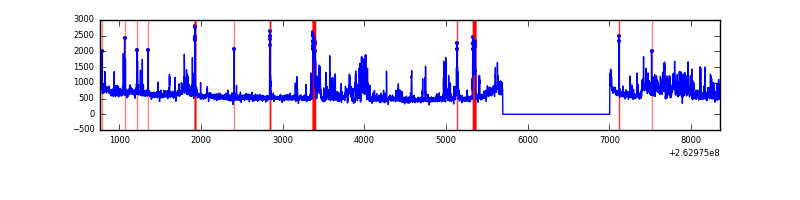 |
Top three noisy pixels from each quadrant. If the there are fewer than three noisy pixels in the level2.evt file, extra rows are filled as -1
| Pixel properties | Quadrant properties | ||||||
|---|---|---|---|---|---|---|---|
| Quadrant | DetID | PixID | Counts | Sigma | Mean | Median | Sigma |
| A | 12 | 189 | 89118 | 525.23 | 837 | 822 | 168.1 |
| A | 8 | 15 | 51561 | 301.82 | 837 | 822 | 168.1 |
| A | 0 | 226 | 7334 | 38.74 | 837 | 822 | 168.1 |
| B | 4 | 173 | 51983 | 329.73 | 827 | 807 | 155.2 |
| B | 10 | 16 | 31565 | 198.17 | 827 | 807 | 155.2 |
| B | 0 | 189 | 28762 | 180.11 | 827 | 807 | 155.2 |
| C | 3 | 233 | 108757 | 570.51 | 825 | 831 | 189.2 |
| C | 13 | 61 | 5713 | 25.81 | 825 | 831 | 189.2 |
| C | 12 | 4 | 3451 | 13.85 | 825 | 831 | 189.2 |
| D | 10 | 157 | 405094 | 1866.26 | 811 | 798 | 216.6 |
| D | 8 | 195 | 266374 | 1225.92 | 811 | 798 | 216.6 |
| D | 12 | 110 | 166533 | 765.04 | 811 | 798 | 216.6 |
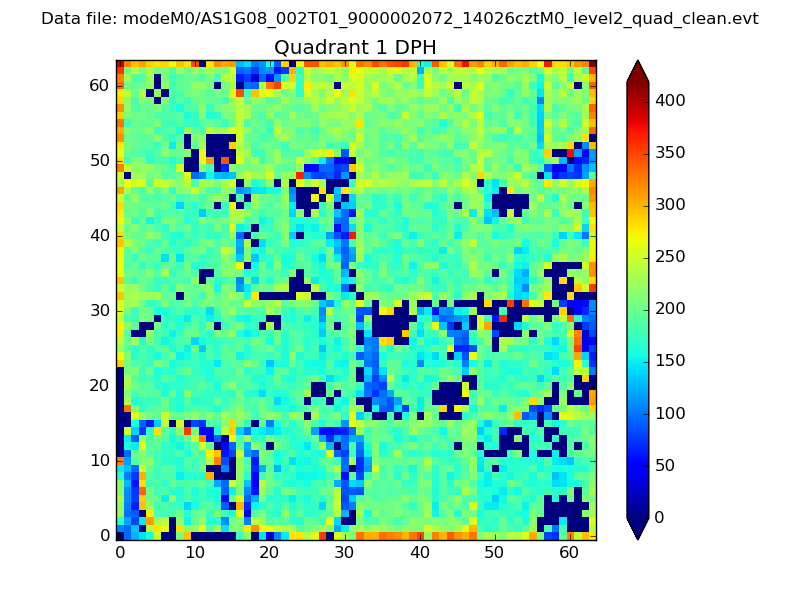
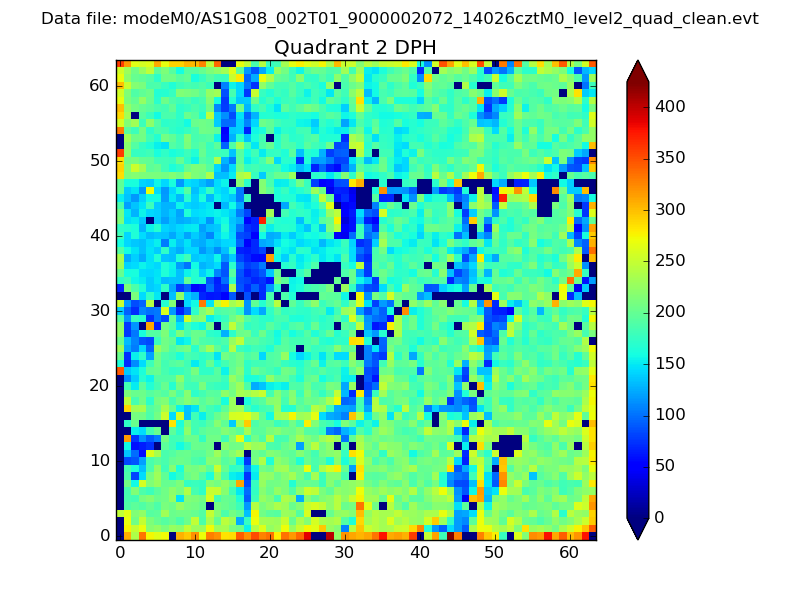
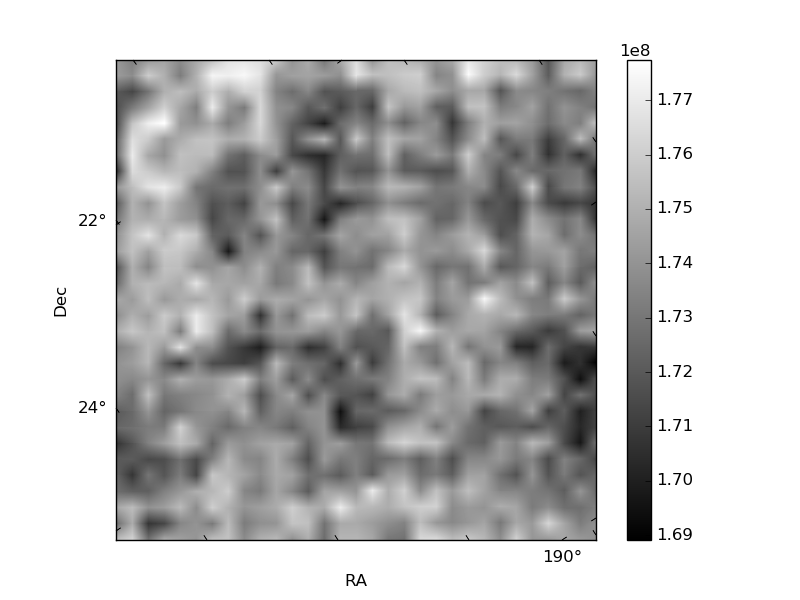
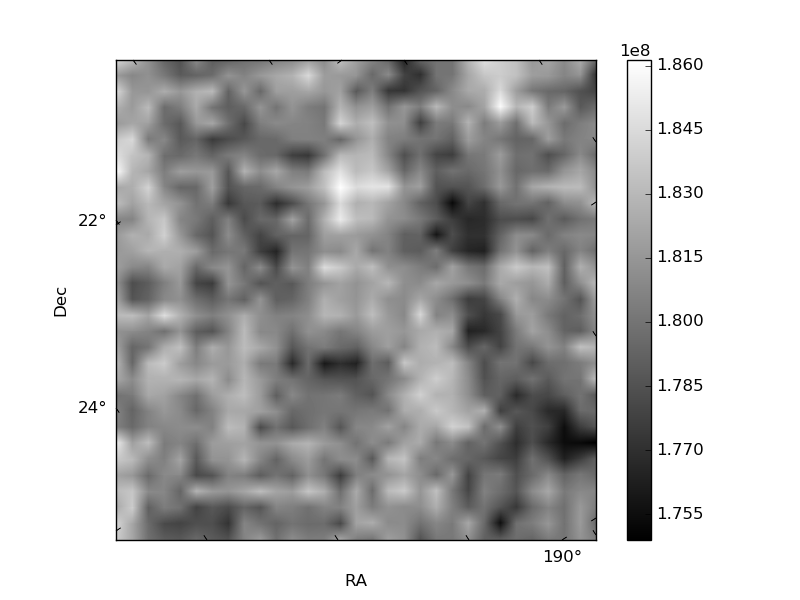
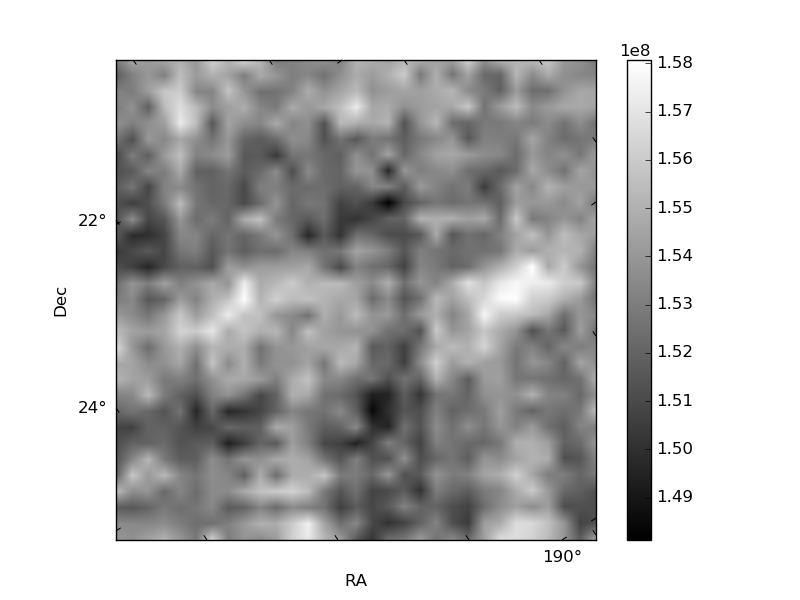
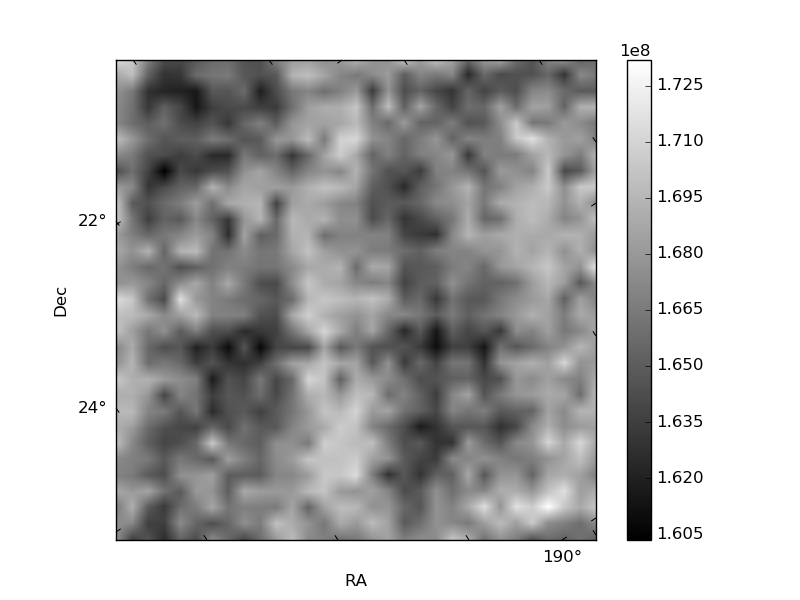
Histogram calculated using DETX and DETY for each event in the final _common_clean file
| Quadrant A |  |
 |
Quadrant B |
|---|---|---|---|
| Quadrant D |  |
 |
Quadrant C |
| Plot type | Count rate plots | Images |
|---|---|---|
| Comparison with Poisson distribution Blue bars denote a histogram of data divided into 1 sec bins. Red curve is a Poisson curve with rate = median count rate of data. |
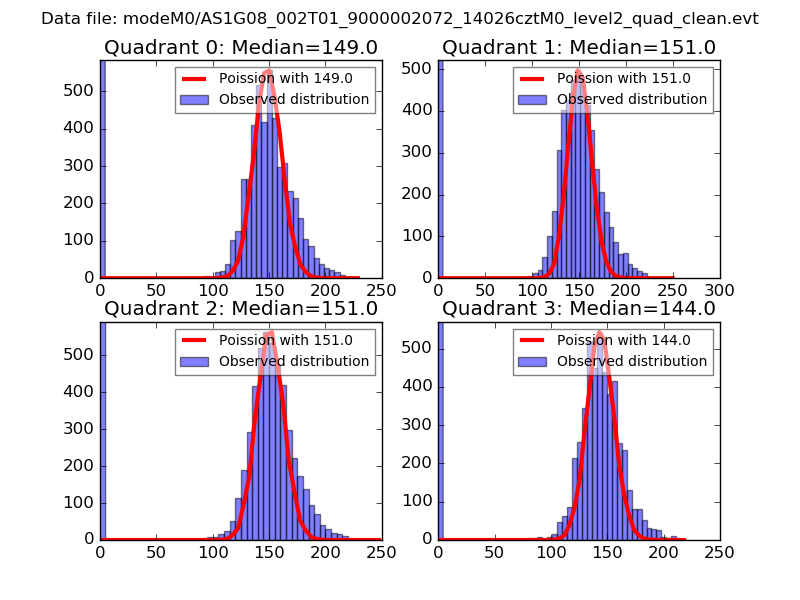 |
 |
| Quadrant-wise count rates Data is divided into 100 sec bins |
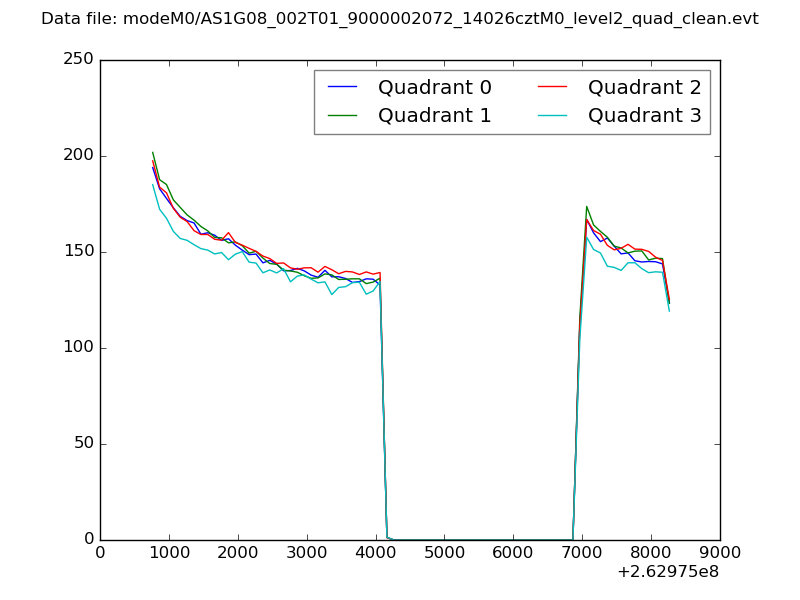 |
|
| Module-wise count rates for Quadrant A Data is divided into 100 sec bins |
 |
 |
| Module-wise count rates for Quadrant B Data is divided into 100 sec bins |
 |
 |
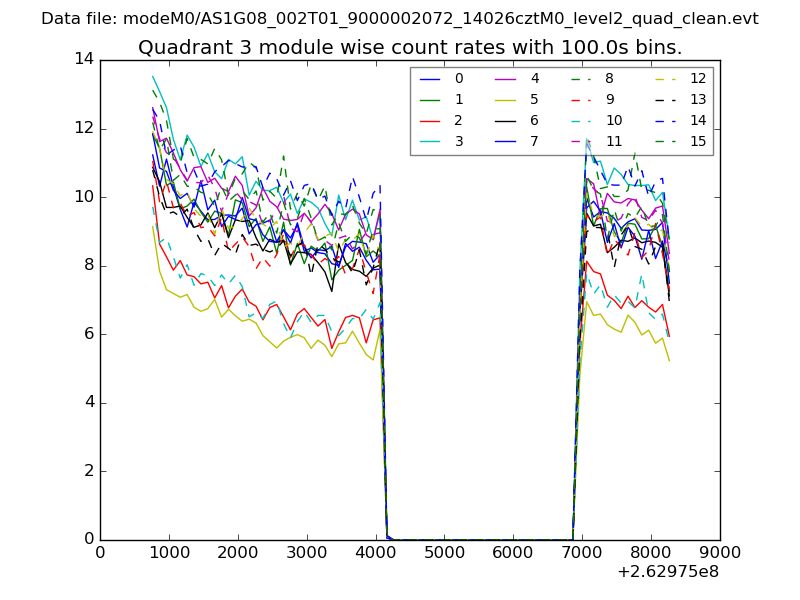
| Module-wise count rates for Quadrant C Data is divided into 100 sec bins |
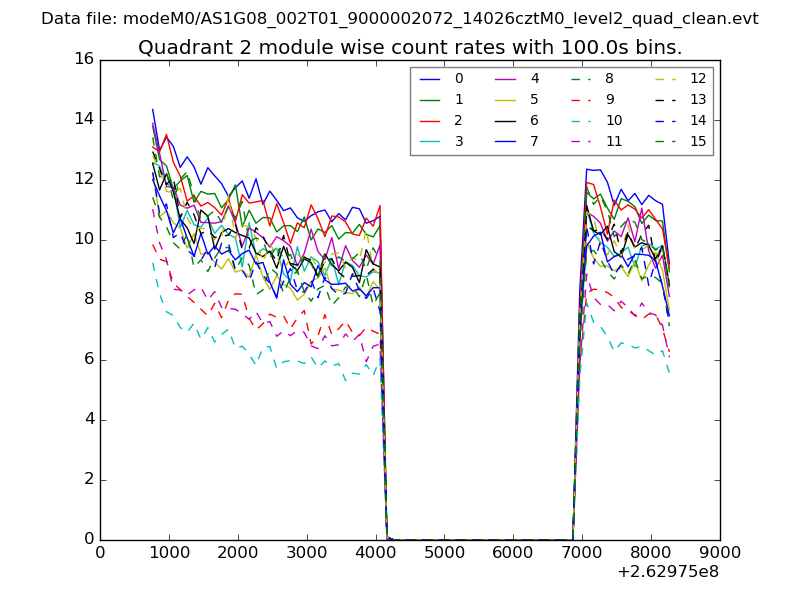 |
 |
| Module-wise count rates for Quadrant D Data is divided into 100 sec bins |
 |
 |
| Parameter | Plot |
|---|---|
| CZT HV Monitor |  |
| D_VDD | 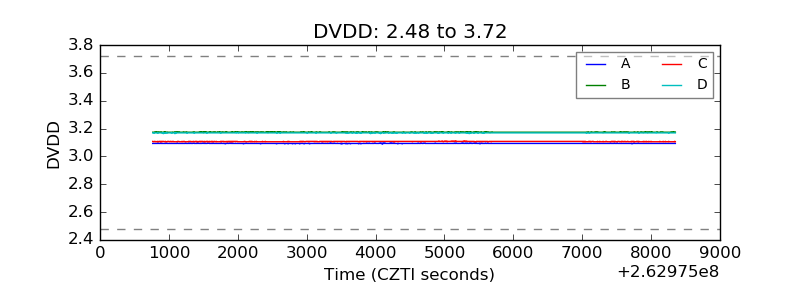 |
| Temperature 1 | 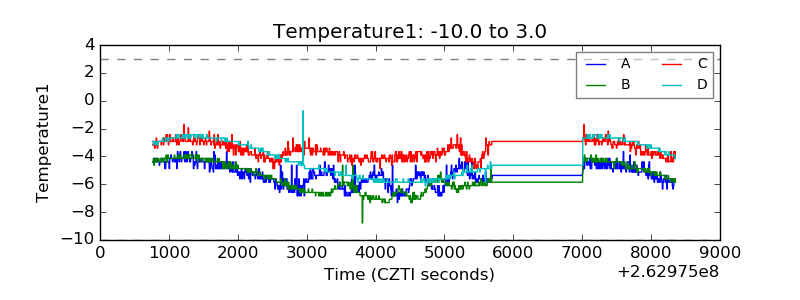 |
| Veto HV Monitor | 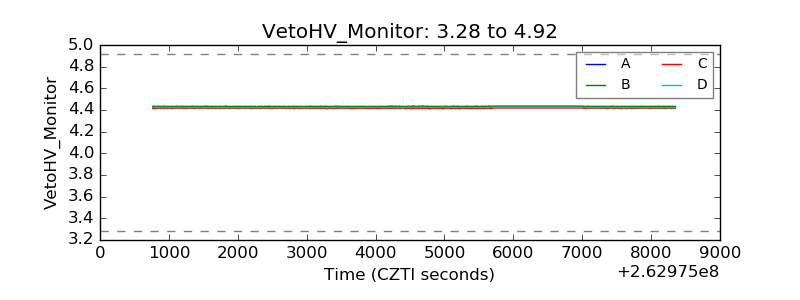 |
| Veto LLD | 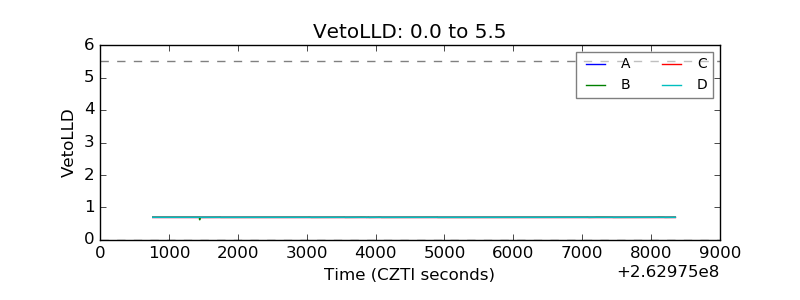 |
| Alpha Counter | 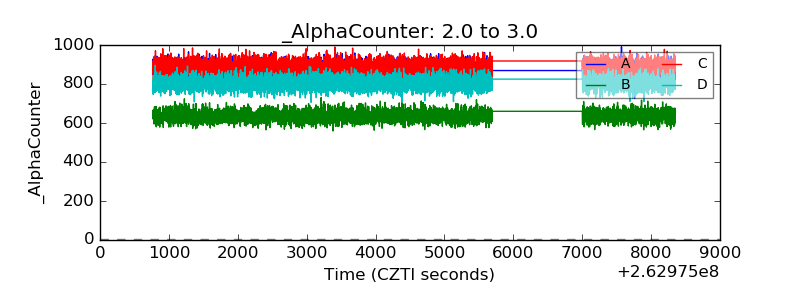 |
| _CPM_Rate | 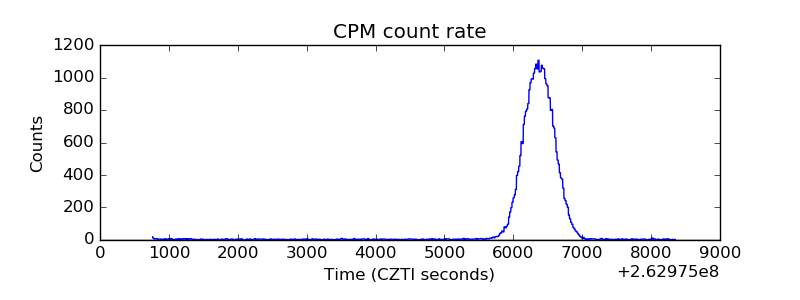 |
| CZT Counter | 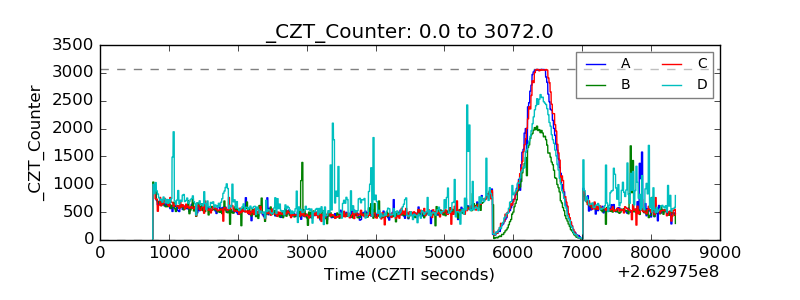 |
| +2.5 Volts monitor |  |
| +5 Volts monitor | 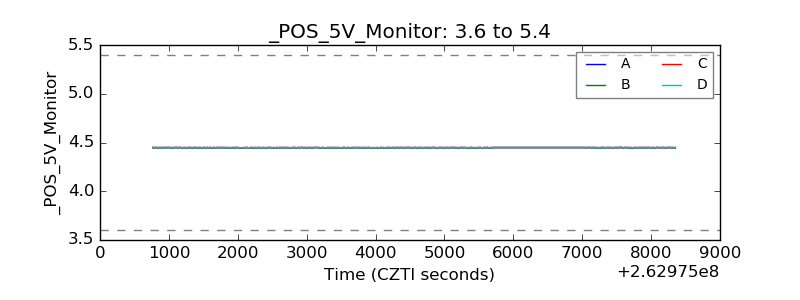 |
| _ROLL_ROT | 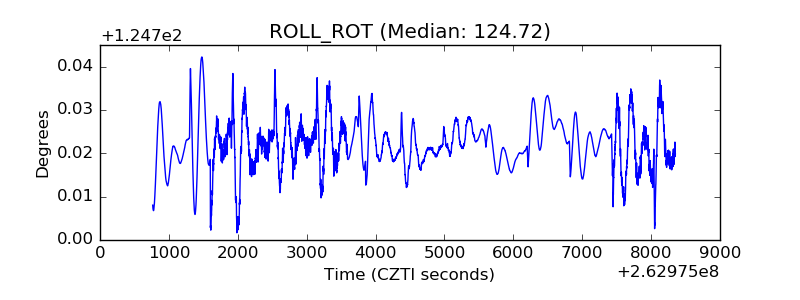 |
| _Roll_DEC | 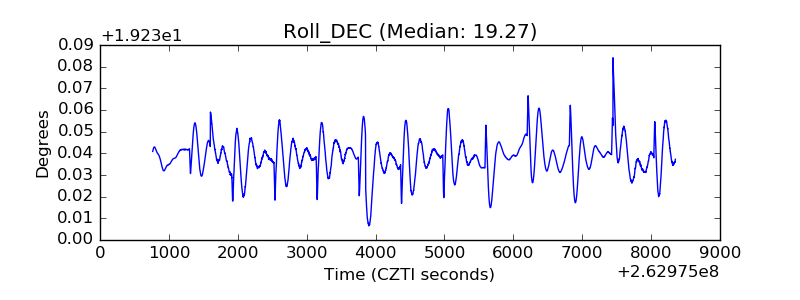 |
| _Roll_RA |  |
| Veto Counter | 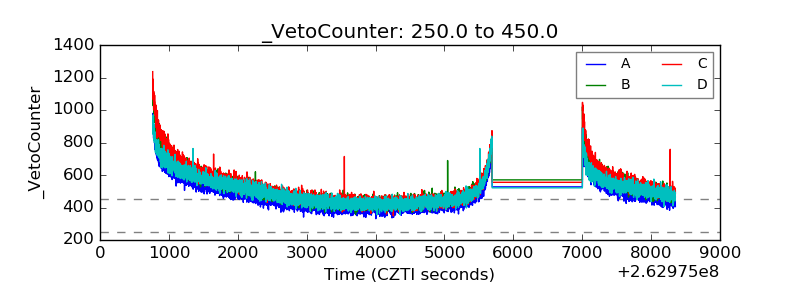 |