| Param | Original file | Final file |
|---|---|---|
| Filename | modeM0/AS1G08_002T01_9000002072_14027cztM0_level2.evt | modeM0/AS1G08_002T01_9000002072_14027cztM0_level2_quad_clean.evt |
| Size (bytes) | 455,690,880 | 93,349,440 |
| Size | 434.6 MB | 89.0 MB |
| Events in quadrant A | 3,170,943 | 596,879 |
| Events in quadrant B | 3,168,095 | 605,039 |
| Events in quadrant C | 3,293,967 | 605,150 |
| Events in quadrant D | 3,740,721 | 581,267 |
| Mode M9 | |||
|---|---|---|---|
| Quadrant | BADHDUFLAG | Total packets | Discarded packets |
| A | 0 | 14 | 0 |
| B | 0 | 14 | 0 |
| C | 0 | 14 | 0 |
| D | 0 | 15 | 0 |
| Mode SS | |||
|---|---|---|---|
| Quadrant | BADHDUFLAG | Total packets | Discarded packets |
| A | 0 | 128 | 0 |
| B | 0 | 128 | 0 |
| C | 0 | 128 | 0 |
| D | 0 | 128 | 0 |
| Mode M0 | |||
|---|---|---|---|
| Quadrant | BADHDUFLAG | Total packets | Discarded packets |
| A | 0 | 13437 | 3 |
| B | 0 | 13391 | 2 |
| C | 0 | 13815 | 2 |
| D | 0 | 15364 | 2 |
| Quadrant | Total seconds | Saturated seconds | Saturation percentage |
|---|---|---|---|
| A | 6283 | 45 | 0.716218% |
| B | 6283 | 35 | 0.557059% |
| C | 6283 | 25 | 0.397899% |
| D | 6283 | 110 | 1.750756% |
Noise dominated data is calculated using 1-second bins in cleaned event files. If a bin has >2000 counts, and if more than 50% of those come from <1% of pixels, then it is considered to be noise-dominated and hence unusable.
| Quadrant | # 1 sec bins | Bins with >0 counts | Bins with >2000 counts | High rate bins dominated by noise | Noise dominated (total time) | Noise dominated (detector-on time) | Marked lightcurve |
|---|---|---|---|---|---|---|---|
| A | 7494 | 6285 | 9 | 9 | 0.12% | 0.14% | 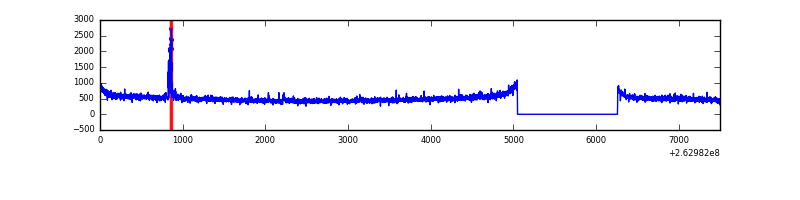 |
| B | 7494 | 6285 | 6 | 6 | 0.08% | 0.10% | 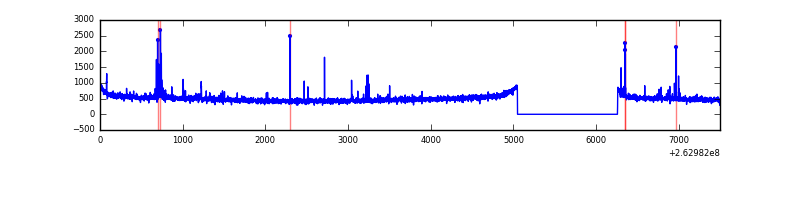 |
| C | 7494 | 6285 | 0 | 0 | 0.00% | 0.00% | 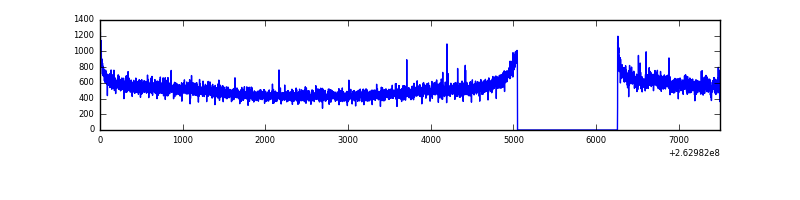 |
| D | 7494 | 6285 | 44 | 44 | 0.59% | 0.70% | 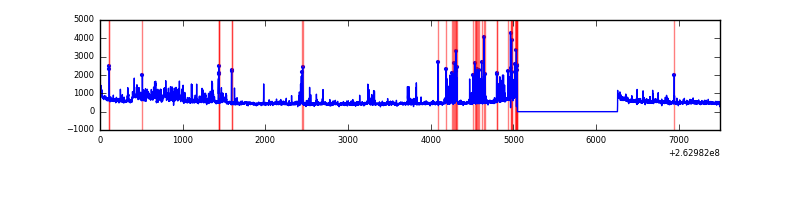 |
Top three noisy pixels from each quadrant. If the there are fewer than three noisy pixels in the level2.evt file, extra rows are filled as -1
| Pixel properties | Quadrant properties | ||||||
|---|---|---|---|---|---|---|---|
| Quadrant | DetID | PixID | Counts | Sigma | Mean | Median | Sigma |
| A | 12 | 189 | 85661 | 521.0 | 798 | 781 | 162.9 |
| A | 8 | 15 | 7326 | 40.17 | 798 | 781 | 162.9 |
| A | 0 | 226 | 7029 | 38.35 | 798 | 781 | 162.9 |
| B | 4 | 173 | 33957 | 222.3 | 790 | 773 | 149.3 |
| B | 0 | 189 | 22774 | 147.38 | 790 | 773 | 149.3 |
| B | 12 | 111 | 17708 | 113.45 | 790 | 773 | 149.3 |
| C | 3 | 233 | 232138 | 1272.05 | 784 | 788 | 181.9 |
| C | 13 | 61 | 5555 | 26.21 | 784 | 788 | 181.9 |
| C | 12 | 4 | 4719 | 21.61 | 784 | 788 | 181.9 |
| D | 10 | 157 | 480836 | 2405.48 | 772 | 757 | 199.6 |
| D | 1 | 52 | 160371 | 799.76 | 772 | 757 | 199.6 |
| D | 8 | 195 | 72421 | 359.08 | 772 | 757 | 199.6 |
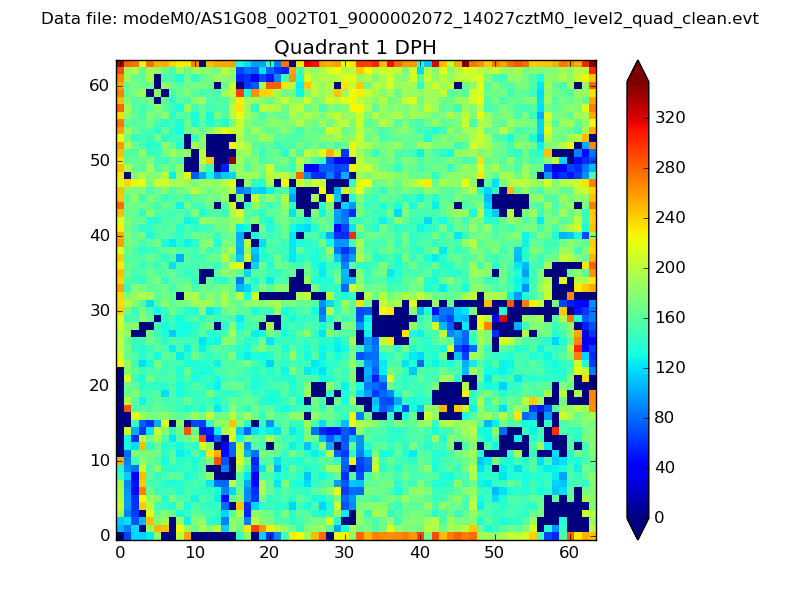
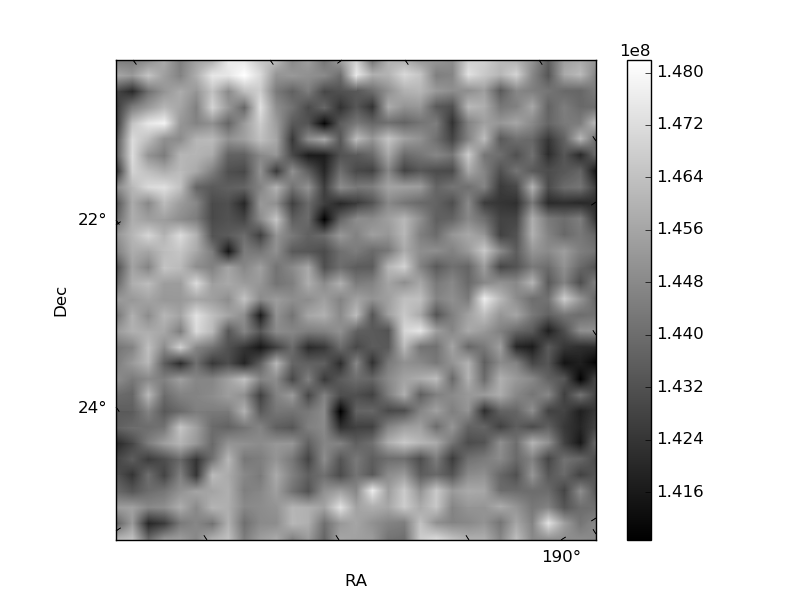
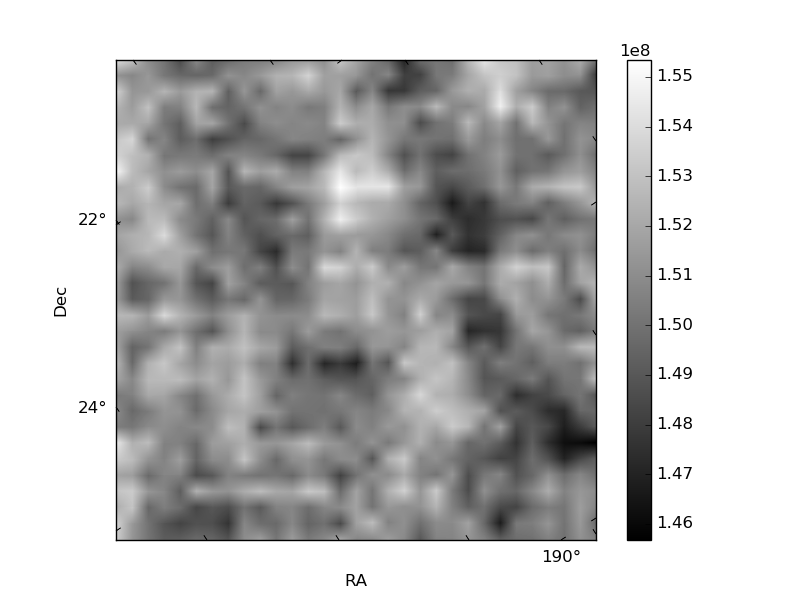
Histogram calculated using DETX and DETY for each event in the final _common_clean file
| Quadrant A |  |
 |
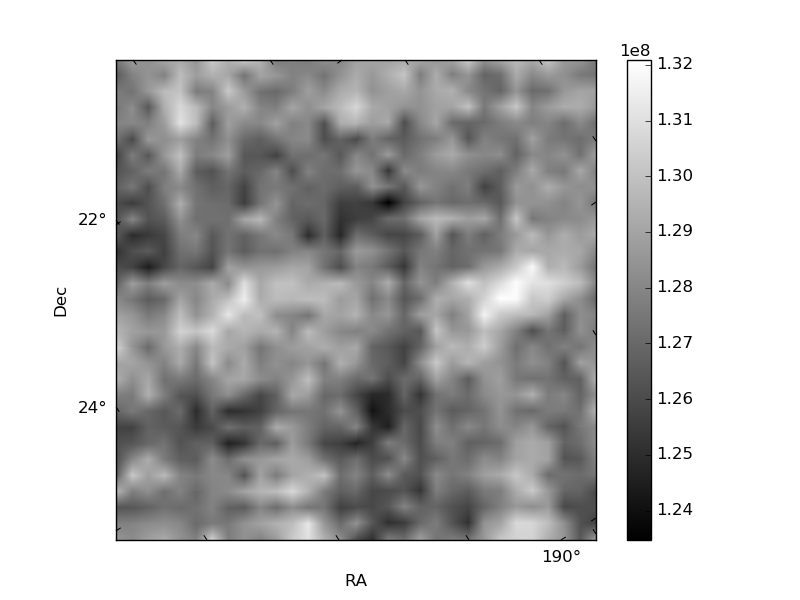
Quadrant B |
|---|---|---|---|
| Quadrant D | 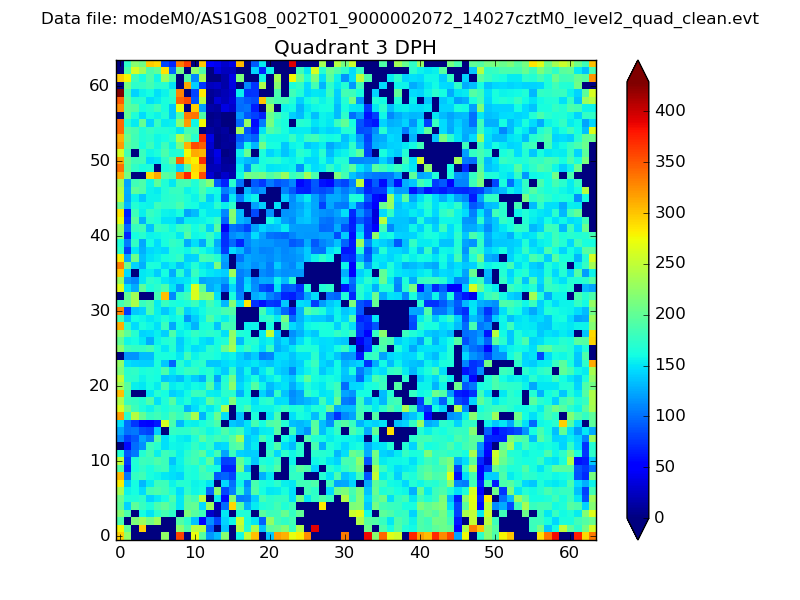 |
 |
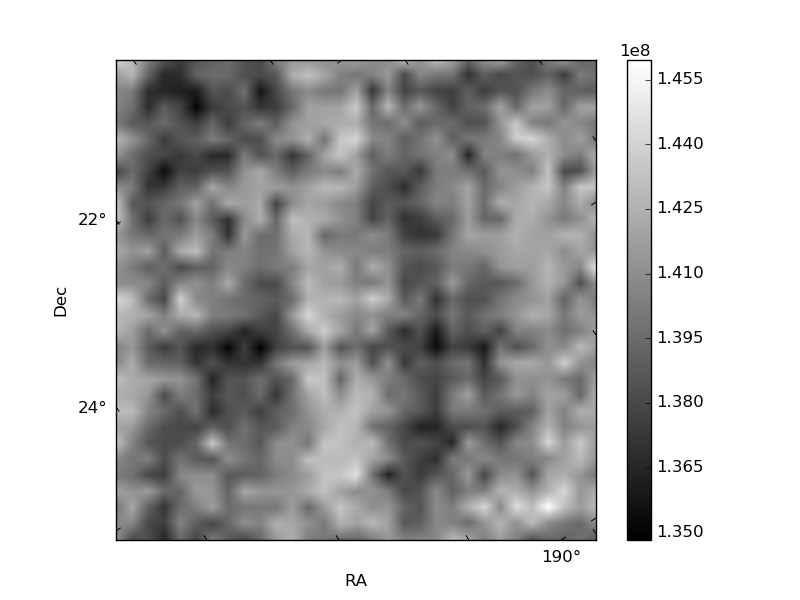
Quadrant C |
| Plot type | Count rate plots | Images |
|---|---|---|
| Comparison with Poisson distribution Blue bars denote a histogram of data divided into 1 sec bins. Red curve is a Poisson curve with rate = median count rate of data. |
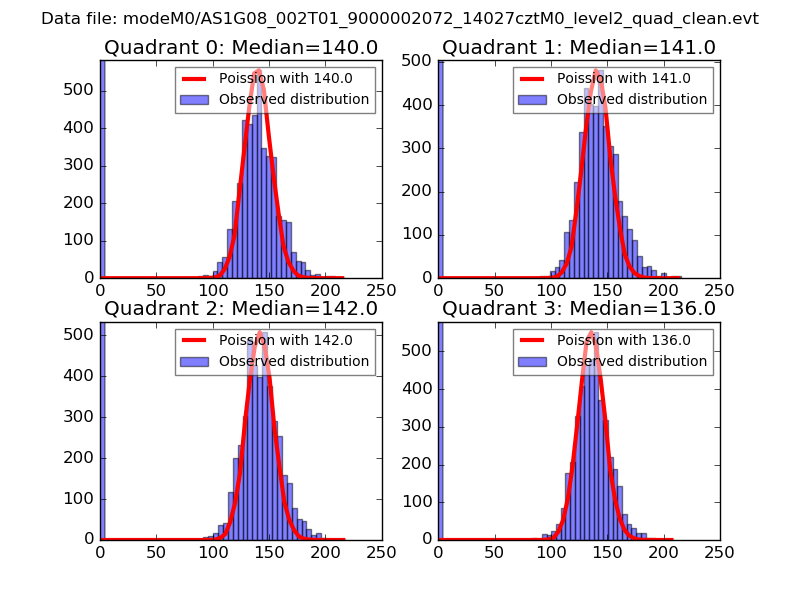 |
 |
| Quadrant-wise count rates Data is divided into 100 sec bins |
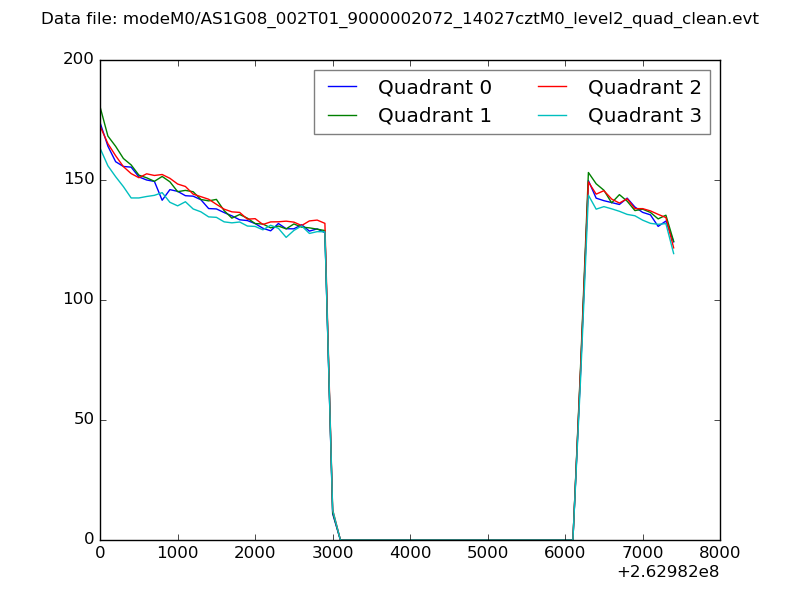 |
|
| Module-wise count rates for Quadrant A Data is divided into 100 sec bins |
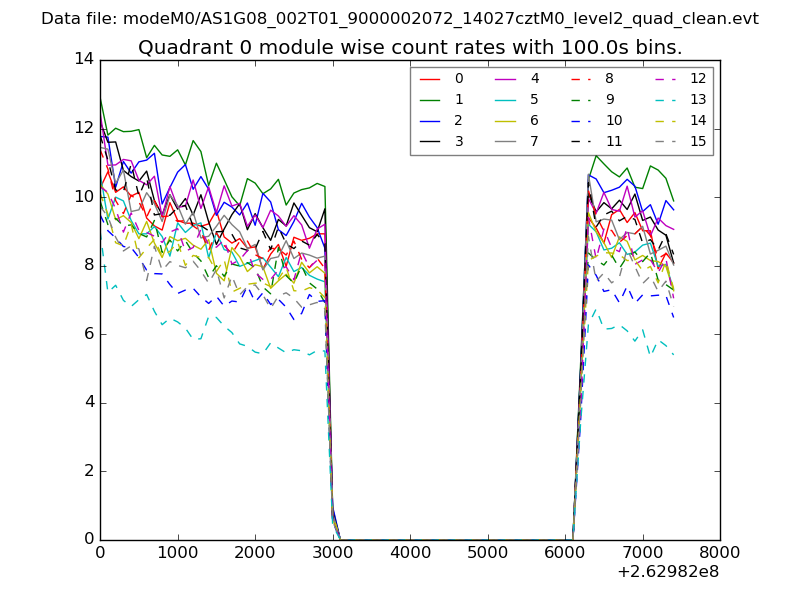 |
 |
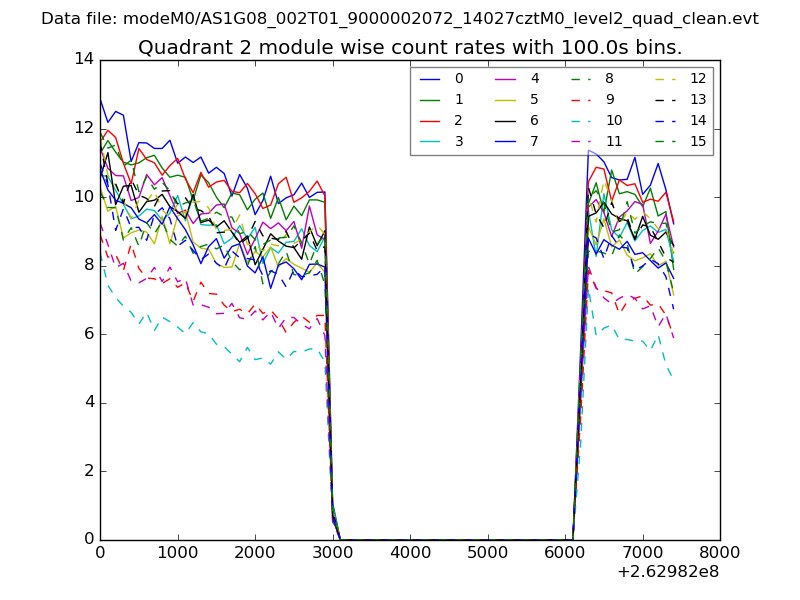
| Module-wise count rates for Quadrant B Data is divided into 100 sec bins |
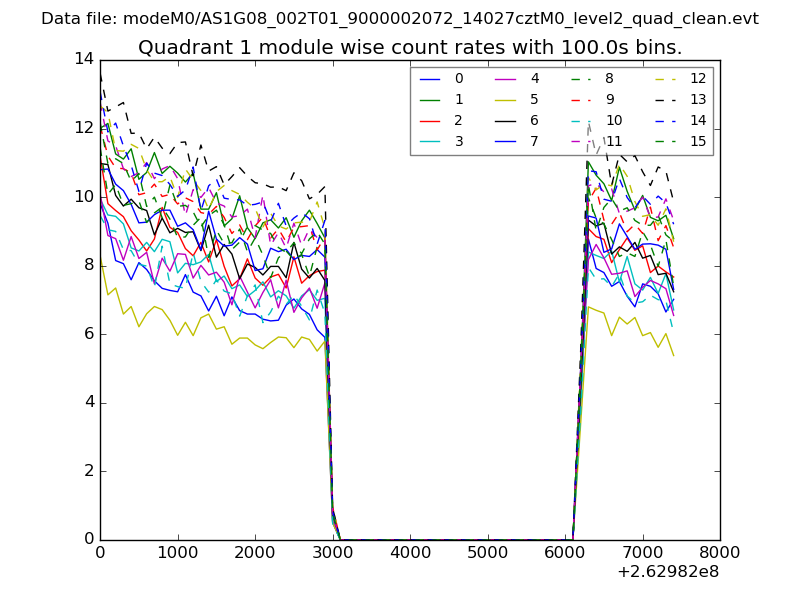 |
 |
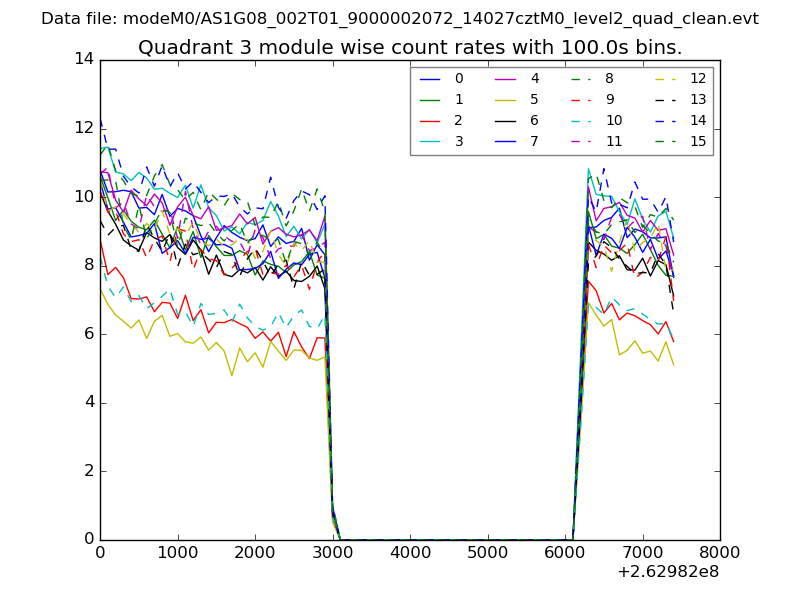
| Module-wise count rates for Quadrant C Data is divided into 100 sec bins |
 |
 |
| Module-wise count rates for Quadrant D Data is divided into 100 sec bins |
 |
 |
| Parameter | Plot |
|---|---|
| CZT HV Monitor | 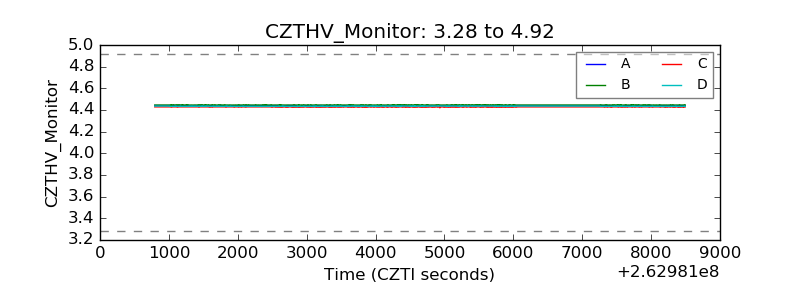 |
| D_VDD | 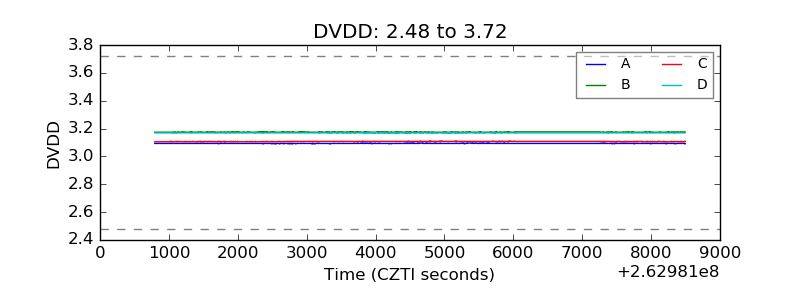 |
| Temperature 1 | 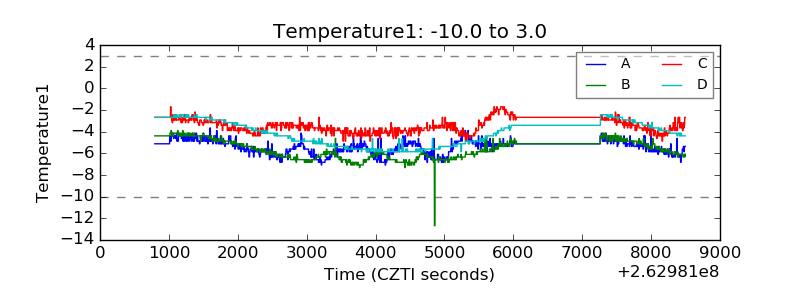 |
| Veto HV Monitor | 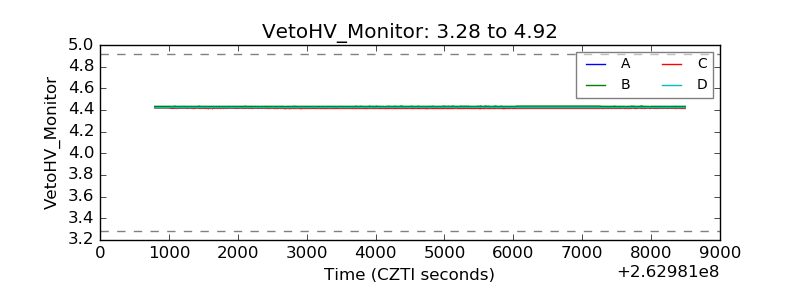 |
| Veto LLD | 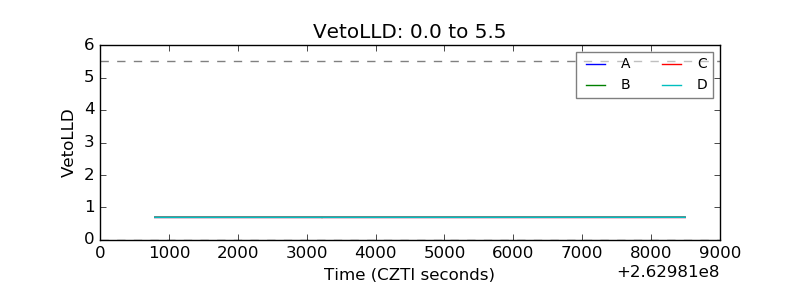 |
| Alpha Counter | 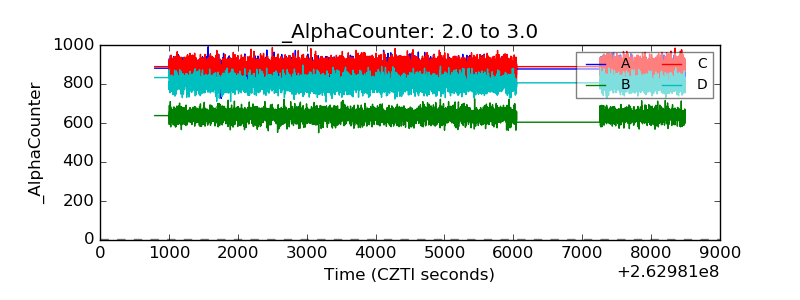 |
| _CPM_Rate | 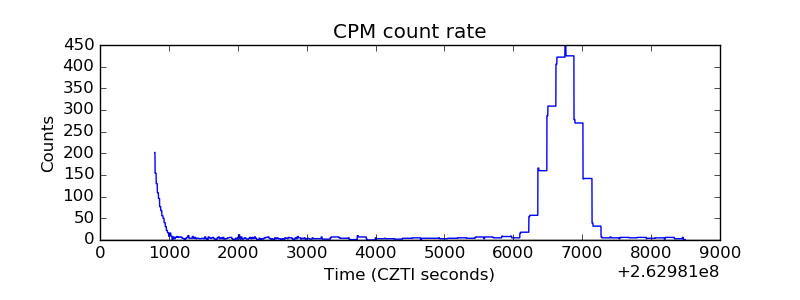 |
| CZT Counter |  |
| +2.5 Volts monitor |  |
| +5 Volts monitor |  |
| _ROLL_ROT | 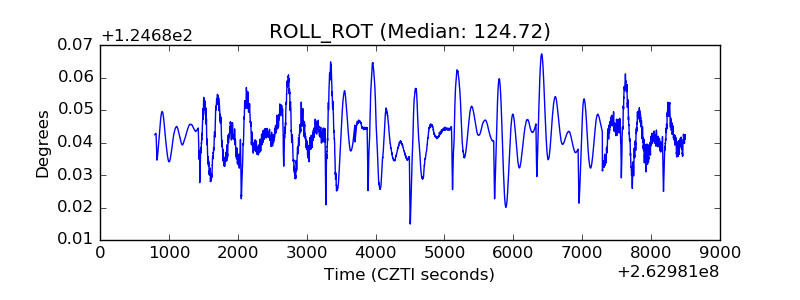 |
| _Roll_DEC | 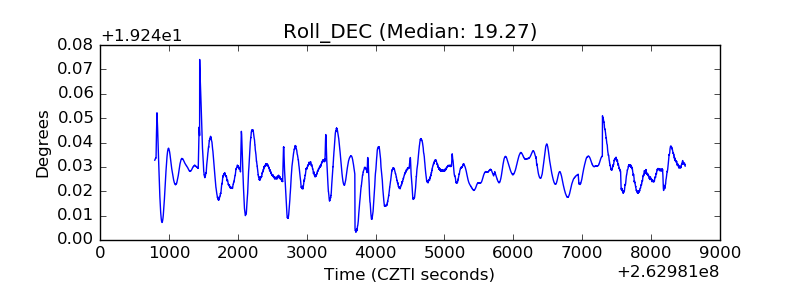 |
| _Roll_RA | 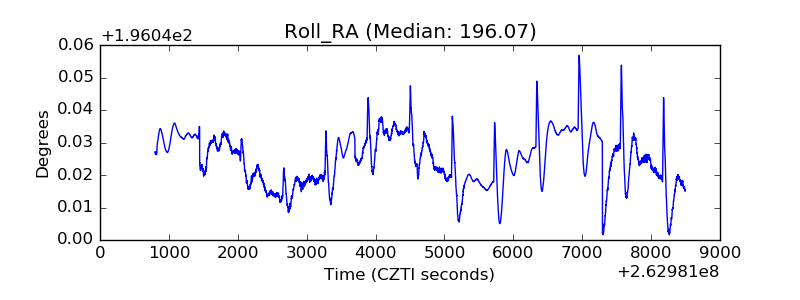 |
| Veto Counter | 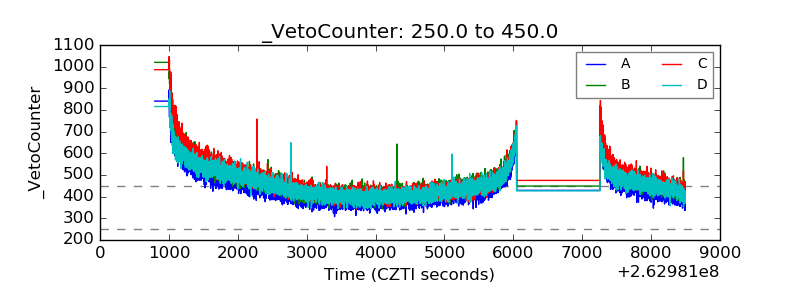 |