| Param | Original file | Final file |
|---|---|---|
| Filename | modeM0/AS1G08_002T01_9000002072_14029cztM0_level2.evt | modeM0/AS1G08_002T01_9000002072_14029cztM0_level2_quad_clean.evt |
| Size (bytes) | 542,635,200 | 103,610,880 |
| Size | 517.5 MB | 98.8 MB |
| Events in quadrant A | 3,507,478 | 658,650 |
| Events in quadrant B | 3,555,625 | 663,833 |
| Events in quadrant C | 3,993,958 | 665,313 |
| Events in quadrant D | 4,876,252 | 636,367 |
| Mode M9 | |||
|---|---|---|---|
| Quadrant | BADHDUFLAG | Total packets | Discarded packets |
| A | 0 | 13 | 0 |
| B | 0 | 13 | 0 |
| C | 0 | 13 | 0 |
| D | 0 | 13 | 0 |
| Mode SS | |||
|---|---|---|---|
| Quadrant | BADHDUFLAG | Total packets | Discarded packets |
| A | 0 | 152 | 0 |
| B | 0 | 152 | 0 |
| C | 0 | 152 | 0 |
| D | 0 | 152 | 0 |
| Mode M0 | |||
|---|---|---|---|
| Quadrant | BADHDUFLAG | Total packets | Discarded packets |
| A | 0 | 15339 | 3 |
| B | 0 | 15475 | 2 |
| C | 0 | 16505 | 2 |
| D | 0 | 19658 | 2 |
| Quadrant | Total seconds | Saturated seconds | Saturation percentage |
|---|---|---|---|
| A | 7384 | 62 | 0.839653% |
| B | 7384 | 73 | 0.988624% |
| C | 7384 | 45 | 0.609426% |
| D | 7384 | 144 | 1.950163% |
Noise dominated data is calculated using 1-second bins in cleaned event files. If a bin has >2000 counts, and if more than 50% of those come from <1% of pixels, then it is considered to be noise-dominated and hence unusable.
| Quadrant | # 1 sec bins | Bins with >0 counts | Bins with >2000 counts | High rate bins dominated by noise | Noise dominated (total time) | Noise dominated (detector-on time) | Marked lightcurve |
|---|---|---|---|---|---|---|---|
| A | 8625 | 7387 | 0 | 0 | 0.00% | 0.00% | 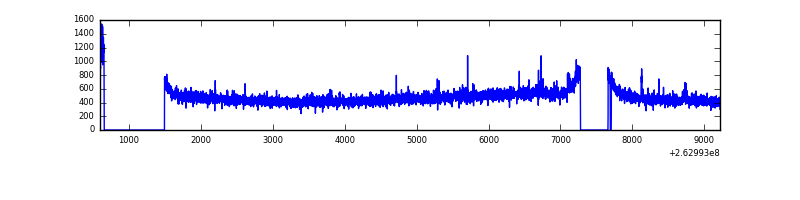 |
| B | 8625 | 7387 | 2 | 2 | 0.02% | 0.03% | 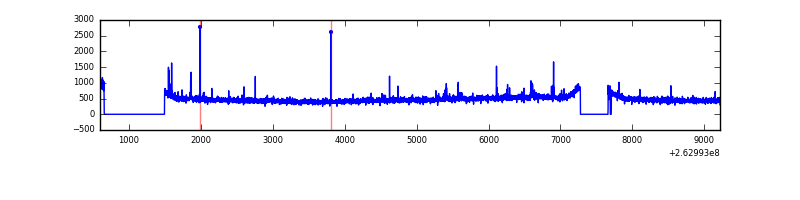 |
| C | 8625 | 7387 | 0 | 0 | 0.00% | 0.00% | 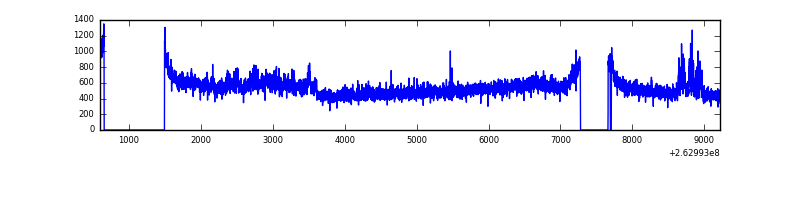 |
| D | 8625 | 7387 | 45 | 45 | 0.52% | 0.61% | 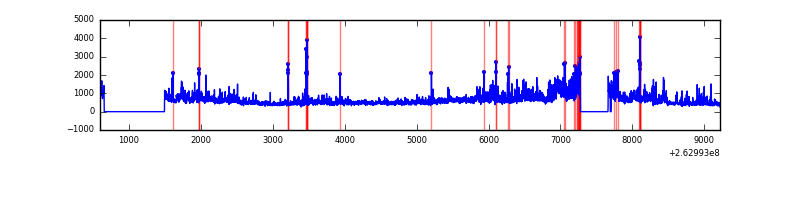 |
Top three noisy pixels from each quadrant. If the there are fewer than three noisy pixels in the level2.evt file, extra rows are filled as -1
| Pixel properties | Quadrant properties | ||||||
|---|---|---|---|---|---|---|---|
| Quadrant | DetID | PixID | Counts | Sigma | Mean | Median | Sigma |
| A | 12 | 189 | 57385 | 309.21 | 891 | 871 | 182.8 |
| A | 1 | 162 | 13082 | 66.81 | 891 | 871 | 182.8 |
| A | 0 | 226 | 8078 | 39.43 | 891 | 871 | 182.8 |
| B | 12 | 111 | 20835 | 116.84 | 887 | 865 | 170.9 |
| B | 11 | 111 | 17961 | 100.02 | 887 | 865 | 170.9 |
| B | 0 | 214 | 17947 | 99.94 | 887 | 865 | 170.9 |
| C | 3 | 233 | 523882 | 2585.13 | 874 | 878 | 202.3 |
| C | 14 | 220 | 62164 | 302.93 | 874 | 878 | 202.3 |
| C | 13 | 61 | 6174 | 26.18 | 874 | 878 | 202.3 |
| D | 1 | 52 | 1166586 | 5290.54 | 859 | 839 | 220.3 |
| D | 10 | 157 | 155383 | 701.37 | 859 | 839 | 220.3 |
| D | 8 | 195 | 135739 | 612.22 | 859 | 839 | 220.3 |
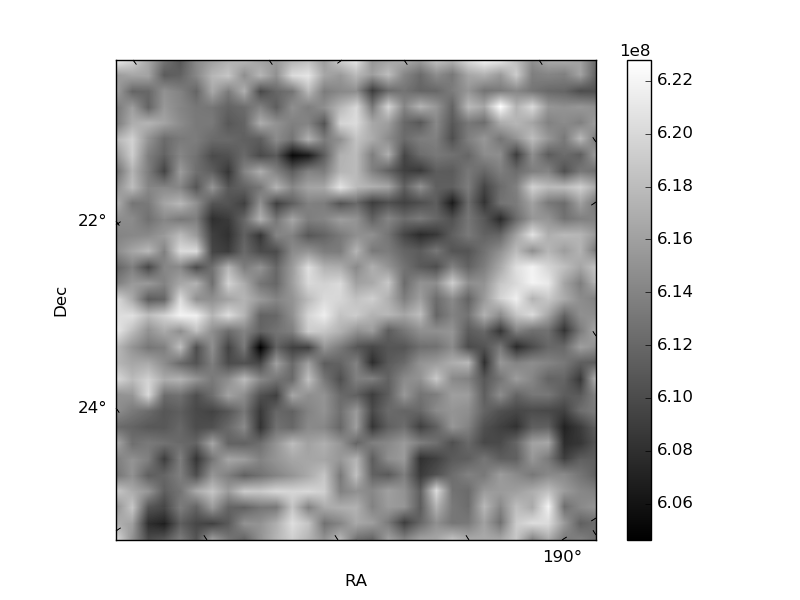
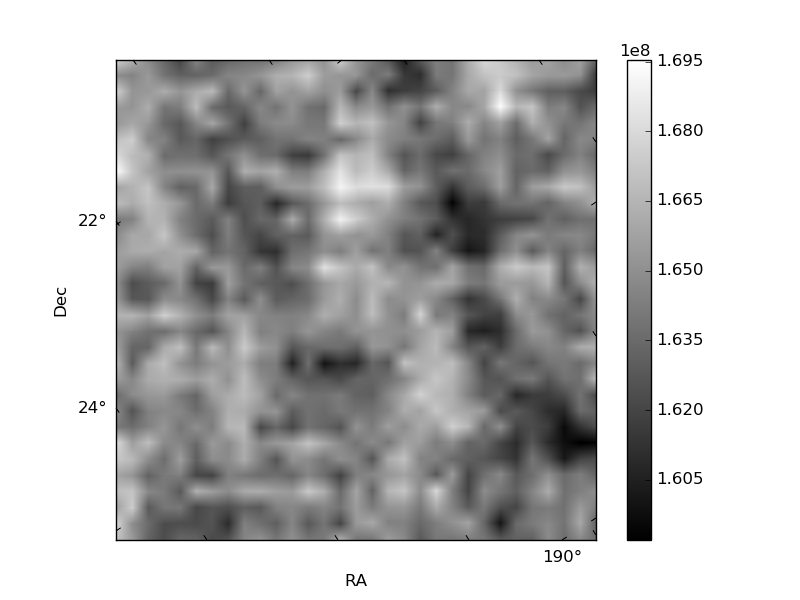
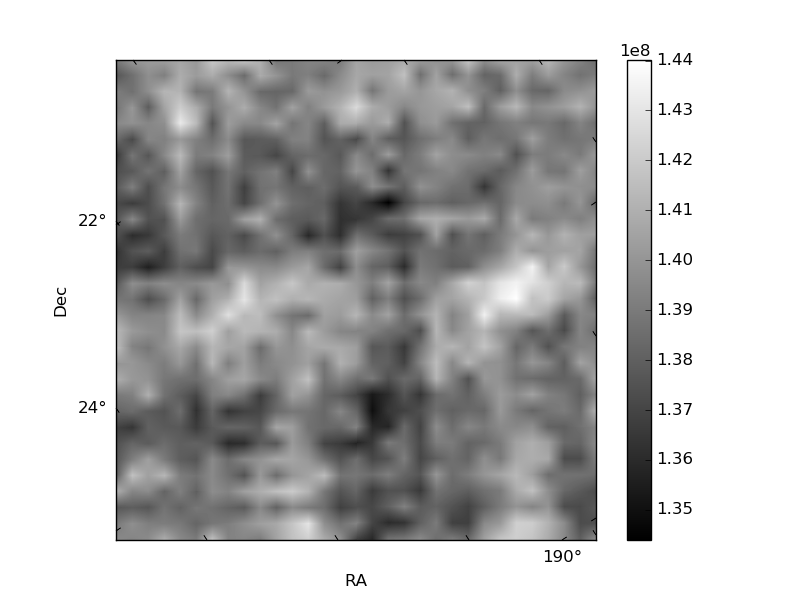
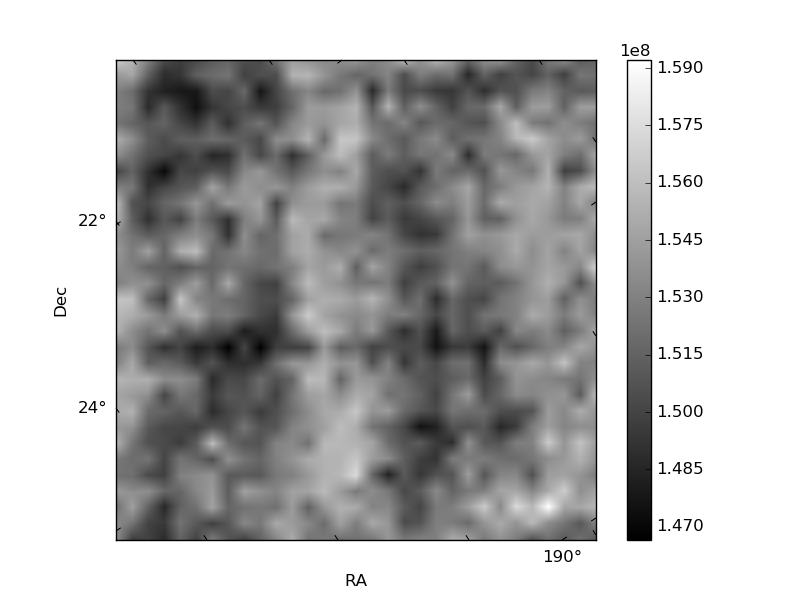
Histogram calculated using DETX and DETY for each event in the final _common_clean file
| Quadrant A | 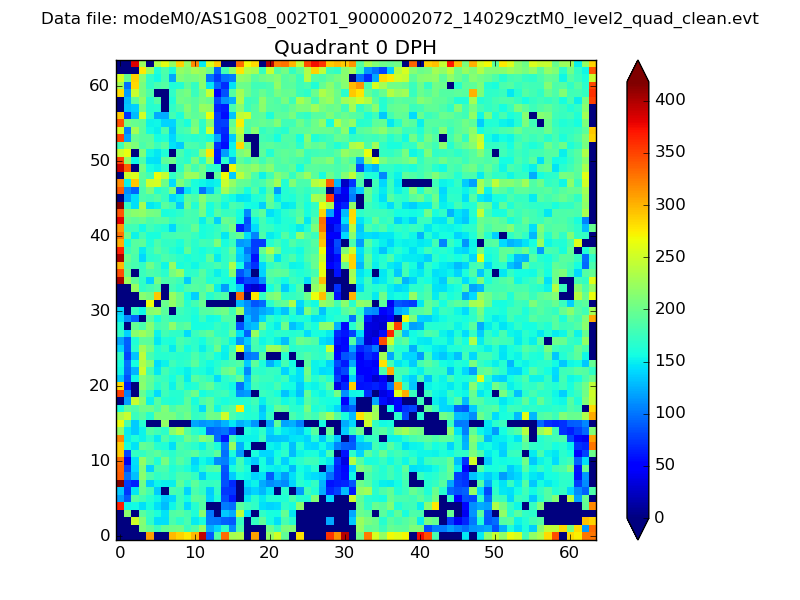 |
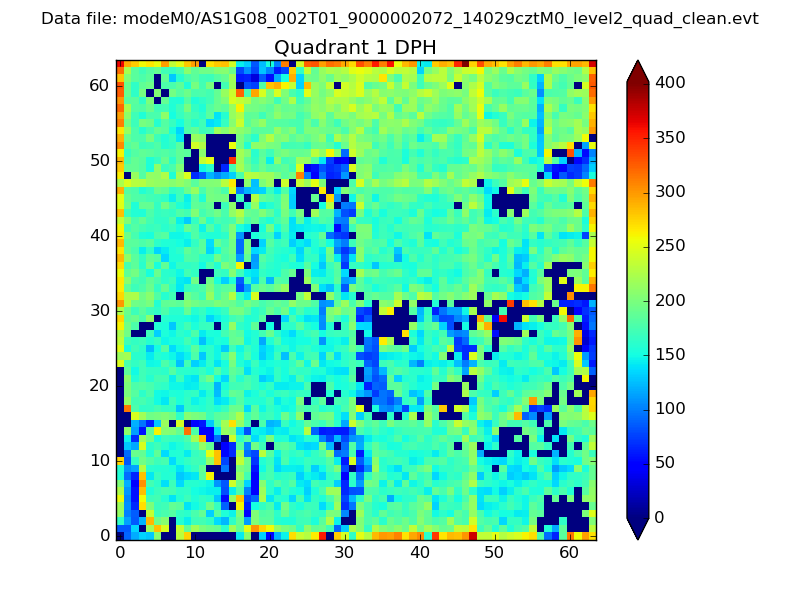 |
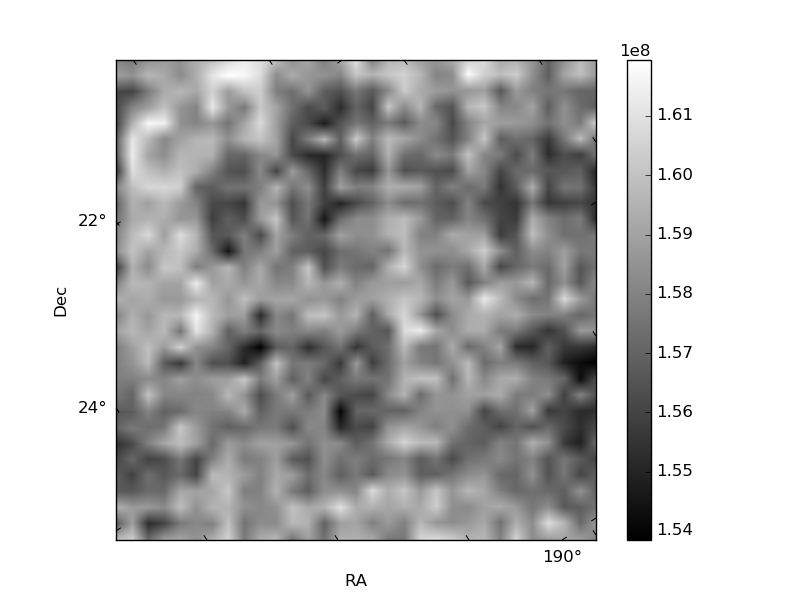
Quadrant B |
|---|---|---|---|
| Quadrant D | 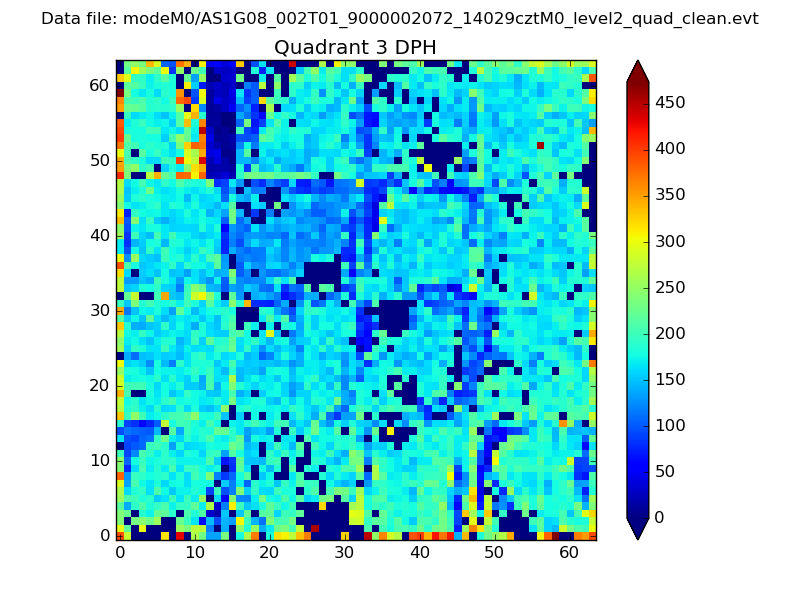 |
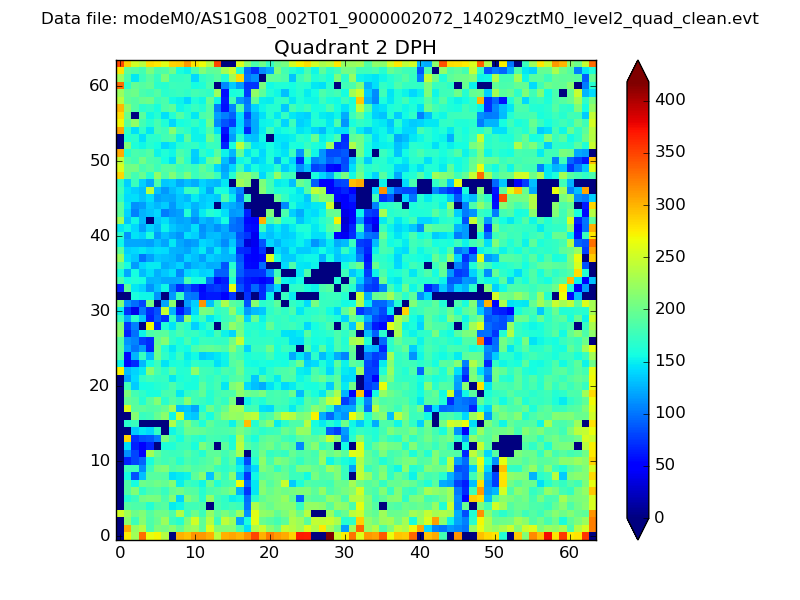 |
Quadrant C |
| Plot type | Count rate plots | Images |
|---|---|---|
| Comparison with Poisson distribution Blue bars denote a histogram of data divided into 1 sec bins. Red curve is a Poisson curve with rate = median count rate of data. |
 |
 |
| Quadrant-wise count rates Data is divided into 100 sec bins |
 |
|
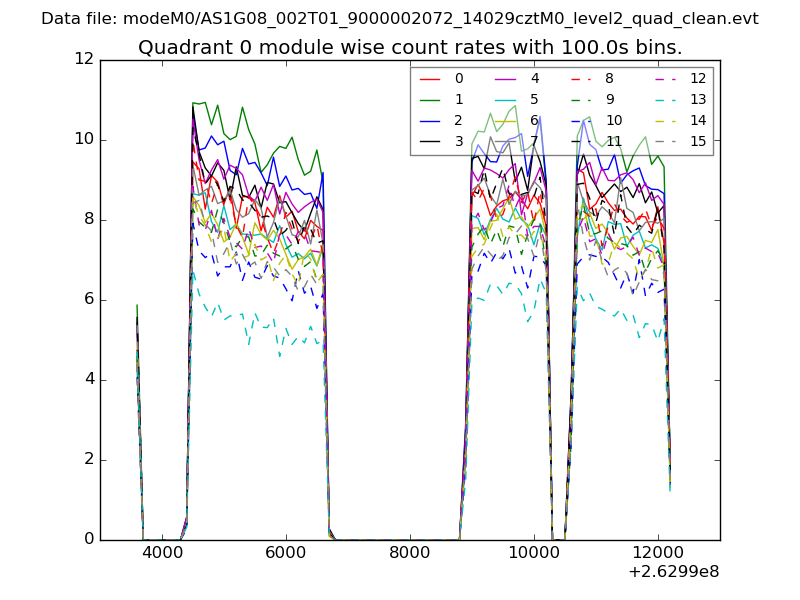
| Module-wise count rates for Quadrant A Data is divided into 100 sec bins |
 |
 |
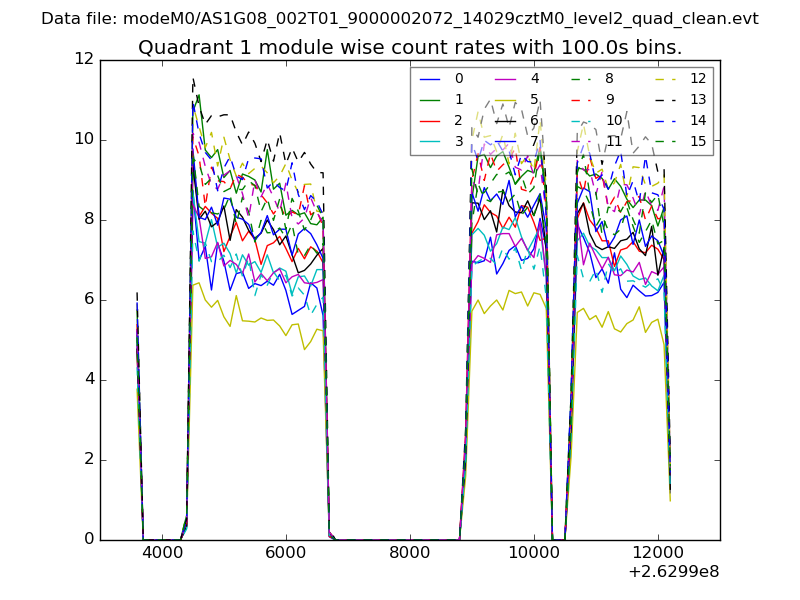
| Module-wise count rates for Quadrant B Data is divided into 100 sec bins |
 |
 |
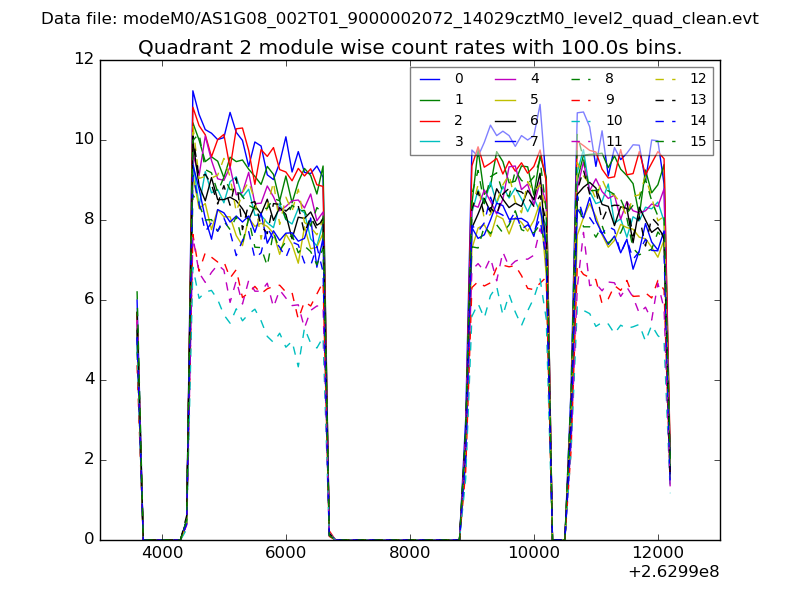
| Module-wise count rates for Quadrant C Data is divided into 100 sec bins |
 |
 |
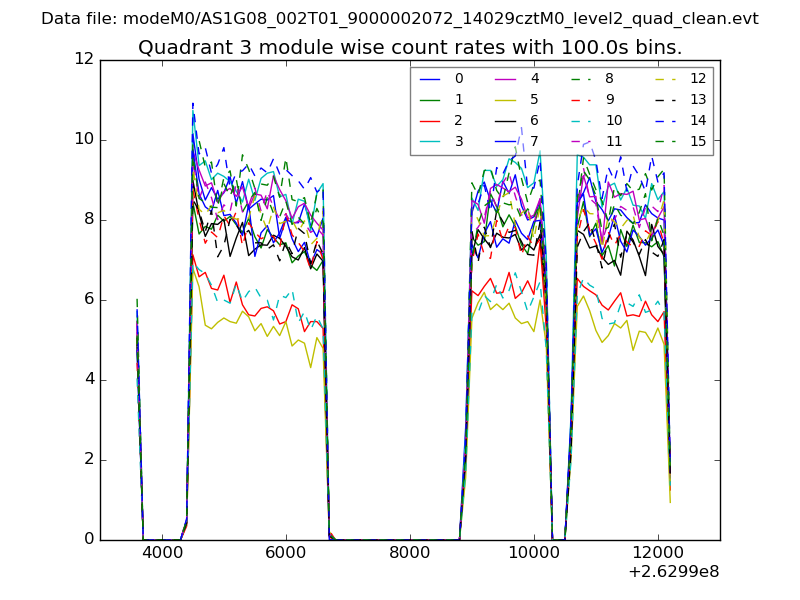
| Module-wise count rates for Quadrant D Data is divided into 100 sec bins |
 |
 |
| Parameter | Plot |
|---|---|
| CZT HV Monitor | 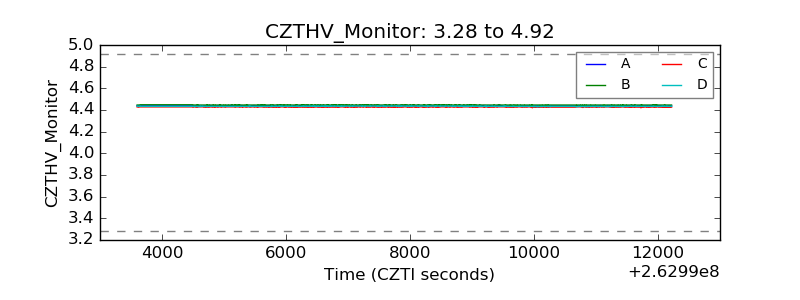 |
| D_VDD | 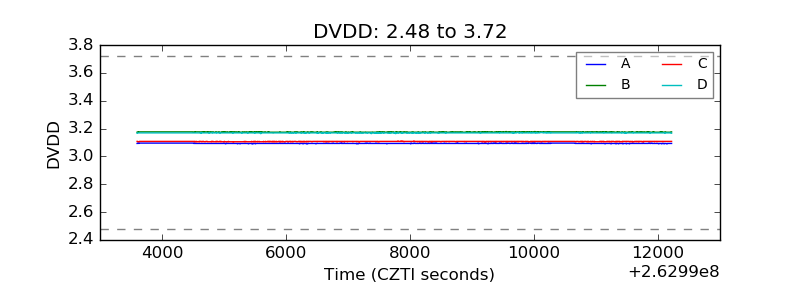 |
| Temperature 1 | 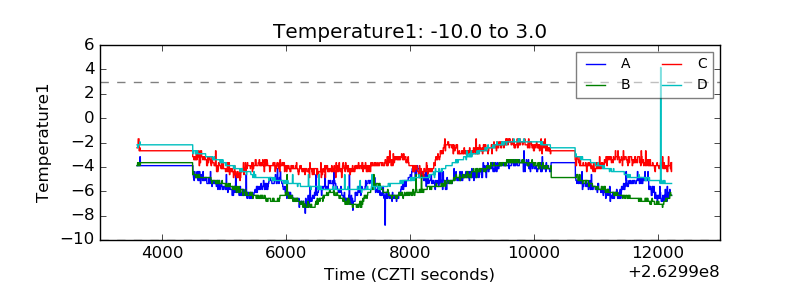 |
| Veto HV Monitor | 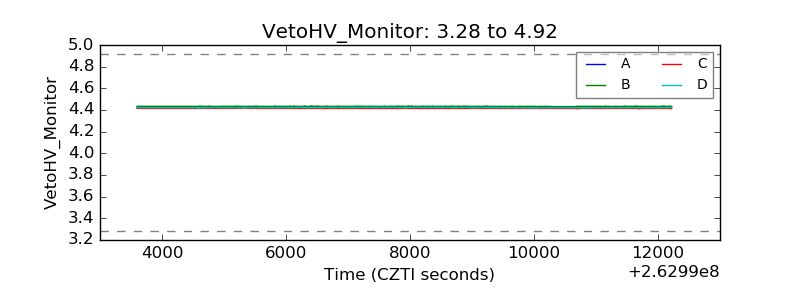 |
| Veto LLD | 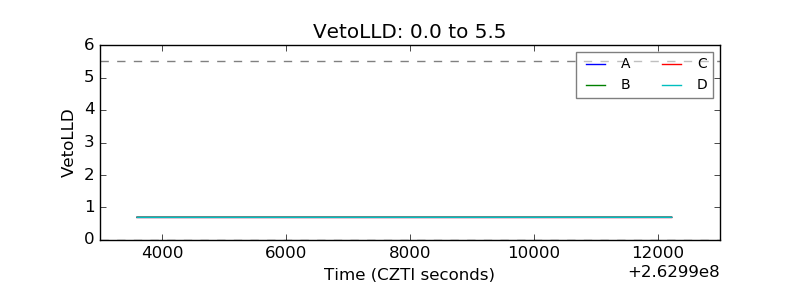 |
| Alpha Counter | 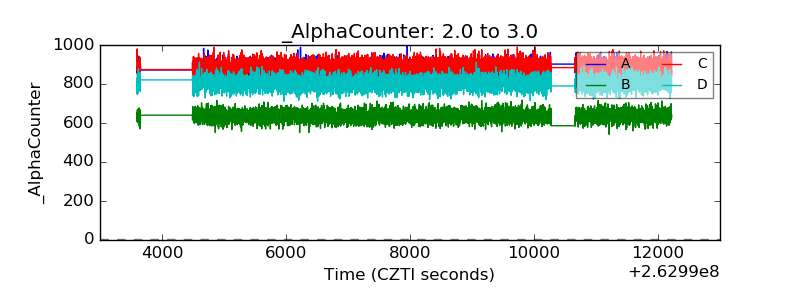 |
| _CPM_Rate | 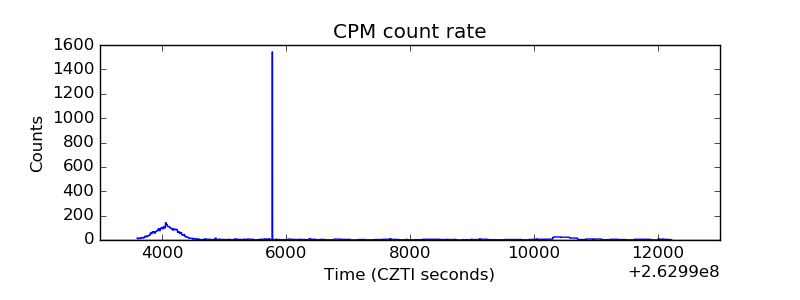 |
| CZT Counter | 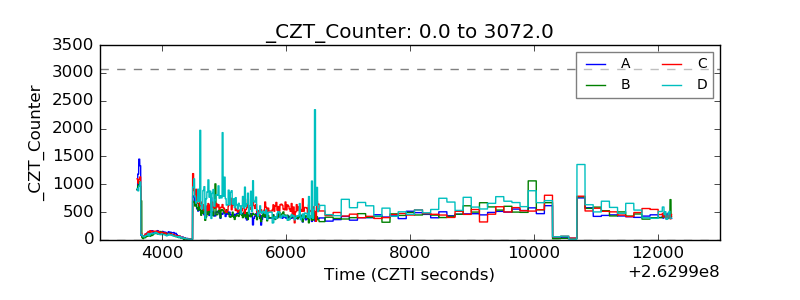 |
| +2.5 Volts monitor |  |
| +5 Volts monitor |  |
| _ROLL_ROT | 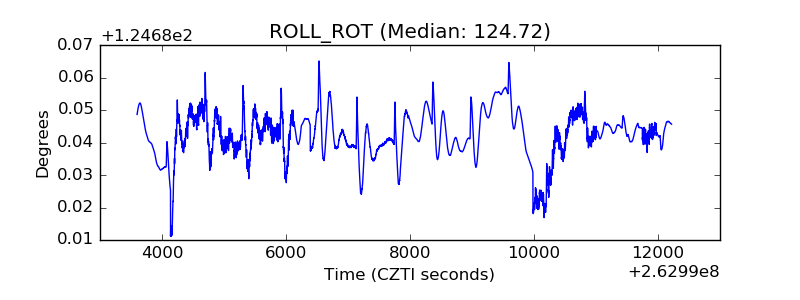 |
| _Roll_DEC | 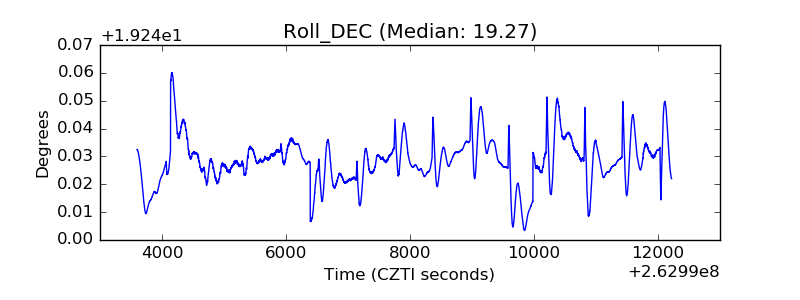 |
| _Roll_RA | 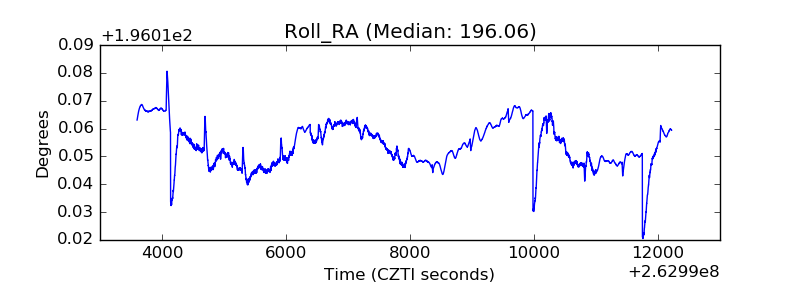 |
| Veto Counter | 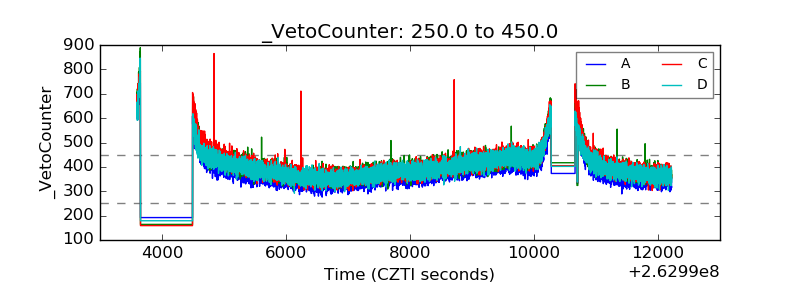 |