| Param | Original file | Final file |
|---|---|---|
| Filename | modeM0/AS1G08_002T01_9000002072_14031cztM0_level2.evt | modeM0/AS1G08_002T01_9000002072_14031cztM0_level2_quad_clean.evt |
| Size (bytes) | 550,137,600 | 94,363,200 |
| Size | 524.7 MB | 90.0 MB |
| Events in quadrant A | 3,437,133 | 590,958 |
| Events in quadrant B | 3,521,776 | 593,065 |
| Events in quadrant C | 3,733,385 | 597,264 |
| Events in quadrant D | 5,462,576 | 557,189 |
| Mode M9 | |||
|---|---|---|---|
| Quadrant | BADHDUFLAG | Total packets | Discarded packets |
| A | 0 | 3 | 0 |
| B | 0 | 3 | 0 |
| C | 0 | 3 | 0 |
| D | 0 | 3 | 0 |
| Mode SS | |||
|---|---|---|---|
| Quadrant | BADHDUFLAG | Total packets | Discarded packets |
| A | 0 | 152 | 0 |
| B | 0 | 152 | 0 |
| C | 0 | 152 | 0 |
| D | 0 | 152 | 0 |
| Mode M0 | |||
|---|---|---|---|
| Quadrant | BADHDUFLAG | Total packets | Discarded packets |
| A | 0 | 15247 | 3 |
| B | 0 | 15408 | 2 |
| C | 0 | 15828 | 2 |
| D | 0 | 21484 | 2 |
| Quadrant | Total seconds | Saturated seconds | Saturation percentage |
|---|---|---|---|
| A | 7457 | 46 | 0.616870% |
| B | 7457 | 86 | 1.153279% |
| C | 7457 | 33 | 0.442537% |
| D | 7457 | 418 | 5.605471% |
Noise dominated data is calculated using 1-second bins in cleaned event files. If a bin has >2000 counts, and if more than 50% of those come from <1% of pixels, then it is considered to be noise-dominated and hence unusable.
| Quadrant | # 1 sec bins | Bins with >0 counts | Bins with >2000 counts | High rate bins dominated by noise | Noise dominated (total time) | Noise dominated (detector-on time) | Marked lightcurve |
|---|---|---|---|---|---|---|---|
| A | 7778 | 7459 | 0 | 0 | 0.00% | 0.00% | 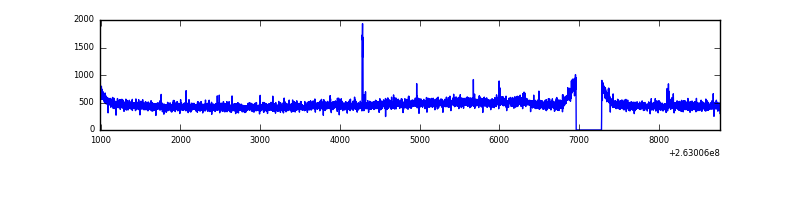 |
| B | 7778 | 7459 | 8 | 8 | 0.10% | 0.11% | 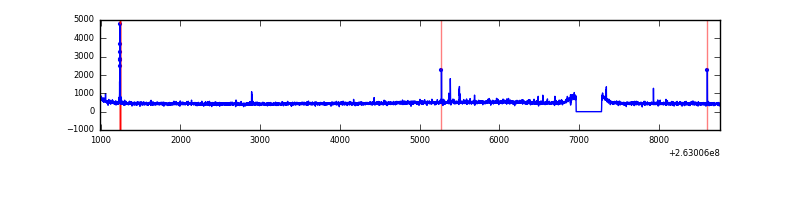 |
| C | 7778 | 7459 | 4 | 4 | 0.05% | 0.05% | 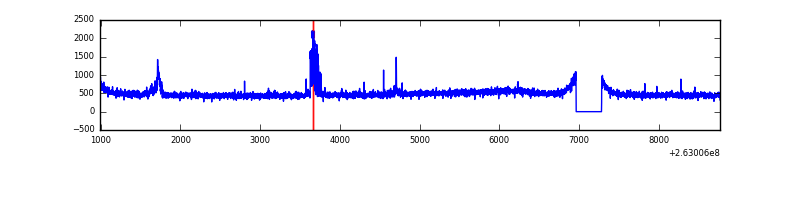 |
| D | 7778 | 7459 | 348 | 348 | 4.47% | 4.67% | 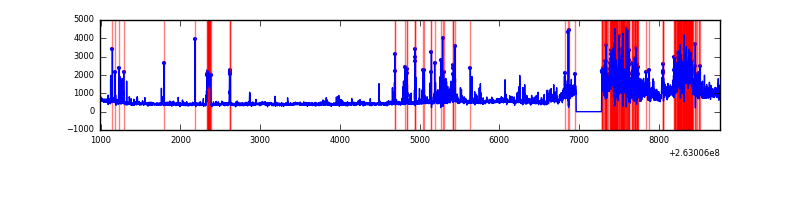 |
Top three noisy pixels from each quadrant. If the there are fewer than three noisy pixels in the level2.evt file, extra rows are filled as -1
| Pixel properties | Quadrant properties | ||||||
|---|---|---|---|---|---|---|---|
| Quadrant | DetID | PixID | Counts | Sigma | Mean | Median | Sigma |
| A | 12 | 189 | 32707 | 175.78 | 882 | 861 | 181.2 |
| A | 0 | 226 | 7749 | 38.02 | 882 | 861 | 181.2 |
| A | 2 | 79 | 7010 | 33.94 | 882 | 861 | 181.2 |
| B | 3 | 64 | 29775 | 169.39 | 878 | 856 | 170.7 |
| B | 3 | 209 | 21765 | 122.48 | 878 | 856 | 170.7 |
| B | 12 | 111 | 20593 | 115.61 | 878 | 856 | 170.7 |
| C | 3 | 233 | 197709 | 970.26 | 863 | 866 | 202.9 |
| C | 14 | 220 | 172205 | 844.55 | 863 | 866 | 202.9 |
| C | 13 | 61 | 6126 | 25.93 | 863 | 866 | 202.9 |
| D | 1 | 52 | 1195970 | 5430.2 | 830 | 812 | 220.1 |
| D | 13 | 104 | 734208 | 3332.18 | 830 | 812 | 220.1 |
| D | 10 | 157 | 199048 | 900.68 | 830 | 812 | 220.1 |
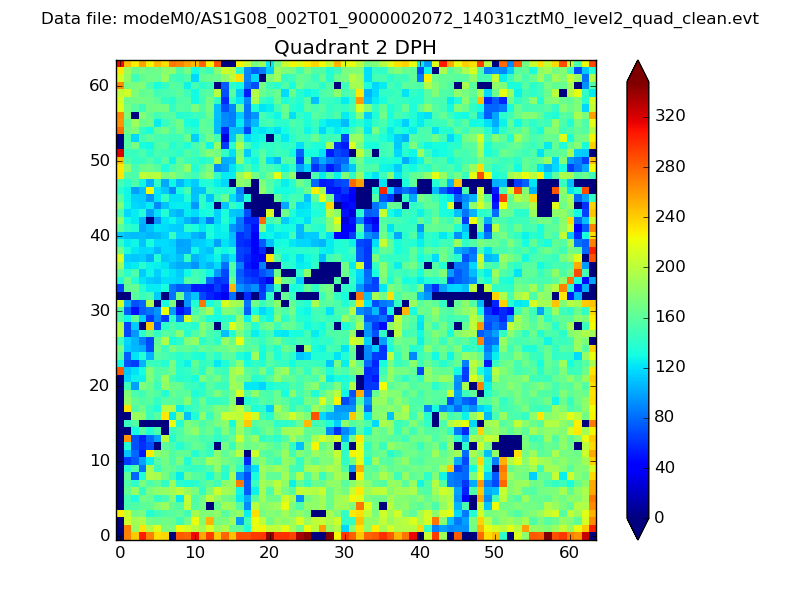
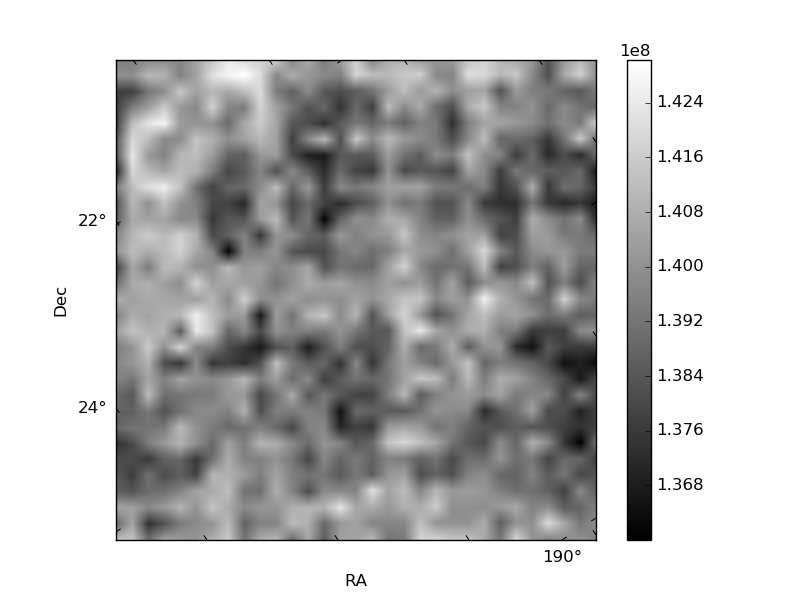
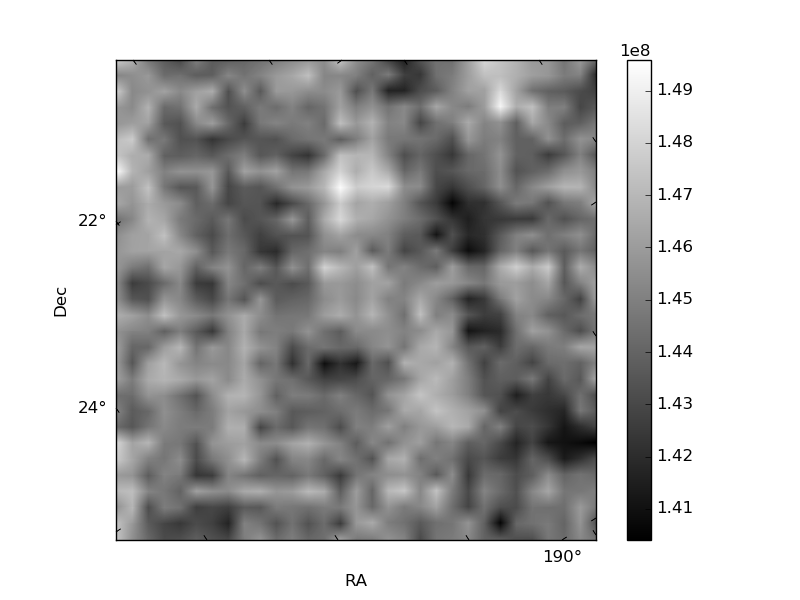
Histogram calculated using DETX and DETY for each event in the final _common_clean file
| Quadrant A | 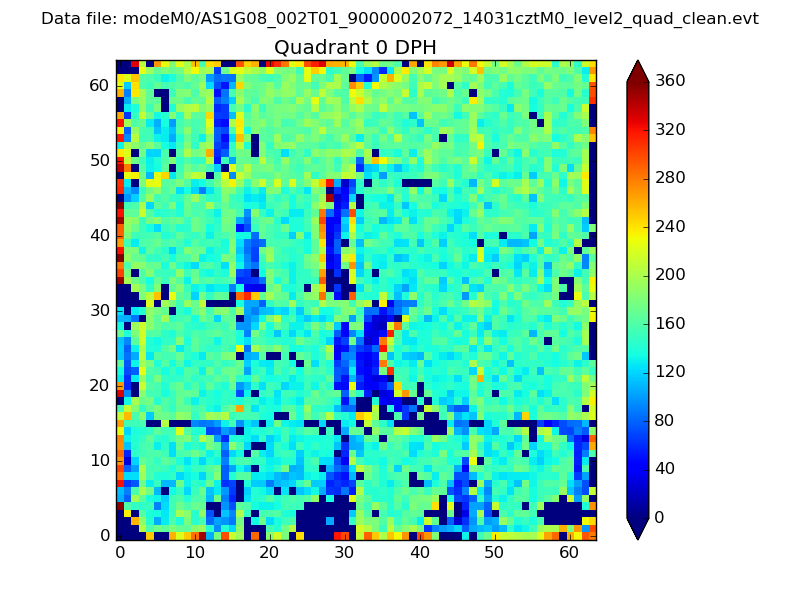 |
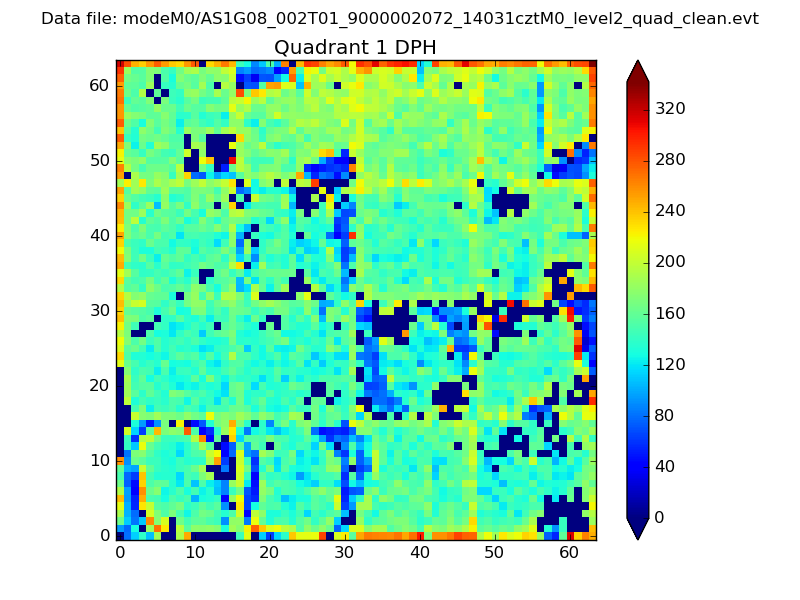 |
Quadrant B |
|---|---|---|---|
| Quadrant D | 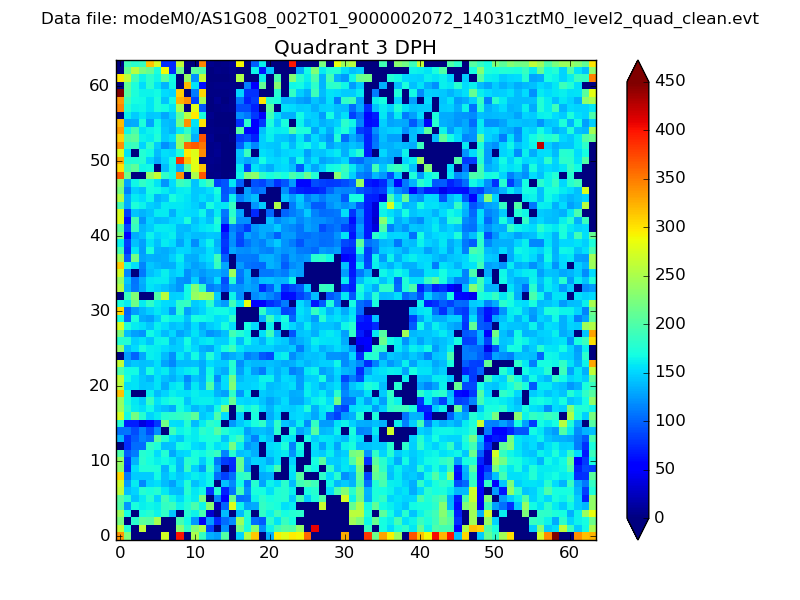 |
 |
Quadrant C |
| Plot type | Count rate plots | Images |
|---|---|---|
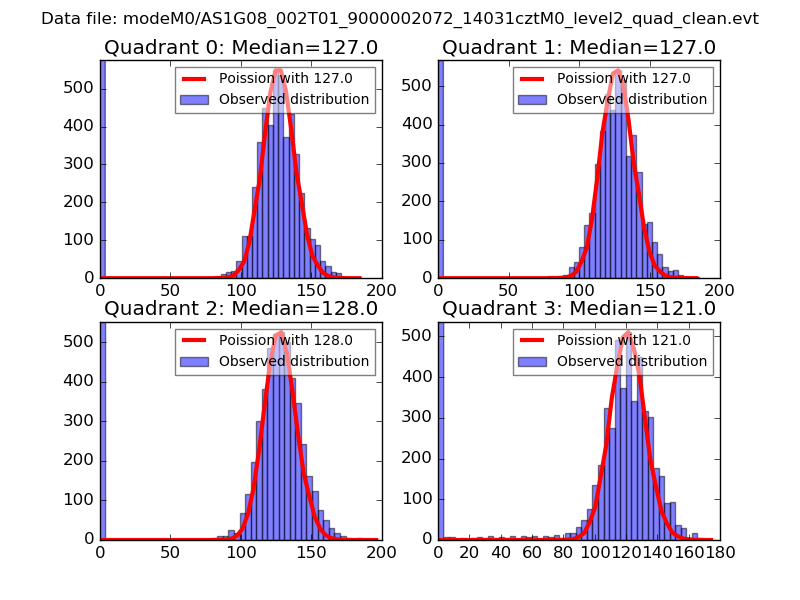
| Comparison with Poisson distribution Blue bars denote a histogram of data divided into 1 sec bins. Red curve is a Poisson curve with rate = median count rate of data. |
 |
 |
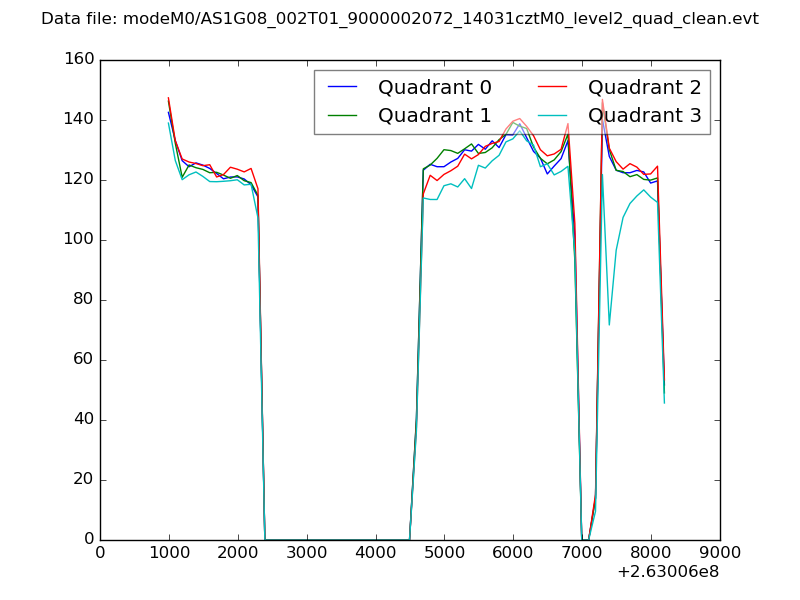
| Quadrant-wise count rates Data is divided into 100 sec bins |
 |
|
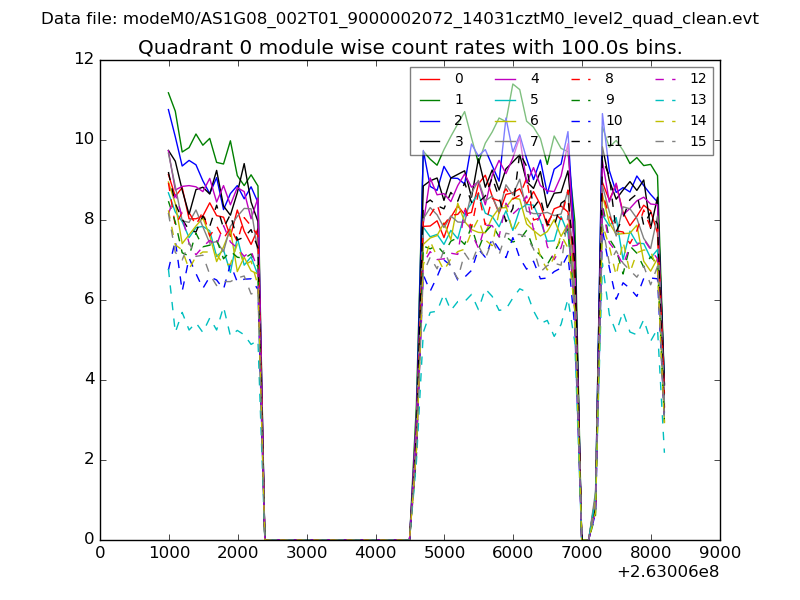
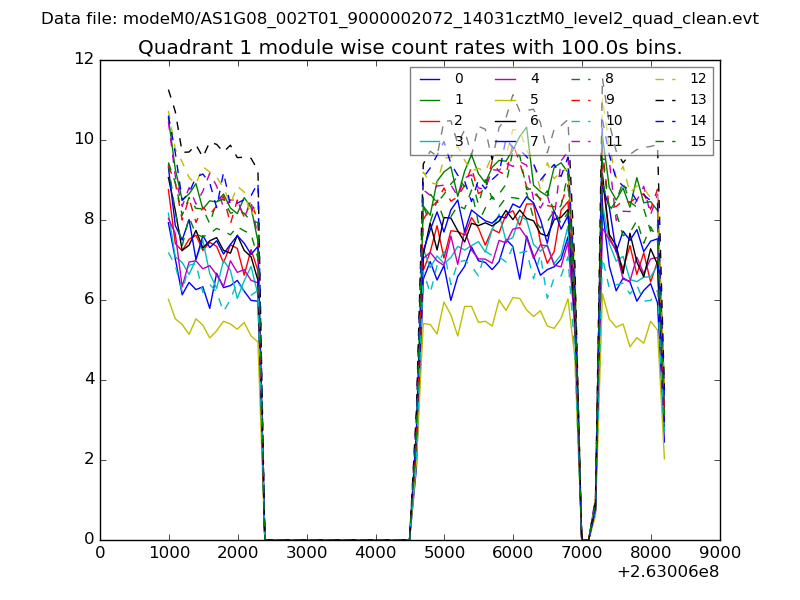
| Module-wise count rates for Quadrant A Data is divided into 100 sec bins |
 |
 |
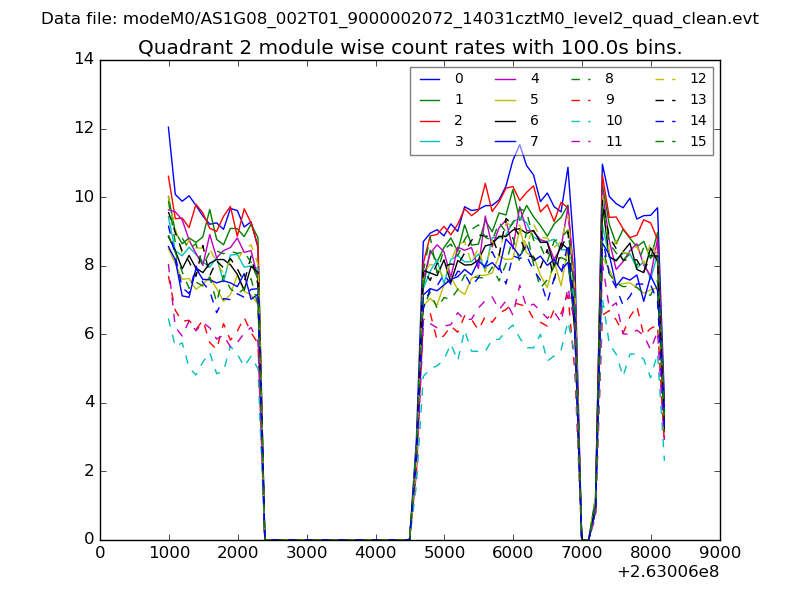
| Module-wise count rates for Quadrant B Data is divided into 100 sec bins |
 |
 |
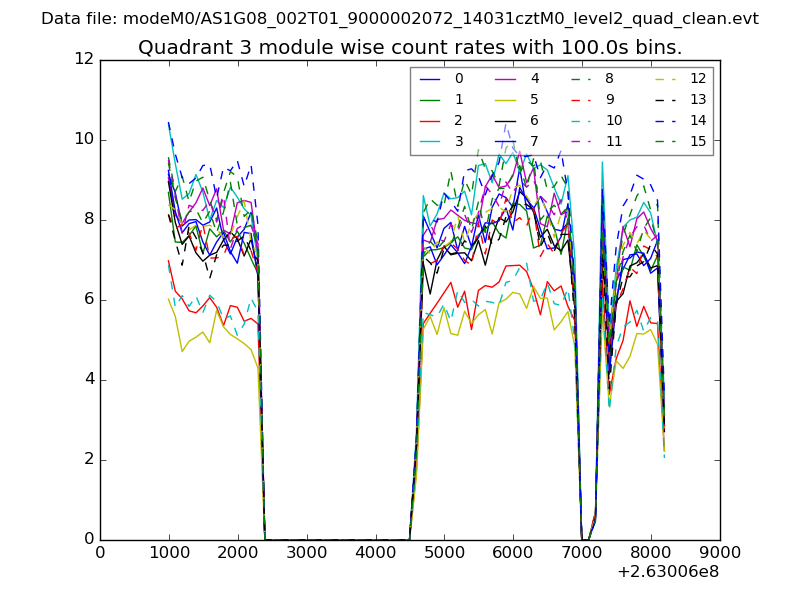
| Module-wise count rates for Quadrant C Data is divided into 100 sec bins |
 |
 |
| Module-wise count rates for Quadrant D Data is divided into 100 sec bins |
 |
 |
| Parameter | Plot |
|---|---|
| CZT HV Monitor | 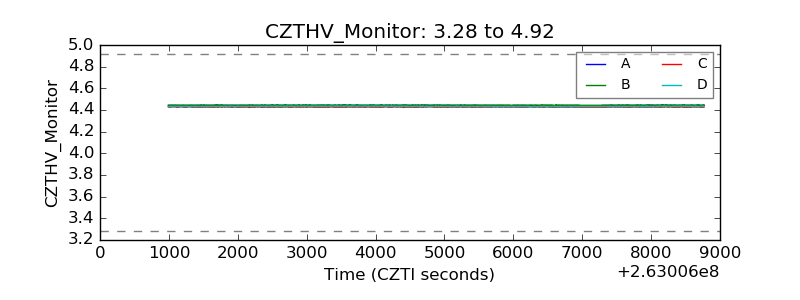 |
| D_VDD | 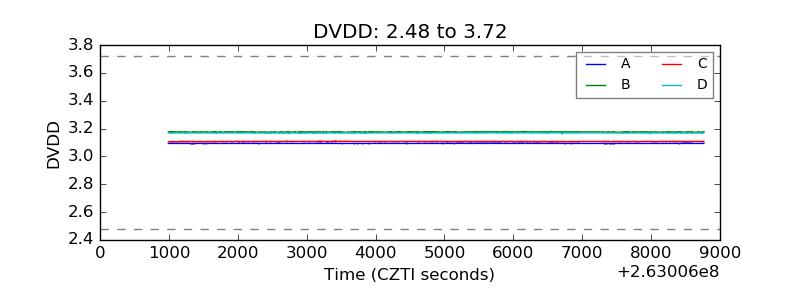 |
| Temperature 1 | 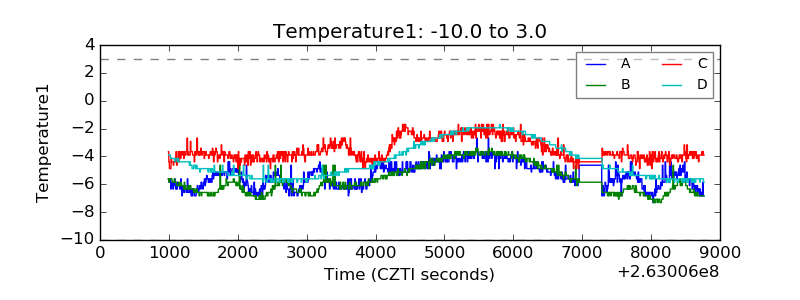 |
| Veto HV Monitor | 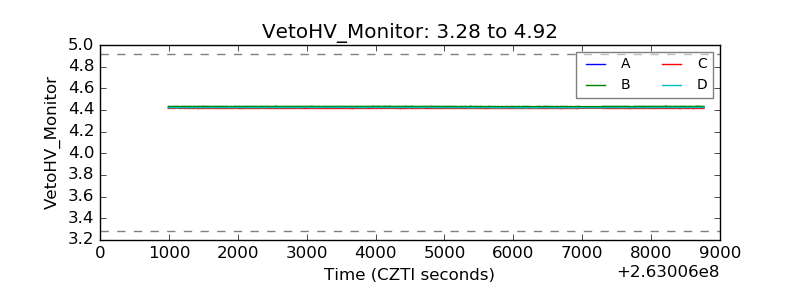 |
| Veto LLD | 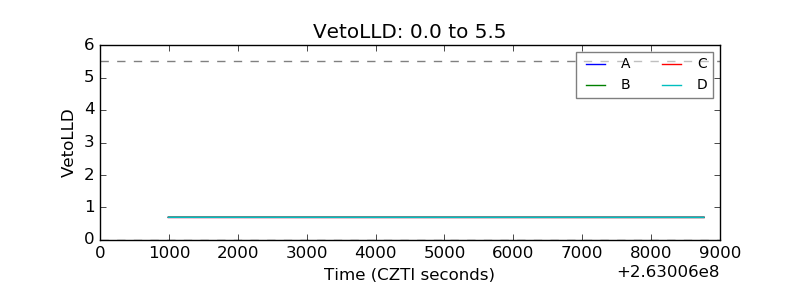 |
| Alpha Counter | 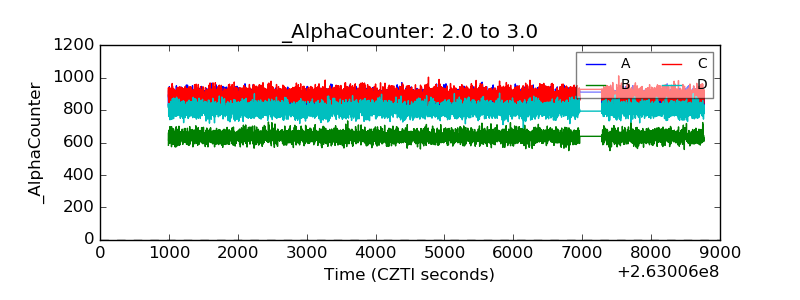 |
| _CPM_Rate | 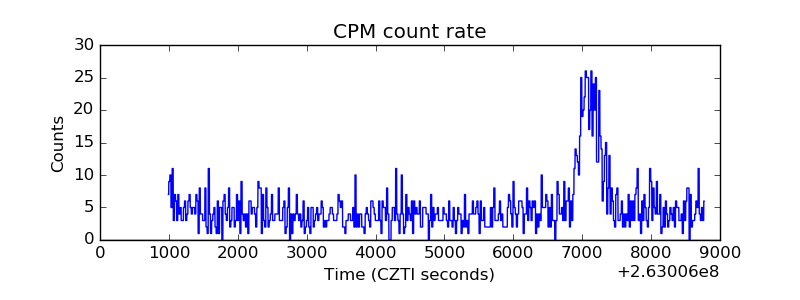 |
| CZT Counter | 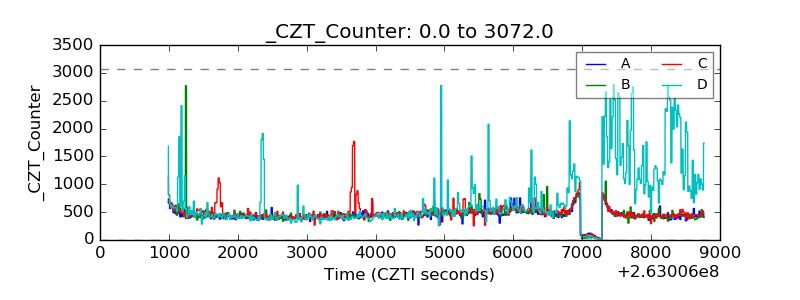 |
| +2.5 Volts monitor |  |
| +5 Volts monitor |  |
| _ROLL_ROT | 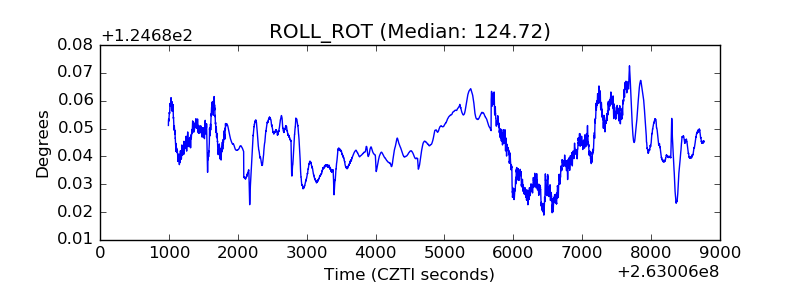 |
| _Roll_DEC | 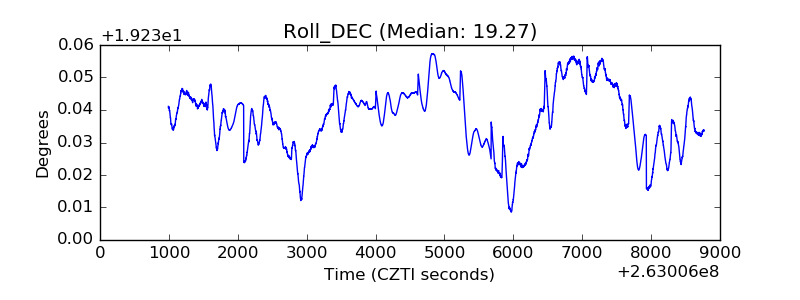 |
| _Roll_RA | 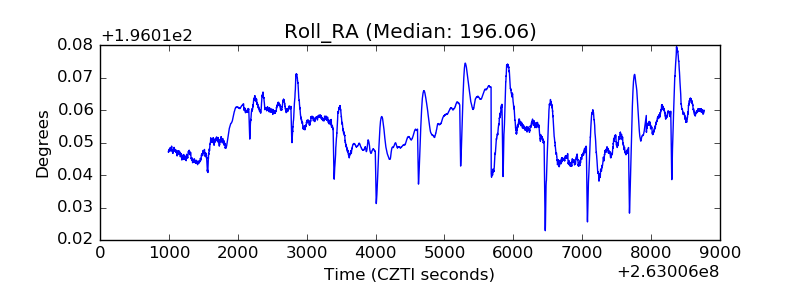 |
| Veto Counter | 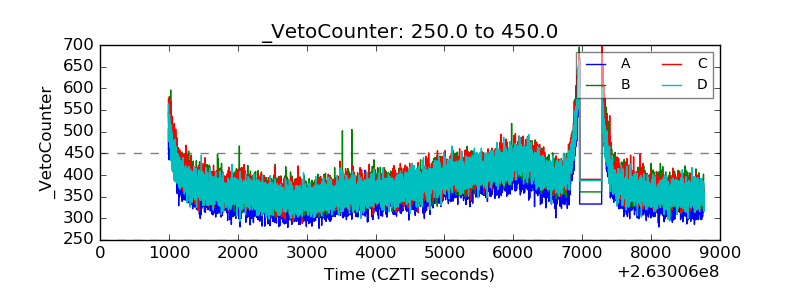 |