| Param | Original file | Final file |
|---|---|---|
| Filename | modeM0/AS1G08_002T01_9000002072_14035cztM0_level2.evt | modeM0/AS1G08_002T01_9000002072_14035cztM0_level2_quad_clean.evt |
| Size (bytes) | 469,235,520 | 73,503,360 |
| Size | 447.5 MB | 70.1 MB |
| Events in quadrant A | 3,279,868 | 439,991 |
| Events in quadrant B | 3,311,293 | 444,759 |
| Events in quadrant C | 3,324,977 | 442,014 |
| Events in quadrant D | 3,838,491 | 430,632 |
| Mode M9 | |||
|---|---|---|---|
| Quadrant | BADHDUFLAG | Total packets | Discarded packets |
| A | 0 | 16 | 0 |
| B | 0 | 16 | 0 |
| C | 0 | 16 | 0 |
| D | 0 | 17 | 0 |
| Mode SS | |||
|---|---|---|---|
| Quadrant | BADHDUFLAG | Total packets | Discarded packets |
| A | 0 | 136 | 0 |
| B | 0 | 136 | 0 |
| C | 0 | 136 | 0 |
| D | 0 | 136 | 0 |
| Mode M0 | |||
|---|---|---|---|
| Quadrant | BADHDUFLAG | Total packets | Discarded packets |
| A | 0 | 13963 | 3 |
| B | 0 | 13975 | 2 |
| C | 0 | 13958 | 2 |
| D | 0 | 15720 | 2 |
| Quadrant | Total seconds | Saturated seconds | Saturation percentage |
|---|---|---|---|
| A | 6718 | 84 | 1.250372% |
| B | 6718 | 84 | 1.250372% |
| C | 6718 | 67 | 0.997321% |
| D | 6718 | 125 | 1.860673% |
Noise dominated data is calculated using 1-second bins in cleaned event files. If a bin has >2000 counts, and if more than 50% of those come from <1% of pixels, then it is considered to be noise-dominated and hence unusable.
| Quadrant | # 1 sec bins | Bins with >0 counts | Bins with >2000 counts | High rate bins dominated by noise | Noise dominated (total time) | Noise dominated (detector-on time) | Marked lightcurve |
|---|---|---|---|---|---|---|---|
| A | 7714 | 6720 | 0 | 0 | 0.00% | 0.00% | 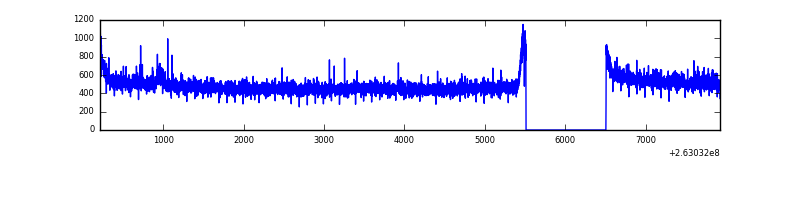 |
| B | 7714 | 6720 | 0 | 0 | 0.00% | 0.00% | 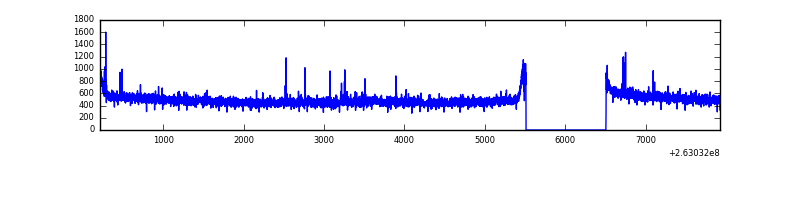 |
| C | 7714 | 6720 | 0 | 0 | 0.00% | 0.00% | 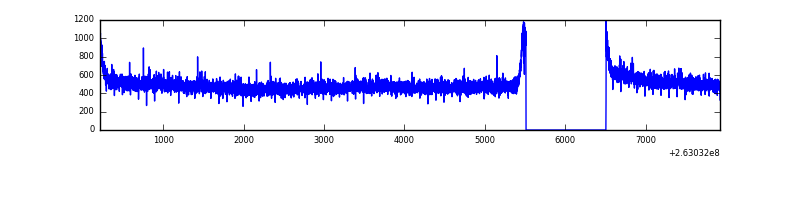 |
| D | 7714 | 6720 | 40 | 40 | 0.52% | 0.60% | 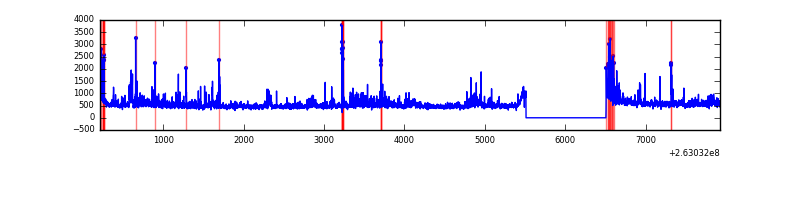 |
Top three noisy pixels from each quadrant. If the there are fewer than three noisy pixels in the level2.evt file, extra rows are filled as -1
| Pixel properties | Quadrant properties | ||||||
|---|---|---|---|---|---|---|---|
| Quadrant | DetID | PixID | Counts | Sigma | Mean | Median | Sigma |
| A | 1 | 162 | 13038 | 70.84 | 844 | 827 | 172.4 |
| A | 15 | 69 | 10365 | 55.33 | 844 | 827 | 172.4 |
| A | 0 | 226 | 7372 | 37.97 | 844 | 827 | 172.4 |
| B | 12 | 111 | 19770 | 117.72 | 836 | 815 | 161.0 |
| B | 11 | 111 | 16984 | 100.42 | 836 | 815 | 161.0 |
| B | 14 | 111 | 14386 | 84.28 | 836 | 815 | 161.0 |
| C | 3 | 233 | 133583 | 703.87 | 815 | 821 | 188.6 |
| C | 14 | 220 | 12545 | 62.16 | 815 | 821 | 188.6 |
| C | 13 | 61 | 5842 | 26.62 | 815 | 821 | 188.6 |
| D | 1 | 52 | 583358 | 3012.12 | 808 | 788 | 193.4 |
| D | 8 | 195 | 79480 | 406.87 | 808 | 788 | 193.4 |
| D | 2 | 152 | 37842 | 191.58 | 808 | 788 | 193.4 |
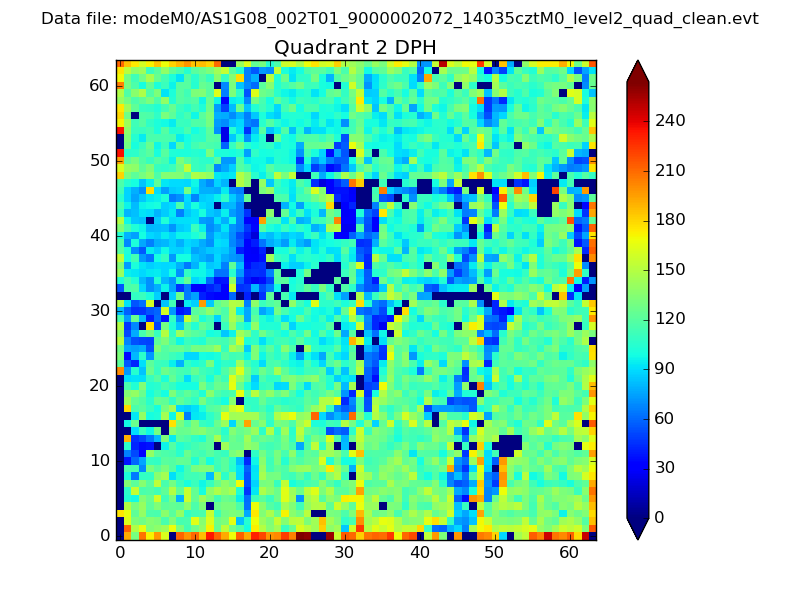
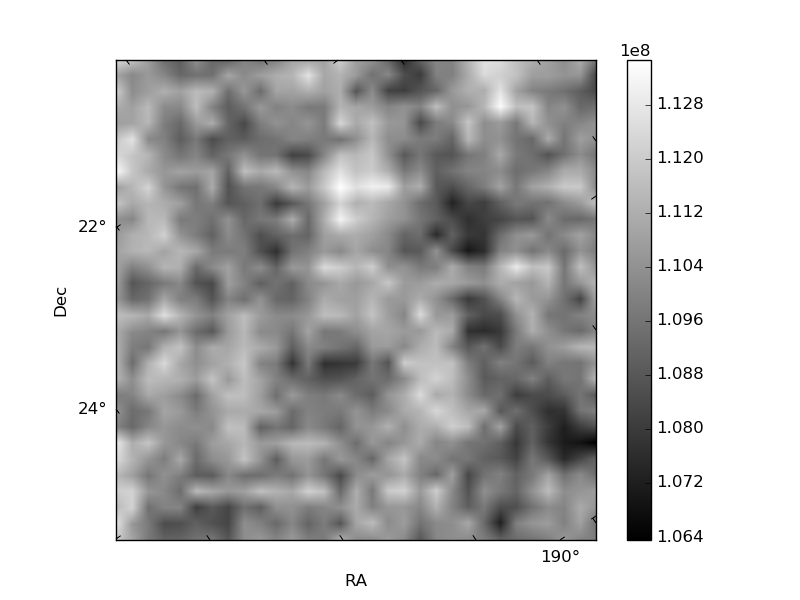
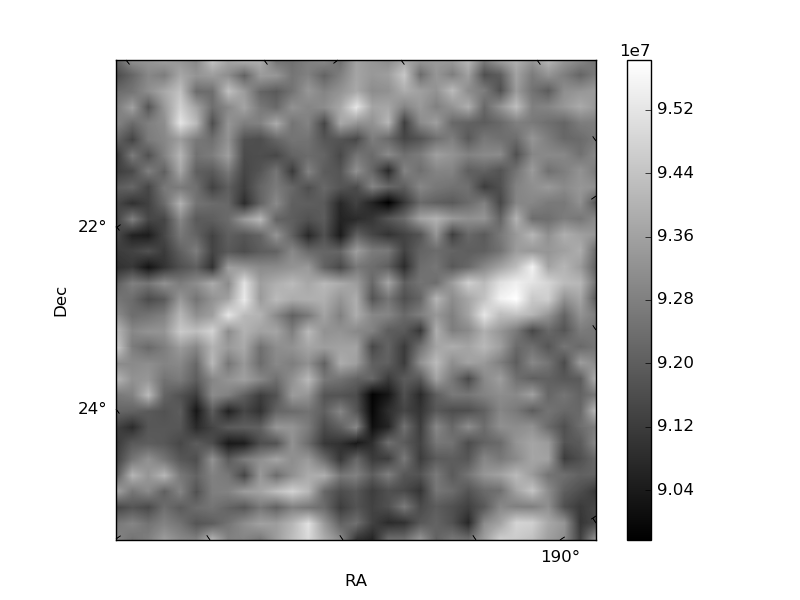
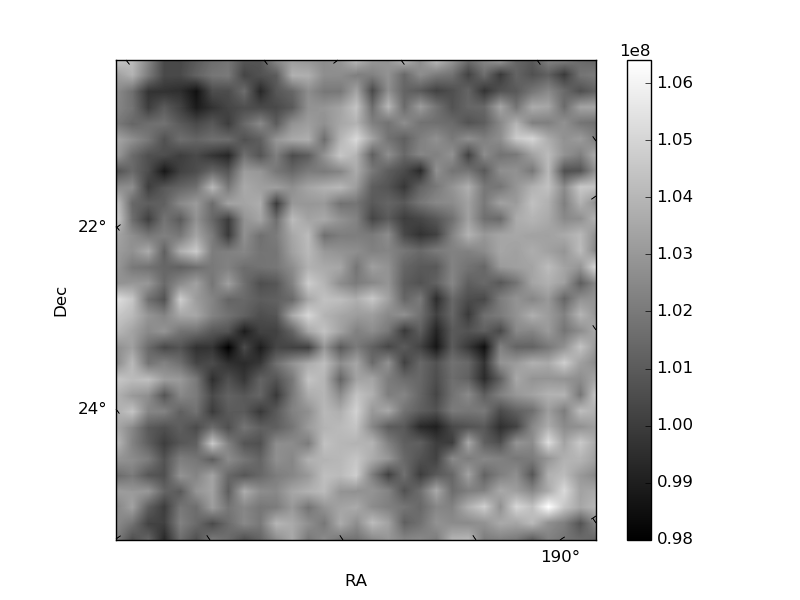
Histogram calculated using DETX and DETY for each event in the final _common_clean file
| Quadrant A | 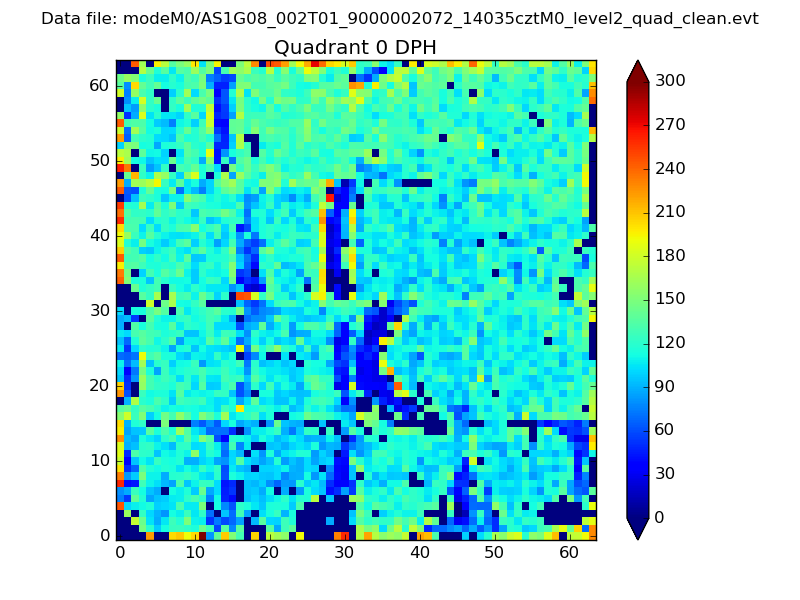 |
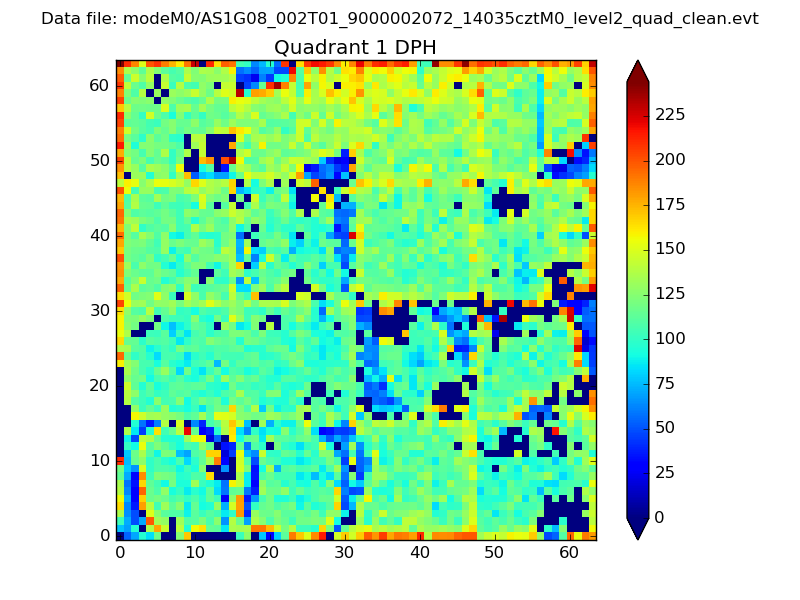 |
Quadrant B |
|---|---|---|---|
| Quadrant D | 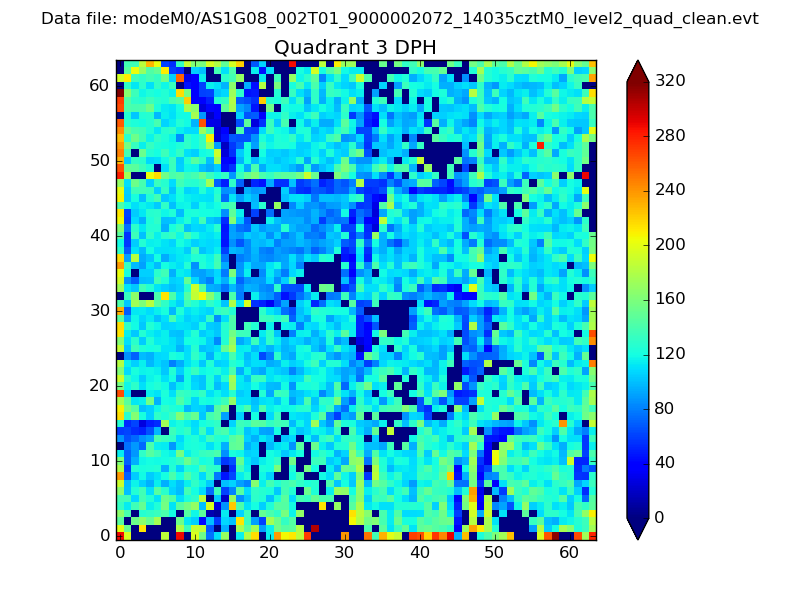 |
 |
Quadrant C |
| Plot type | Count rate plots | Images |
|---|---|---|
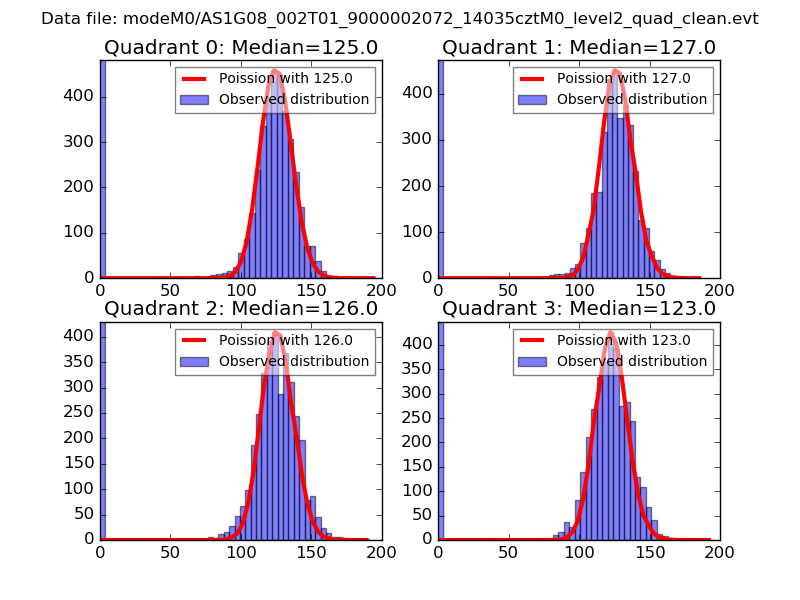
| Comparison with Poisson distribution Blue bars denote a histogram of data divided into 1 sec bins. Red curve is a Poisson curve with rate = median count rate of data. |
 |
 |
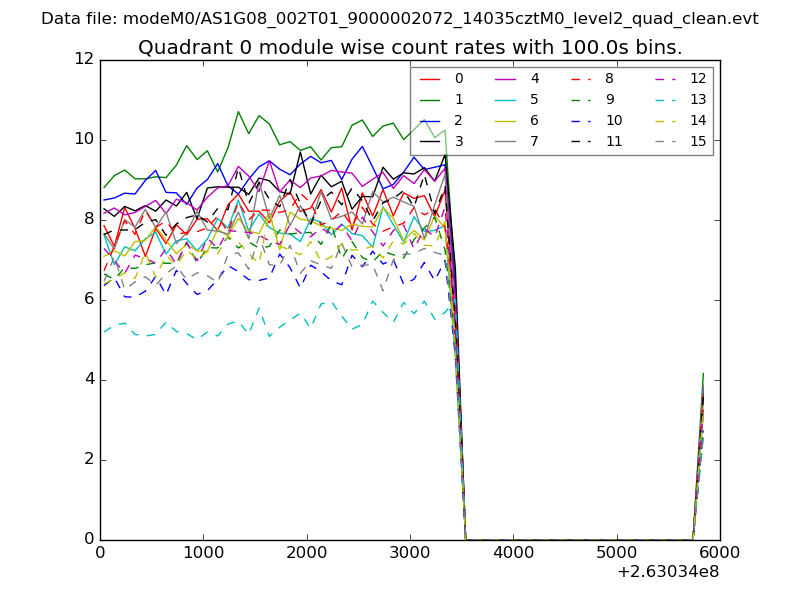
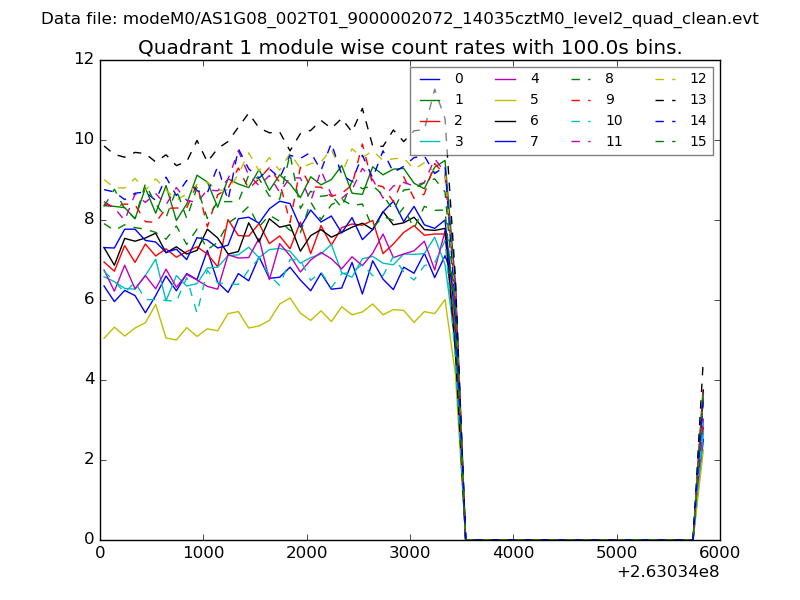
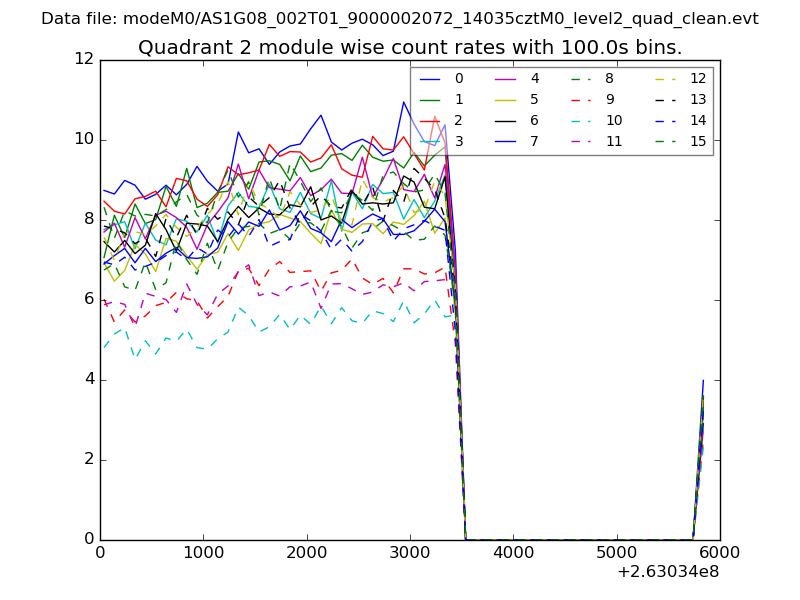
| Quadrant-wise count rates Data is divided into 100 sec bins |
 |
|
| Module-wise count rates for Quadrant A Data is divided into 100 sec bins |
 |
 |
| Module-wise count rates for Quadrant B Data is divided into 100 sec bins |
 |
 |
| Module-wise count rates for Quadrant C Data is divided into 100 sec bins |
 |
 |
| Module-wise count rates for Quadrant D Data is divided into 100 sec bins |
 |
 |
| Parameter | Plot |
|---|---|
| CZT HV Monitor | 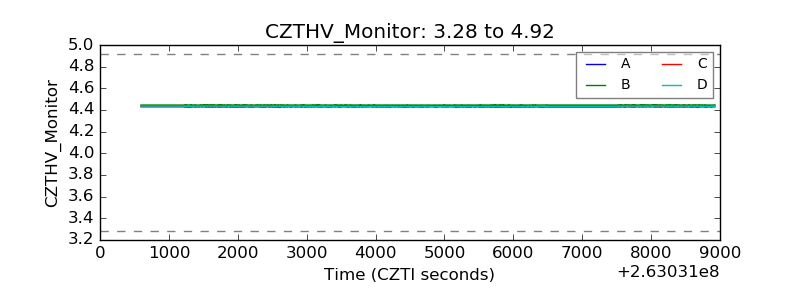 |
| D_VDD | 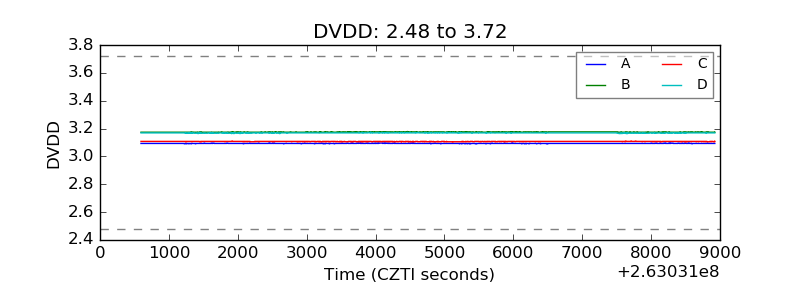 |
| Temperature 1 | 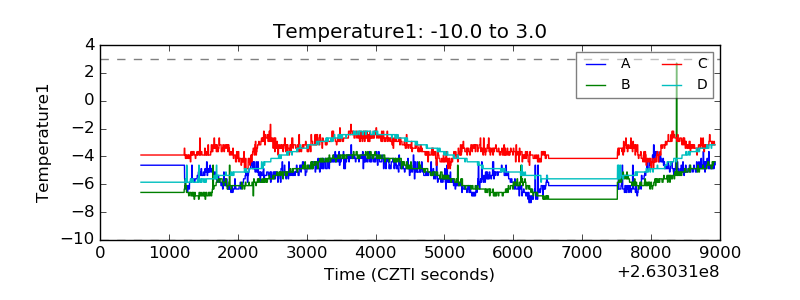 |
| Veto HV Monitor | 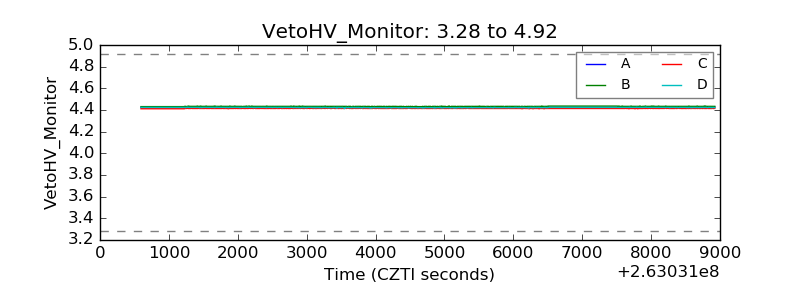 |
| Veto LLD | 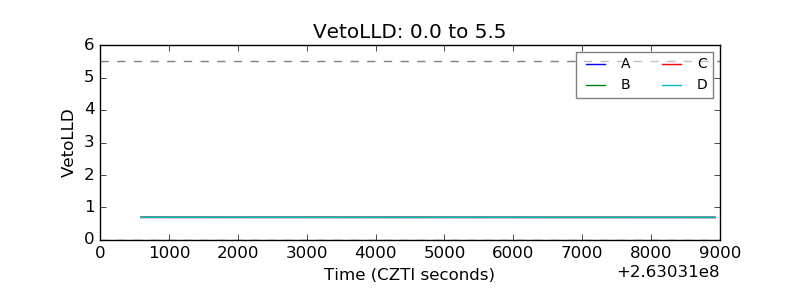 |
| Alpha Counter |  |
| _CPM_Rate | 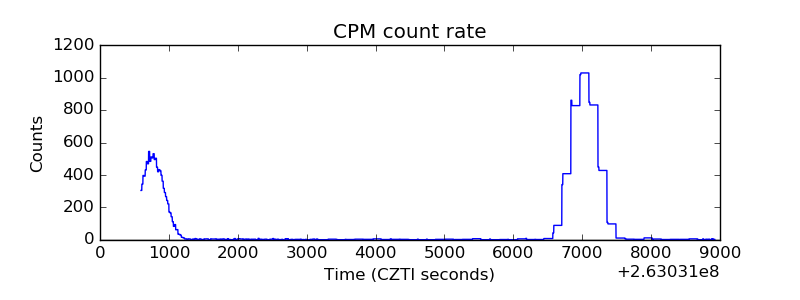 |
| CZT Counter | 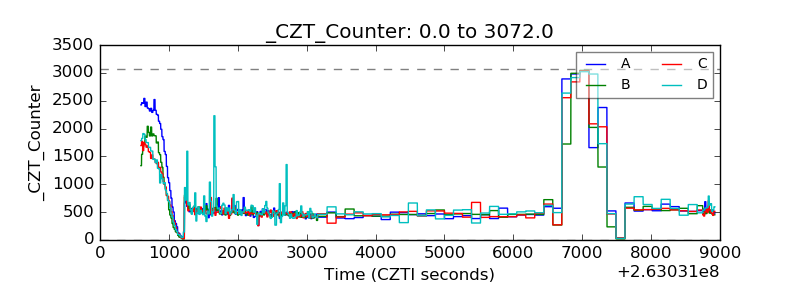 |
| +2.5 Volts monitor |  |
| +5 Volts monitor |  |
| _ROLL_ROT | 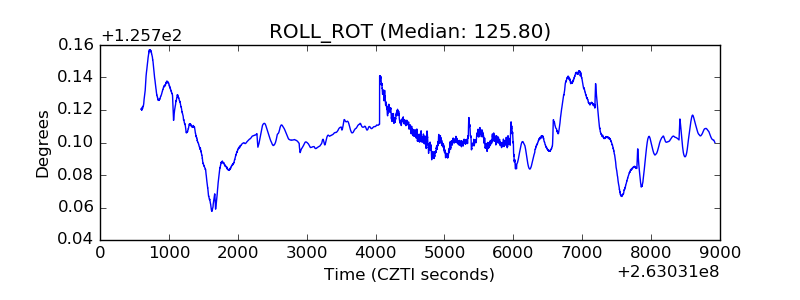 |
| _Roll_DEC | 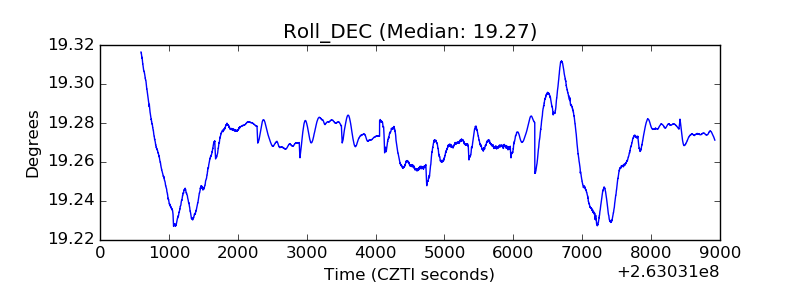 |
| _Roll_RA | 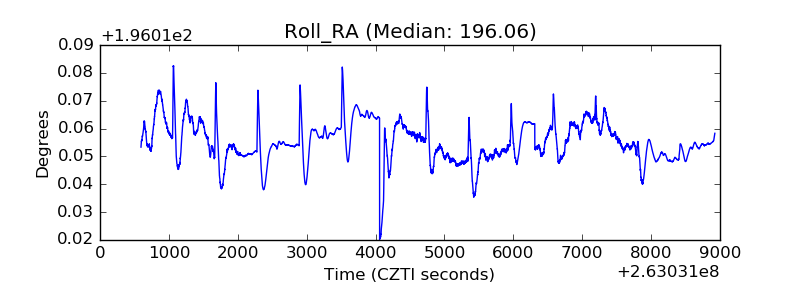 |
| Veto Counter | 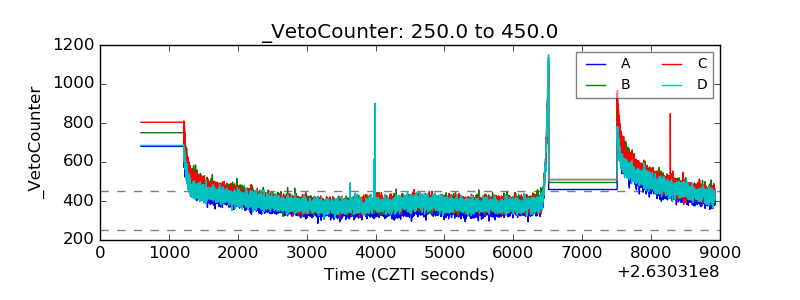 |